To cite this document: Liaw, Horng-Jang and Gerbaud, Vincent and Chen, Chan-Cheng and Shu, Chi-Min ( 2010) Effect of stirring on the safety of flammable liquid mixtures. Journal of Hazardous Materials, vol. 177 (n° 1-3). pp. 1093-1101. ISSN 0304-3894
This is an author-deposited version published in: http://oatao.univ-toulouse.fr/
Eprints ID: 3872
Any correspondence concerning this service should be sent to the repository administrator: [email protected]
Effect of Stirring on the Safety of Flammable Liquid Mixtures
Horng-Jang Liaw a, Vincent Gerbaud b,Chan-Cheng Chen c, Chi-Min Shu d
a
Department of Occupational Safety and Health China Medical University
Taichung, Taiwan, ROC
bUniversité de Toulouse, LGC (Laboratoire de Génie Chimique), CNRS, INP, UPS
5 allées Emile Monso, F-31029 Toulouse cedex 4, France
cDepartment of Safety, Health and Environmental Engineering
National Kaohsiung First University of Science and Technology Yuanchau, Kaohsiung, Taiwan, ROC
dDepartment of Safety, Health and Environmental Engineering
National Yunlin University of Science and Technology Douliou, Yunlin, Taiwan, ROC
Address correspondence to: Dr. Horng-Jang Liaw
Department of Occupational Safety and Health China Medical University
91 Hsueh-Shih Rd., Taichung, Taiwan
Tel: 886-4-22053366 ext. 6209 Fax: 886-4-22030418
Effect of Stirring on the Safety of Flammable Liquid Mixtures
Horng-Jang Liaw a, Vincent Gerbaud b,Chan-Cheng Chen c, Chi-Min Shu d
aDepartment of Occupational Safety and Health, China Medical University
91 Hsueh-Shih Rd., Taichung, Taiwan
bUniversité de Toulouse, LGC (Laboratoire de Génie Chimique)
CNRS, INP, UPS
5 allée Emile Monso, F-31029 Toulouse Cedex 4, France
c
Department of Safety, Health and Environmental Engineering National Kaohsiung First University of Science and Technology
1 University Rd., Yuanchau, Kaohsiung, Taiwan
dDepartment of Safety, Health and Environmental Engineering
National Yunlin University of Science and Technology 123 University Rd., Sec. 3, Douliou, Yunlin, Taiwan
ABSTRACT
Flash point is the most important variable employed to characterize fire and explosion hazard of liquids. The models developed for predicting the flash point of partially miscible mixtures in the literature to date are all based on the assumption of
liquid−liquid equilibrium. In real−world environments, however, the liquid−liquid
equilibrium assumption does not always hold, such as the collection or accumulation of waste solvents without stirring, where complete stirring for a period of time is usually used to ensure the liquid phases being in equilibrium. This study investigated the effect of stirring on the flash point behavior of binary partially miscible mixtures.
Two series of partially miscible binary mixtures were employed to elucidate the effect
of stirring. The first series was aqueous−organic mixtures, including water +
1-butanol, water + 2-butanol, water + isobutanol, water + 1-pentanol, and water + octane; the second series was the mixtures of two flammable solvents, which included methanol + decane, methanol + 2,2,4-trimethylpentane, and methanol + octane.
Results reveal that for binary aqueous−organic solutions the flash-point values of
unstirred mixtures were located between those of the completely stirred mixtures and those of the flammable component. Therefore, risk assessment could be done based on the flammable component flash point value. However, for the assurance of safety, it is suggested to completely stir those mixtures before handling to reduce the risk.
Keywords: Flash point; Partially miscible mixtures; Stirring effect; Liquid−liquid
1. Introduction
In a given liquid, the flash point is the temperature determined experimentally at which the substance emits sufficient vapor to form a combustible mixture with air [1]. The lower the flash-point value, the greater the fire and explosion hazard [2]. Recently, the importance of flash point was dramatically highlighted in Taiwan after a series of explosions of essential oils and after the Shengli event. In the former series of accidents, six blasts occurring from January through August of 2003 left eight people badly burned. The fire and explosion hazard of liquids, such as essential oils, is primarily characterized by their flash point [3]. The Shengli event led to the temporary storage of large quantities of waste organic solutions at various factory sites and industrial park precincts [4, 5]. Thus, knowledge of flash-point data for these mixtures has become increasingly important to ensure safety of this voluminous storage. On April 29, 2007, a gasoline tanker crashed and burst into
flames near the San Francisco−Oakland Bay Bridge in the USA, creating such an
intense heat that a stretch of highway melted and collapsed. The transportation safety requirements for flammable liquids are primarily related to their flash-point values [6]. Thus, flash point is the most important variable used to characterize the fire and explosion hazard of liquids either in usage, storage, or transportation.
The UN (United Nations) encouraged the worldwide implementation of the GHS (Globally Harmonized System of Classification and Labeling of Chemicals) in 2008. In the implementation of the GHS, the flash point of mixtures is the critical property in the classification of flammable liquids. Unfortunately, flash-point data for a variety of mixtures are scarce in the literature, although composition ranges for specific mixtures used or produced in an industrial process can vary quite substantially. It is time-consuming work to derive flash-point data for mixtures
using test instruments. Thus, the EU (European Union) declared that the classification of mixtures would be delayed until 2015 [7]. The flash points of
partially miscible mixtures are the least studied despite their use in the liquid−liquid
extraction processes [8, 9] and heterogeneous distillation processes [10] encountered in many chemical plants. Flash-point data for partially miscible mixtures are urgently needed to facilitate evaluation of fire and explosion hazards. Our review of the literature revealed that the only published data available for partially miscible mixtures are those reported in our previous studies [11, 12, 13]. These data were all obtained under complete stirring in order to ensure the liquid phases to be in equilibrium. However, in the real world, partially miscible mixtures, such as the collection or accumulation of waste solvents, are not always under complete stirring. Rather, depending on their composition and density, they may exhibit phase decantation with the lightest phase above.
Since the cost of deriving flash-point data from test instruments is very high, NT$20,000/US$600 per sample in Taiwan, several alternative models for predicting the flash points of different type of mixtures have been proposed, especially for miscible mixtures [3-5, 14-22]. However, to our knowledge, only three models have been proposed for partially miscible mixtures to date. The first is for binary partially miscible mixtures of flammable solvents, developed by Liaw et al. (2008), and its accuracy was verified using experimental data [11]. The second is for binary
partially miscible aqueous−organic mixtures, and was also recently proposed by
Liaw et al. (2008), with successful verification based on comparison with the experimental data [12]. The third is for ternary partially miscible mixtures of flammable solvents, also developed by Liaw et al. (2009), with prediction of flash point verified for both type-I and type-II mixtures [13]. These three models are all
based on the assumption that the two liquid phases are in equilibrium with their compositions. The flash-point value for a given mixture is relative to its vapor pressure [2], which is dependent on the composition of the liquid phase. As the
assumption of liquid−liquid equilibrium is not always true, we infer that flash point
behavior for this case is quite different from that under liquid−liquid equilibrium
(LLE). Thus, the effect of stirring on the flash point of binary partially miscible
mixtures was investigated for aqueous−organic solutions and mixtures of
flammable solvents. A mutual solubility region exists for the partially miscible
aqueous−organic mixtures investigated in this study: water + 1-butanol, water +
2-butanol, water + isobutanol and water + 1-pentanol. However, octane is almost immiscible to water, and the reverse also holds. For the mixtures of flammable solvents, methanol + octane and methanol + 2,2,4-trimethylpentane, which exhibit minimum flash point behavior, and methanol + decane, which has an unremarkable minimum flash point behavior, were also investigated as examples.
2. Experimental protocol
An HFP 362-Tag Flash Point Analyzer (Walter Herzog GmbH, Germany), which meets the requirements of the ASTM D56 standard [23], was used to measure the flash points with and without stirring for a variety of partially miscible mixtures (water + 1-butanol, water + 2-butanol, water + isobutanol, water + 1-pentanol, water + octane, methanol + decane, methanol + 2,2,4-trimethylpentane, and methanol + octane) at different compositions. The apparatus incorporates control devices that program the instrument to heat the sample at a specified rate within a temperature range close to the expected flash point. The flash point is automatically tested using an igniter at specified temperature test intervals. If the
expected flash point is lower than or equal to the change temperature, heat rate-1 is used and the igniter is fired at test interval-1. If the expected flash point is higher, heat rate-2 is adopted and the igniter is fired at test interval-2. The first flash-point test series is initiated at a temperature equivalent to the expected flash point minus the start-test value. If the flash point is not determined when the test temperature exceeds the sum of the expected flash point plus the end-of-test value, the experimental iteration is terminated. The instrument operation was conducted according to the standard ASTM D56 test protocol [23] using the following selected parameters: start test 5ºC; end of test 20ºC; heat rate-1 1ºC/min; heat rate-2 3ºC/min; change temperature 60ºC; test interval-1 0.5ºC; and, test interval-2 1.0ºC. The liquid mole fraction was determined from the mass measured using a Setra digital balance (EL-410D: sensitivity 0.001 g, maximum load 100 g). A magnetic stirrer provided sufficient agitation for the test samples. Two sets of mixture types, completely stirred and unstirred, were tested for comparison. The prepared mixtures of the former set were stirred for 30 minutes before the flash point test, while the ones of the latter set were not. The unstirred samples were prepared in the test cup, and put into the Flash Point Analyzer carefully for test as soon as the preparation of samples has been completed in order to reduce any disturbance in the cup. A Milli-Q plus
was used for water purification. Methanol and isobutanol were
HPLC/Spectro-grade reagents (Tedia Co. Inc.; USA); 1-butanol, 1-pentanol, octane, and 2,2,4-trimethylpentane were also sourced from Tedia. 2-Butanol was purchased from Fisher Scientific International Inc. (USA). Decane was obtained from Alfa Aesar (Lancaster, England).
The flash point prediction model proposed previously for binary partially
miscible aqueous−organic mixtures [12] and the analogue for the binary partially
miscible mixtures of flammable solvents [11] were used in this study to estimate the
flash points of such mixtures under liquid−liquid equilibrium.
3.1 Model for aqueous−−−−organic solutions
Within the mutual-solubility region of a binary partially miscible
aqueous−organic mixture, the flash point can be evaluated as [12]:
) 1 ( 1 , 2 2 2 2 sat fp sat P P x
γ
= (2) log 2 2 2 2 C T B A Psat + − =with the flammable component denoted as component 2 and water denoted as
component 1. Where Pi,satfp, in Eq. (1), is the vapor pressure of the pure substance, i,
at its flash point, and Pisat is the vapor pressure of substance, i, at the mixture’s
flash point.
In the partially miscible region of a binary partially miscible mixture, two liquid phases are in equilibrium with compositions defining a so-called tie line. Since any liquid composition located on this tie-line, in particular the overall composition of both liquid phases in equilibrium, is in equilibrium with a single vapor composition located on the so-called vapor line [24, 25], the flash point in this region should remain constant regardless of the liquid composition on the
liquid−liquid equilibrium tie line.
The compositions between liquid phases in equilibrium can be estimated by the equilibrium equality of the compound fugacities in each phase [12]:
(3) 2 , 1 ) ( ) (xiγi α = xiγi β i=
where
α
andβ
designate the two coexisting liquid phases. The activity coefficientsγi
in Eqs. (1) and (3), should be estimated using thermodynamic activity coefficientmodels adequate for partially miscible mixtures, such as the NRTL [26] or UNIQUAC equations [27]; both of these models were employed in this study. The constant flash-point in this region can be derived from the solution of Eqs. (1) – (3) [12].
3.2 Model for mixtures of flammable solvents
Within the mutual-solubility region of a binary partially miscible mixture of flammable solvents, the flash point can be calculated as [11]:
) 4 ( 1 , 2 2 2 2 , 1 1 1 1 P P x P P x sat fp sat sat fp sat
γ
γ
+ = (5) 2 , 1 log = + − = i C T B A P i i i sat iAs mentioned above in section 3.1, the flash point within the partially miscible region should remain constant regardless of the liquid composition on the
liquid−liquid equilibrium tie line. The compositions between liquid phases in
equilibrium can be estimated by Eq. (3). The temperature derived from the solution of Eqs. (3) – (5) is the flash point in the two liquid phases [11].
3.3 Binary interaction parameters used to estimate the activity coefficient
Determining the flash point of a partially miscible mixture is a problem which involves issues related to LLE and VLE: the flash point definition of “sufficient vapor to become a combustible mixture” is related to VLE (Eqs. (1), (2), (4), and
(5)), while partial miscibility concerns LLE as stressed by Eq. (3). Thus, LLE parameters are used in Eq. (3) to estimate the tie line equilibrium liquid compositions, and VLE parameters are used in Eqs. (1), (2), (4), (5) to compute the flash point. The flash point in the mutual solubility region was estimated by the VLE parameters. The span and the constant flash point of two liquid phases were estimated by the VLLE model, as suggested in a previous study [13], with Eqs. (1)
− (3) or (3) − (5). For the mixtures of flammable solvents and aqueous−organic
mixtures, the constant flash point of two liquid phases was estimated based on the estimated span approaching the lower boiling pure compound and the span approaching flammable, respectively.
4. Results and discussion
4.1 Parameters used in this manuscript
The flash-point prediction model for binary partially miscible aqueous−organic
mixtures and the analogue for binary partially miscible mixtures of flammable solvents, as described in sections 3.1 and 3.2, were used for water + 1-butanol, water + 2-butanol, water + isobutanol, water + 1-pentanol, water + octane, and methanol + decane, methanol + 2,2,4-trimethylpentane, methanol + octane, respectively. The prediction results were compared with corresponding data including two sets of measurements, with and without stirring before the test, in order to investigate the effect of stirring on the flash point behavior. The former set of data was published in our previous reports [11-13], and the latter one is listed in Tables 1 and 2. The average values of standard deviation of the measurements for
unstirred aqueous−organic solutions and unstirred mixtures of flammable solvents
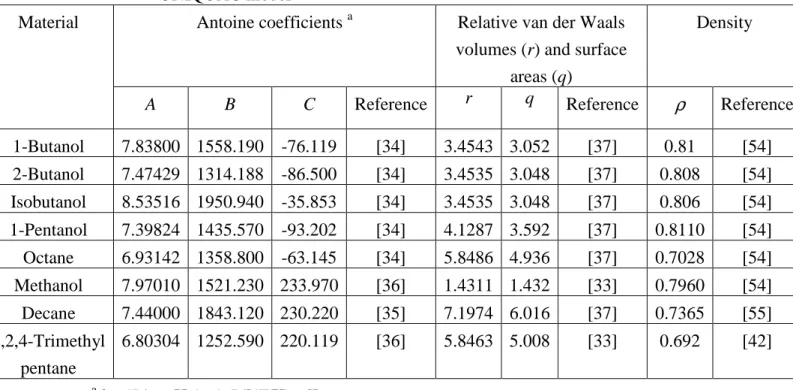
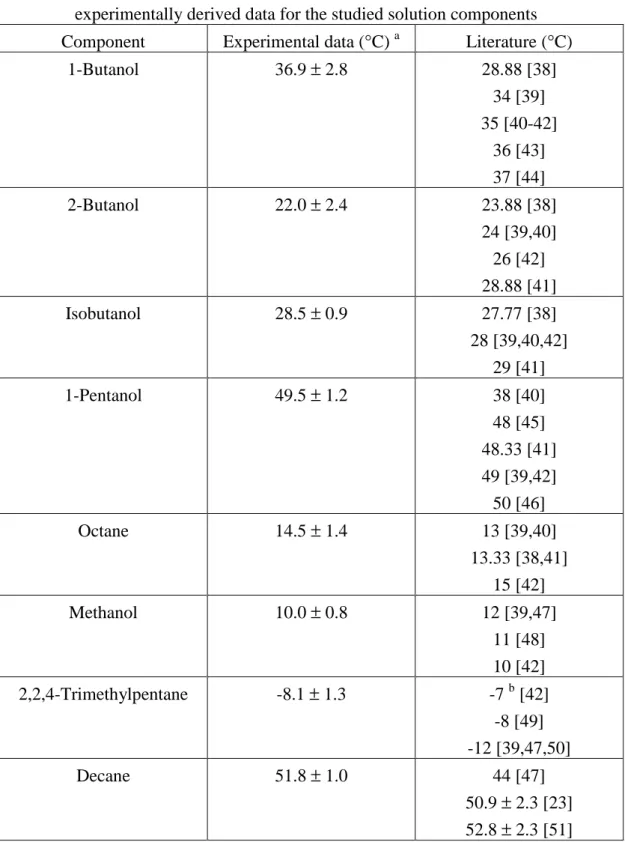
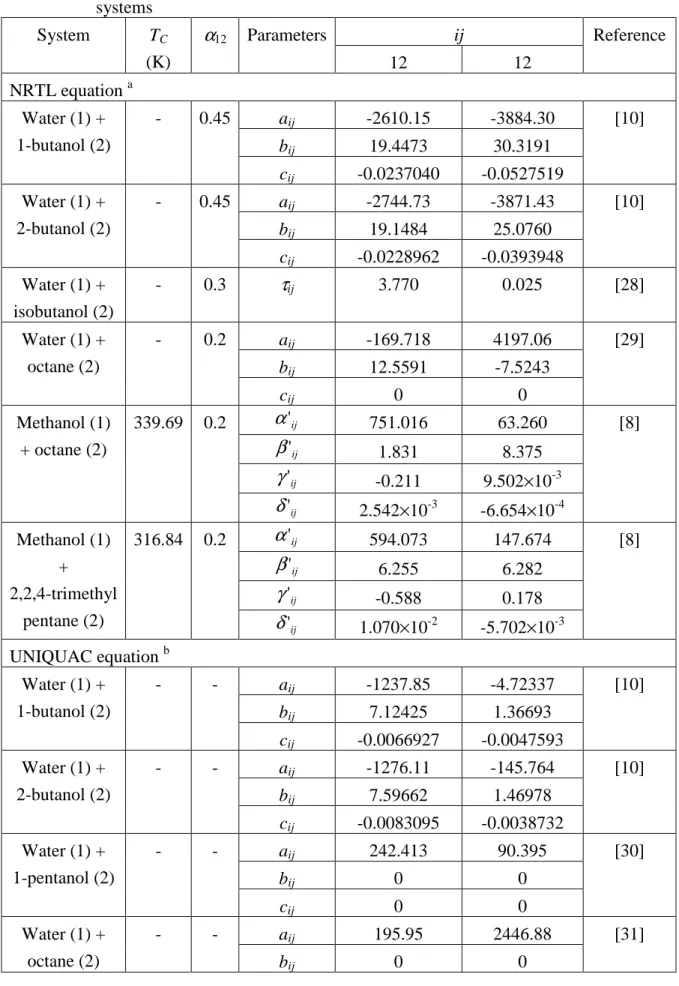
complete stirring analogues, around 0.7oC. Liquid−phase activity coefficients were estimated using the NRTL [26] and/or UNIQUAC equations [27]. Binary interaction parameters obtained either from the LLE or VLE data were used in this study, with parameters adopted from the literature [8,10,28-36] (Tables 3, 4). The parameters for relative van der Waals volume (r) and the surface area (q) for the pure components needed in the UNIQUAC equation were obtained from the literature [33,37] and are listed in Table 5 along with the Antoine coefficients sourced from the literature [34-36].
The flash points for the pure substances used in this study were measured using the Flash Point Analyzer, and these values were comparable to their literature-derived analogues [23,38-51] (Table 6). There were between-source differences in the flash-point data for 1-butanol, 2-butanol, isobutanol, 1-pentanol, octane, methanol, decane, and 2,2,4-trimethylpentane. However, these differences were acceptable except for the value of 1-butanol provided by NIOSH [38], 2-butanol by Tedia [41], 1-pentanol by Fisher [40], decane by SFPE [47] and 2,2,4-trimethylpentane by Merck [39], SFPE [47], and Baker [50]. Our experimental flash-points for these eight substances were close to the literature-derived values [23, 38-49, 51], except for the ones mentioned above which had greater differences from other sources (Table 6).
4.2 Partially miscible aqueous−−−−organic mixtures
4.2.1 Results
The flash points predicted by the model, described in section 3.1, for water + 1-butanol and the corresponding measured values are compared in Fig. 1. Whether NRTL or UNIQUAC model is used for the activity coefficient, the VLLE based
flash point model predictions were in good agreement with the experimental data obtained from the completely stirred mixtures over the entire flammable range. The measured flash-point values of the unstirred mixtures follow the trend of the completely stirred values but they are lower than the values of the completely stirred mixtures.
In the narrow mutual solubility region on the water-rich side (xwater > 0.95), the
values of the two measured sets were very close. Below xwater = 0.95, the measured
flash-point values of the unstirred mixtures are close to but greater than that of pure 1-butanol, slightly decreasing as the water fraction decreases (Fig. 1). Besides it was notices that any disturbance in the cup increased the flash point value (data not displayed in Fig. 1), that kept below that of complete stirring.
A similar behavior is observed for the other partially miscible aqueous−organic
mixtures of this study, water + 2-butanol, water + isobutanol and water + 1-pentanol, which are displayed in Figs. 2-4.
In contrast, the flash point values of the almost immiscible water + octane mixture with non-stirred were almost equivalent to those of the completely stirred mixture and were in agreement with the predicted values (Fig. 5). This finding is attributable to the near immiscibility of these compounds [52].
Finally, our observations indicate that two liquid phases exist almost over the
entire flammable composition range of the studied aqueous−organic mixtures when
they are not stirred, although they are miscible in the flammable-rich and flammable-lean regions after complete stirring.
4.2.2 Discussion
than that of water (Table 5), the upper layer of the two liquid phases for these
studied aqueous−organic mixtures is the organic phase. If the quantity of the
aqueous phase is low enough to be completely under the layer of organic phase; since the organic phase is the only phase to be in contact with the air, the flash point values of the mixtures are determined dominantly by the composition of organic phase.
The observation that the flash points of the unstirred aqueous−organic mixtures
were close to that of the pure flammable component over a wide composition range implies little water is soluble in the top organic phase, possibly as a consequence of decantation. As the mole fraction of water increased, more water molecules diffuse into the organic phase, resulting in the increase of flash-point value. When the mole fraction of water approached unity, the flammable mole fraction was low enough to be completely soluble in the water, and only one liquid phase, the aqueous phase, was observed. That explains why the flash-point values of the unstirred mixtures approached those of the completely stirred mixtures.
Now, the non-ideal mixture flash point model combines liquid and vapor phase properties. Because the liquid phases were not in equilibrium for the unstirred mixtures, the mole fraction of flammable organic compound in the organic and aqueous phases were greater than and less than those of the completely stirred mixtures, respectively. Thus, the flash point value of the organic phase was lower than that of the aqueous phase. Concerning the vapor phase, its flammable composition is primarily contributed by the lower flash point phase, the organic phase; thus, the flash point value of the unstirred mixtures was mostly determined predominantly by the composition of the organic phase.
more water becomes soluble in organic phase. Until, under complete stirring it reaches the LLE value. That explains why the flash point value gradually increases under those disturbances but remains limited by the LLE value.
For the water + octane mixture, since the two compounds are almost immiscible to each other [52], the flash point values of water + octane with complete stirring are almost constant, and are very close to the value of octane over the whole test range [12], the flash point values of such mixtures without stirring are almost equivalent to those of the completely stirred mixtures.
Overall, the measured flash point for the aqueous–organic mixtures is never lower than the pure organic compound. Thus the fire and explosion hazard of these mixtures is correctly evaluated from the pure organic compound value. However, it is suggested to completely stir such mixtures before handling, so as to reduce the hazard because that will increase the mixture flash point.
4.3 Partially miscible mixtures of flammable solvents 4.3.1 Results
Predictions using Eqs. (3) − (5) for methanol + decane are done with the binary
interaction parameters listed in Tables 3, 4 and are compared with the measured values in Fig. 6.
Predictions with the equilibrium model agree with the experimental data of completely stirred mixtures over the entire composition range. The difference in flash-point behavior between the unstirred mixtures and the completely stirred mixtures for methanol + decane was markedly different from that of the
aqueous−organic solutions as described in section 4.2. The flash-point values of the
less than that of decane, which is the highest boiling pure compound. The same behavior is observed in the other partially miscible mixtures of flammable solvents, methanol + 2,2,4-trimethylpentane and methanol + octane, which are displayed in Figs. 7 and 8.
4.3.2 Discussion
The same arguments than before explain the observations: The unstirred mixture of methanol + decane separated into two liquid phases over the test range excluding the region around pure methanol and that around pure decane. Since the density of decane is less than that of methanol (Table 5), the upper layer of this partially miscible mixture is the decane-rich phase. Thus, the flash-point value is predominantly determined by the composition of the decane-rich phase when the quantity of the methanol-rich phase is not great enough to result in exposure to the air. The mole fraction of decane, the highest boiling pure compound, in the decane-rich phase for this unstirred mixture is greater than the analogue under LLE. Thus, the measured flash-point values of the unstirred mixture lie between those under LLE and that of pure decane which is one of the highest among pure compound [4,11,53].
As the mole fraction of methanol increases, the quantities in the methanol-rich phase and decane-rich phase increased and decreased, respectively. There exists a composition range where the decane-rich phase upper layer volume is not great enough to cover all the air-exposed surface area. In such a region some methanol-rich phase and patches of decane-rich phase are in contact with the air. As the flash point of the methanol-rich phase is lower than that of decane-rich phase for this unstirred mixture, the flash point value is determined by the methanol-rich
phase in this region, ultimately reaching the methanol-rich phase value as the overall methanol fraction increases. In the decane-rich region, the steep variation of flash point is due to the effect of decane as in stirred flash point measurements.
For the methanol + 2,2,4-trimethylpentane partially miscible mixture, the lighter 2,2,4-trimethylpentane-rich phase lies above the heavier methanol-rich phase (Table 5). Thus, the unstirred mixture flash point value was determined by the 2,2,4-trimethylpentane-rich phase over the non-equilibrium two liquid phase composition range, except near the methanol-rich region. The fact that the unstirred mixture flash point values were only slightly less than that of pure 2,2,4-trimethylpentane (Fig. 7) can be attributed to the smaller than equilibrium quantity of methanol solubilized in the 2,2,4-trimethylpentane-rich phase. Beyond the non-equilibrium two liquid phases region, near pure methanol the single phase flash point value increases with the mole fraction of methanol and as expected, was close to that of completely stirred mixtures.
For the methanol + octane mixture the lighter octane-rich phase lies above the heavier methanol-rich phase, thus, the unstirred mixture flash point value is determined by the octane-rich phase composition in the non-equilibrium two liquid phase composition span. At equilibrium, this mixture exhibits a strong minimum flash point value and the flash point values decrease sharply as a small quantity of methanol (resp. octane) is put into octane (resp. methanol) (Fig. 8). The same trend hold for the unstirred mixtures, but with a two phase flash point value higher than the equilibrium one, like the former methanol + 2,2,4-trimethylpentane.
As the mole fraction of methanol increased, the unstirred mixture flash points can be considered constant over a wide composition rage (Fig. 8). It may indicate that the solubility of methanol in the octane-rich phase is not increased.
In the methanol-rich phase, the unstirred mole fraction of methanol is greater than that of the completely stirred one, explaining why the unstirred value is higher than the equilibrium one.
5. Conclusion
The models proposed previously for flash-point prediction of binary partially miscible mixtures [11, 12] are based on the assumption that the two liquid phases are in equilibrium. It cannot guarantee that such two models are able to represent the experimental data of unstirred mixtures, which do not satisfy the LLE assumption, although they can describe the measurements for completely stirred mixtures.
For the unstirred mixtures of flammable solvents, the flash point values were between those of the completely stirred mixtures and the component with the highest flash point. In the implementation of GHS, when test instruments are used on industrial sites, it then becomes recommended that the test samples must be completely stirred before test, otherwise, the fire and explosion hazard of such mixtures will be underestimated.
For the partially miscible aqueous−organic mixture, the unstirred flash point
values lie between those of the equilibrium mixture with complete stirring and that of the pure flammable. The pure flammable compound flash point is then the lowest of the mixture. Thus, it is suggested to use the flash-point value of the flammable component to assess the fire and explosion hazard for a partially miscible
aqueous−organic mixture.
A, B, C =Antoine coefficients
Aij = coefficient in Table 3 (J/mol)
aij = parameter in Table 3 (J/mol)
bij = parameter in Table 3 (J/mol·K)
cij = parameter in Table 3 (J/mol·K2)
g = binary parameters of the NRTL equation (J/mol)
sat i
P = saturated vapor pressure (kPa)
sat fp i
P, = saturated vapor pressure of component, i, at flash point (kPa)
R = gas constant (8.314 J/mol·K)
T = temperature (K)
TC= upper critical solution temperature (UCST) (K)
Ti,fp= flash point temperature of pure component, i (K)
u = binary parameters of UNIQUAC equation (J/mol)
x = liquid-phase composition
Greek letters
αij = NRTL parameter
ij '
α = parameter in Table 3 (J/mol)
ij '
β = parameter in Table 3 (J/mol·K)
γ
= activity coefficientij '
γ
= parameter in Table 3 (J/mol·K2)ij '
δ
= parameter in Table 3 (J/mol·K3)ij
τ
= NRTL parameterSubscripts
Superscripts
α
=α
phaseβ
=β
phaseAcknowledgements
The authors would like to thank the China Medical University for supporting this study financially under grant #CMU96-072.
References
[1] CCPS/AIChE, Guidelines for Engineering Design for Process Safety, American Institute of Chemical Engineers, New York, 1993.
[2] F.P. Lees, Loss Prevention in the Process Industries, Vol. 1, 2nd ed., Butterworth-Heinemann, Oxford, U.K., 1996.
[3] D.A. Crowl, J.F. Louvar, Chemical Process Safety: Fundamentals with Applications, 2nd ed., Prentice Hall PTR, New Jersey, 2002.
[4] H.-J. Liaw, Y.-H. Lee, C.-L. Tang, H.-H. Hsu, J.-H. Liu, A mathematical model for predicting the flash point of binary solutions, J. Loss Prevent. Proc. 15 (2002) 429-438.
[5] H.-J. Liaw, Y.-Y. Chiu, The prediction of the flash point for binary aqueous-organic solutions, J. Hazard. Mater. 101 (2003) 83-106.
[6] DOT, Shippers – General Requirements for Shipments and Packagings, Class3 – Assignment of Packing Group, 49CFR173.121, National Archives and Records Administration, 2004, p. 488.
[7] Regulations, Regulation (EC) No 1272/2008 of the European parliament and of the council, on classification, labeling and packaging of substances and mixtures,
amending and repealing Directives 67/548/EEC and 1999/45/EC, and amending Regulation (EC) No 1907/2006, Official Journal of the European Union, 2008, L353.
[8] K. Kurihara, T. Midorikawa, T. Hashimoto, K. Kojima, K. Ochi, Liquid-Liquid
solubilities for the binary system of methanol with octane and
2,2,4-trimethylpentane, J. Chem. Eng. Japan 35 (2002) 360-364.
[9] H. Matsuda, K. Ochi, Liquid-liquid equilibrium data for binary alcohol + n-alkane (C10-C16) systems: methanol + decane, ethanol + tetradecane, and ethanol + hexadecane, Fluid Phase Equilib. 224 (2004) 31-37.
[10] H. Kosuge, K. Iwakabe, Estimation of isobaric vapor-liquid-liquid equilibria for partially miscible mixture of ternary system, Fluid Phase Equilib. 233 (2005) 47-55.
[11] H.-J. Liaw, W.-H. Lu, V. Gerbaud, C.-C. Chen, Flash-point prediction for binary partially miscible mixtures of flammable solvents, J. Hazard. Mater. 153 (2008) 1165-1175.
[12] H.-J. Liaw, C.-T. Chen, V. Gerbaud, Flash-point prediction for binary partially miscible aqueous-organic mixtures, Chem. Eng. Sci. 63 (2008) 4543-4554. [13] H.-J. Liaw, V. Gerbaud, C.-Y. Chiu, Flash point for ternary partially miscible
mixtures of flammable solvents, J. Chem. Eng. Data (2009), doi: 10.1021/je900287r.
[14] W.A. Affens, G.W. McLaren, Flammability properties of hydrocarbon solutions in air, J. Chem. Eng. Data 17 (1972) 482-488.
[15] D. White, C.L. Beyler, C. Fulper, J. Leonard, Flame spread on aviation fuels, Fire Safety J. 28 (1997) 1-31.
flash point modeling for organic acid-water mixtures, Process Saf. Prog. 21 (2002) 254-260.
[17] H.-J. Liaw, C.-L. Tang, J.-S. Lai, A model for predicting the flash point of ternary flammable solutions of liquid, Combust. Flame 138 (2004) 308-319. [18] H.-J. Liaw, Y.-Y. Chiu, A general model for predicting the flash point of miscible
mixture, J. Hazard. Mater. 137 (2006) 38-46.
[19] H.-J. Liaw, T.-A. Wang, A non-ideal model for predicting the effect of dissolved salt on the flash point of solvent mixtures, J. Hazard. Mater. 141 (2007) 193-201.
[20] L. Catoire, S. Paulmier, V. Naudet, Estimation of closed cup flash points of combustible solvent blends, J. Phys. Chem. Ref. Data 35 (2006) 9-14.
[21] J. Gmehling, P. Rasmussen, Flash points of flammable liquid mixtures using UNIFAC, Ind. Eng. Chem. Fundam. 21 (1982) 186-188.
[22] S.-J. Lee, D.-M Ha, The lower flash points of binary systems containing non-flammable component, Korean J. Chem. Eng. 20 (2003) 799-802.
[23] ASTM D 56, Standard test method for flash point by Tag closed tester, American Society for Testing and Materials, West Conshohocken, PA, (1999).
[24] H.C. Van Ness, M.M. Abbott, Classical Thermodynamics of Nonelectrolyte Solutions: With Applications to Phase Equilibria, McGraw-Hill, New York, 1982.
[26] H.N. Pham, M.F. Doherty, Design and synthesis of heterogeneous azeotropic distillations-1. heterogeneous phase diagrams, Chem. Eng. Sci. 45 (1990) 1823-1836.
[26] H. Renon, J.M. Prausnitz, Local compositions in thermodynamic excess functions for liquid mixtures, AIChE J. 14 (1968) 135-144.
[27] D.S. Abrams, J.M. Prausnitz, Statistical thermodynamics of liquid mixtures: new expression for the excess Gibbs energy of partly or completely miscible systems, AIChE J. 21 (1975) 116-128.
[28] Y. Tang, Z. Li, Y. Li, Salting effect in partially miscible systems of n-butanol-water and butanone-water: 2. An extended Setschenow equation and its application, Fluid Phase Equilib. 105 (1995) 241-258.
[29] M. Klauck, A. Grenner, J. Schmelzer, Liquid-liquid(-liquid) equilibria in ternary systems of water + cyclohexylamine + aromatic hydrocarbon (toluene or propylbenzene) or aliphatic hydrocarbon (heptane or octane), J. Chem. Eng. Data 51 (2006) 1043-1050.
[30] J.M. Resa, J.M. Goenaga, M. Iglesias, R. Gonzalez-Olmos, D. Pozuelo, Liquid-liquid equilibrium diagrams of ethanol + water + (ethyl acetate or 1-pentanol) at several temperatures, J. Chem. Eng. Data 51 (2006) 1300-1305. [31] Y.L. Lu, D.R. Chiou, L.J. Chen, Liquid-liquid equilibria for the ternary system
water + octane + diethylene glycol monobutyl ether, J. Chem. Eng. Data 47 (2002) 310-312.
[32] A. Tourino, L.M. Casas, G. Marino, M. Iglesias, B. Orge, J. Tojo, Liquid phase behaviour and thermodynamics of acetone + methanol + n-alkane (C9-C12) mixtures, Fluid Phase Equilib. 206 (2003) 61-85.
[33] M.B. Gramajo de Doz, C.M. Bonatti, H.N. Sόlimo, Liquid-liquid equilibria of ternary and quaternary systems with two hydrocarbons, an alcohol, and water at 303.15 K Systems containing 2,2,4-trimethylpentane, toluene, methanol, and water, or 2,2,4-trimethylpentane, toluene, ethanol, and water, Fluid Phase Equilib. 205 (2003) 53-67.
1a. DECHEMA, Frankfurt, Germany, 1981.
[35] J. Gmehling, U. Onken, Vapor-Liquid Equilibrium Data Collection, Vol. 1, Part 2a. DECHEMA, Frankfurt, Germany, 1977, p.72, 275.
[36] J. Gmehling, U. Onken, W. Arlt, Vapor-Liquid Equilibrium Data Collection, Vol. 1, Part 2c. DECHEMA, Frankfurt, Germany, 1982, p.229, 250.
[37] B.E. Poling, J.M. Prausnitz, J.P. O’Connell, The Properties of Gases and Liquids, fifth ed., McGraw-Hill, New York, 2001.
[38] NIOSH Pocket Guide to Chemical Hazards, 2008.
〈http://www.cdc.gov/noish/npg/npgname-o.html〉.
[39] Merck, 2008. 〈http://www.chemdat.info/mda/int_en/index.html〉.
[40] Fisher Scientific, 2008.
〈https://www.fishersci.com/wps/portal/CMSTATIC?pagename=msds〉.
[41] Tedia, 2008. 〈http://www.tedia.com/products.php3〉.
[42] Oxford University, The Physical and Theoretical Chemistry Laboratory, 2008.
〈http://physchem.ox.ac.uk〉.
[43] Univar USA, 2008. 〈http://www.univarusa.com/assistmsds.htm〉.
[44] Mallinckrodt Baker, 2008.
〈http://www.mallbaker.com/Americas/catalog/default.asp?searchfor=msds〉.
[45] Freepatentsonline, 2008. 〈http://www.freepatentsonline.com/6663723.html〉.
[46] Bohnet, M. et al., 2007. Ullmann's Encyclopedia of Industrial Chemistry. Wiley InterScience (John Wiley & Sons), USA.
[47] SFPE, The SFPE Handbook of Fire Protection Engineering, second ed., Society of Fire Protection Engineers, Boston, 1995.
[48] Alfa Aesar, A Johnson Matthey Company, http://www.alfa.com
[50] J.T Baker, http://www.jtbaker.com/msds/englishhtml/T3913.htm
[51] ASTM D 93, Standard test methods for flash-point by Pensky-Martens closed cup tester, American Society for Testing and Materials, West Conshohocken, PA, (2000).
[52] A. Mączyński, B. Wiśniewska-Gocłowska, M. Gόra, Recommended liquid-liquid equilibrium data. part 1. binary akane-water systems, J. Phys. Chem. Ref. Data 33 (2004) 549-577.
[53] W.H. Ellis, Solvent flash points – expected and unexpected, J. Coat. Technol. 48 (1976) 44-57.
[54] Merck, The Merck Index, fourteenth ed., Merck & CO., NJ, 2006.
[55] A. Tourino, L.M. Casas, G. Marino, M. Iglesias, B. Orge, J. Tojo, Liquid phase behaviour and thermodynamics of acetone + methanol + n-alkane (C9-C12) mixtures, Fluid Phase Equilib. 206 (2003) 61-85.
FIGURE LEGENDS
Fig. 1.
Fig. 2.
Comparison of predicted flash point and experimental data for completely stirred and unstirred water (1) + 1-butanol (2).
Comparison of predicted flash point and experimental data for completely stirred and unstirred water (1) + 2-butanol (2).
Fig. 3. Comparison of predicted flash point and experimental data for completely
stirred and unstirred water (1) + isobutanol (2).
Fig. 4. Comparison of predicted flash point and experimental data for completely
stirred and unstirred water (1) + 1-pentanol (2).
Fig. 5. Comparison of predicted flash point and experimental data for completely
stirred and unstirred water (1) + octane (2).
Fig. 6. Comparison of predicted flash point and experimental data for completely
stirred and unstirred methanol (1) + decane (2).
Fig. 7. Comparison of predicted flash point and experimental data for completely
stirred and unstirred methanol (1) + octane (2).
Fig. 8. Comparison of predicted flash point and experimental data for completely
stirred and unstirred methanol (1) + 2,2,4-trimethylpentane (2).
Table 1 Measured flash point for unstirred partially miscible aqueous-organic mixtures x1 water (1) + 1-butanol (2) (oC) water (1) + 2-butanol (2) (oC) water (1) + isobutanol (2) (oC) water (1) + 1-pentanol (2) (oC) water (1) + octane (2) (oC) 0 36.9 22.0 28.5 49.5 14.5 0.01 - 21.7 - 49.6 - 0.02 - 21.9 28.5 49.7 - 0.03 - 22.1 28.5 - - 0.05 36.8 - - - 14.3 0.1 36.9 22.5 28.4 50.4 15.0 0.2 37.6 22.5 28.7 50.6 14.9 0.3 37.2 22.3 28.9 50.5 14.6 0.4 38.1 22.4 29.1 50.8 14.7 0.5 37.8 22.5 29.3 50.7 15.0 0.6 38.1 22.9 30.1 50.7 14.4 0.7 37.8 23.5 30.4 50.9 14.1 0.8 38.3 24.1 31.6 51.2 14.5 0.9 38.3 23.8 31.2 51 13.8 0.95 38.6 25.3 - 53.4 14.7 0.97 - 26.6 32.4 - - 0.98 39.8 27.3 33.7 - - 0.99 41.6 44.1 43.9 56.2 14.6 0.992 51.3 - - - - 0.993 54.4 51.6 - - - 0.994 57.6 - 52.9 - - 0.995 62.9 58.1 57.5 - - 0.996 69.3 63.6 60.5 59.5 - 0.997 - - 66.0 64.5 - 0.998 - - - 71.5 -
Table 2 Measured flash point for unstirred partially miscible mixtures of flammable solvents x1 methanol (1) + decane (2) (oC) methanol (1) + 2,2,4-trimethylpentane (2) (oC) methanol (1) + octane (2) (oC) 0 51.8 -8.1 14.5 0.005 48.0 0.01 30.4 -8.6 12.6 0.02 22.8 - 10.5 0.03 - - 8.9 0.04 19.7 - - 0.05 18.3 -8.4 7.3 0.06 15.5 - - 0.1 15.7 -9.1 4.8 0.2 15.2 -8.7 5.0 0.3 15.9 -9.0 4.2 0.4 14.5 -9.6 4.3 0.5 16.0 -9.6 4.3 0.6 13.8 -9.5 4.2 0.7 12.9 -9.2 4.3 0.8 11.7 -9.6 3.9 0.9 11.4 -9.3 4.5 0.95 10.3 -9.6 3.8 0.97 - -7.4 - 0.98 11.1 -4.7 4.0 0.985 - - 5.1 0.99 - -0.1 6.1 0.992 - 1.1 - 0.995 10.8 4.83 7.5 0.998 9.8 - - 1.0 10.0 10.0 10.0
Table 3 LLE parameters of the NRTL and UNIQUAC equations for the studied systems ij System TC (K)
α
12 Parameters 12 12 Reference NRTL equation a aij -2610.15 -3884.30 bij 19.4473 30.3191 Water (1) + 1-butanol (2) - 0.45 cij -0.0237040 -0.0527519 [10] aij -2744.73 -3871.43 bij 19.1484 25.0760 Water (1) + 2-butanol (2) - 0.45 cij -0.0228962 -0.0393948 [10] Water (1) + isobutanol (2) - 0.3τij
3.770 0.025 [28] aij -169.718 4197.06 bij 12.5591 -7.5243 Water (1) + octane (2) - 0.2 cij 0 0 [29] ij ' α 751.016 63.260 ij ' β 1.831 8.375 ij ' γ -0.211 9.502×10⁻³ Methanol (1) + octane (2) 339.69 0.2 ij ' δ 2.542×10⁻³ -6.654×10⁻⁴ [8] ij ' α 594.073 147.674 ij ' β 6.255 6.282 ij ' γ -0.588 0.178 Methanol (1) + 2,2,4-trimethyl pentane (2) 316.84 0.2 ij ' δ 1.070×10⁻² -5.702×10⁻³ [8] UNIQUAC equation b aij -1237.85 -4.72337 bij 7.12425 1.36693 Water (1) + 1-butanol (2) - - cij -0.0066927 -0.0047593 [10] aij -1276.11 -145.764 bij 7.59662 1.46978 Water (1) + 2-butanol (2) - - cij -0.0083095 -0.0038732 [10] aij 242.413 90.395 bij 0 0 Water (1) + 1-pentanol (2) - - cij 0 0 [30] aij 195.95 2446.88 Water (1) + octane (2) - - bij 0 0 [31]cij 0 0 aij 8255.57 1472.06 bij -7.37400 -4.33899 Methanol (1) + decane (2) - - cij 0 0 [32] Methanol (1) + 2,2,4-trimethyl pentane (2) - - Aij -30.557 738.15 [33] a 2 T c T b a R g g A ij ij ij jj ij ij = + + − = or 3 2 ) ( ' ) ( ' ) ( ' ' T T T T T T R g g Aij = ij − jj =
α
ij+β
ij C − +γ
ij C − +δ
ij C − b 2 T c T b a R u u A ij ij ij jj ij ij = + + − =Table 4 VLE parameters of the NRTL and UNIQUAC equations for the studied systems NRTL a UNIQUAC a Mixtures A12 A21
α
12 A12 A21 Reference Water (1) + 1-butanol (2) 1332.336 193.464 0.4056 193.397 129.827 [34] Water (1) + 2-butanol (2) 891.640 133.786 0.4406 116.950 87.753 [34] Water (1) + isobutanol (2) 1109.011 114.185 0.3155 142.459 150.949 [34] Water (1) + 1-pentanol (2) 1643.518 60.776 0.3309 252.687 77.061 [34] Methanol (1) + decane (2) - - - -58.522 933.899 [35] Methanol (1) + octane (2) Methanol (1) + 2,2,4-trimethylpentane (2) 728.279 697.771 0.4313 -30.042 793.817 [36] a NRTL: Aij= (gij-gjj)/R; UNIQUAC: Aij= (uij-ujj)/RTable 5 Antoine coefficients and density for solution components, and relative van der Waals volumes (r) and surface areas (q) for the pure components for the UNIQUAC model
Antoine coefficients a Relative van der Waals
volumes (r) and surface areas (q)
Density Material
A B C Reference r q Reference
ρ
Reference1-Butanol 7.83800 1558.190 -76.119 [34] 3.4543 3.052 [37] 0.81 [54] 2-Butanol 7.47429 1314.188 -86.500 [34] 3.4535 3.048 [37] 0.808 [54] Isobutanol 8.53516 1950.940 -35.853 [34] 3.4535 3.048 [37] 0.806 [54] 1-Pentanol 7.39824 1435.570 -93.202 [34] 4.1287 3.592 [37] 0.8110 [54] Octane 6.93142 1358.800 -63.145 [34] 5.8486 4.936 [37] 0.7028 [54] Methanol 7.97010 1521.230 233.970 [36] 1.4311 1.432 [33] 0.7960 [54] Decane 7.44000 1843.120 230.220 [35] 7.1974 6.016 [37] 0.7365 [55] 2,2,4-Trimethyl pentane 6.80304 1252.590 220.119 [36] 5.8463 5.008 [33] 0.692 [42] a log(P/mmHg)=A-B/[(T/K)+C]
Table 6 Comparison of flash-point values adopted from the literature with experimentally derived data for the studied solution components
Component Experimental data (°C) a Literature (°C)
1-Butanol 36.9 ± 2.8 28.88 [38] 34 [39] 35 [40-42] 36 [43] 37 [44] 2-Butanol 22.0 ± 2.4 23.88 [38] 24 [39,40] 26 [42] 28.88 [41] Isobutanol 28.5 ± 0.9 27.77 [38] 28 [39,40,42] 29 [41] 1-Pentanol 49.5 ± 1.2 38 [40] 48 [45] 48.33 [41] 49 [39,42] 50 [46] Octane 14.5 ± 1.4 13 [39,40] 13.33 [38,41] 15 [42] Methanol 10.0 ± 0.8 12 [39,47] 11 [48] 10 [42] 2,2,4-Trimethylpentane -8.1 ± 1.3 -7 b [42] -8 [49] -12 [39,47,50] Decane 51.8 ± 1.0 44 [47] 50.9 ± 2.3 [23] 52.8 ± 2.3 [51] a
The uncertainty is in double standard deviation
b
0
0.2
0.4
0.6
0.8
1
x
130
40
50
60
70
fl
a
s
h
p
o
in
t
(
oC
)
NRTL UNIQUACcomplete stirring mixture non-stirring mixture
Fig.1. Comparison of predicted flash point and experimental data for completely stirred and unstirred water (1)+ 1-butanol (2).
0
0.2
0.4
0.6
0.8
1
x
120
30
40
50
60
70
fl
a
s
h
p
o
in
t
(
oC
)
NRTL UNIQUACexperimental data (complete mixing) experimental data (non-mixing)
Fig.2. Comparison of predicted flash point and experimental data for completely stirred and unstirred water (1) + 2-butanol (2).
0
0.2
0.4
0.6
0.8
1
x
120
30
40
50
60
70
fl
a
s
h
p
o
in
t
(
oC
)
NRTLcomplete stirring mixture non-stirring mixture
Fig.3. Comparison of predicted flash point and experimental data for completely stirred and unstirred water (1) + isobutanol (2).
0
0.2
0.4
0.6
0.8
1
x
140
50
60
70
80
fl
a
s
h
p
o
in
t
(
oC
)
UNIQUACcomplete stirring mixture non-stirring mixture
Fig.4. Comparison of predicted flash point and experimental data for completely stirred and unstirred water (1) + 1-pentanol (2).
0
0.2
0.4
0.6
0.8
1
x
110
20
30
40
50
60
fl
a
s
h
p
o
in
t
(
oC
)
UNIQUAC NRTLexperimental data (complete stirring) experimental data (non-stirring)
Fig.5. Comparison of predicted flash point and experimental data for completely stirred and unstirred water (1) + octane (2).
0
0.2
0.4
0.6
0.8
1
x
10
10
20
30
40
50
60
fl
a
s
h
p
o
in
t
(
oC
)
UNIQUACexperimrntal data (complete stirring) experimental data (non-stirring)
Fig.6. Comparison of predicted flash point and experimental data for completely stirred and unstirred methanol (1) + decane (2).
0
0.2
0.4
0.6
0.8
1
x
1-15
-10
-5
0
5
10
fl
a
s
h
p
o
in
t
(
oC
)
NRTL UNIQUACcomplete stirring mixture non-stirring mixture
Fig.7. Comparison of predicted flash point and experimental data for completely stirred and unstirred methanol (1) + 2,2,4-trimethylpentane (2).
0
0.2
0.4
0.6
0.8
1
x
10
4
8
12
16
fl
a
s
h
p
o
in
t
(
oC
)
NRTLcomplete stirring mixture non-stirring mixture
Fig.8. Comparison of predicted flash point and experimental data for completely stirred and unstirred methanol (1) + octane (2).


![Table 4 VLE parameters of the NRTL and UNIQUAC equations for the studied systems NRTL a UNIQUAC aMixtures A 12 A 21 α 12 A 12 A 21 Reference Water (1) + 1-butanol (2) 1332.336 193.464 0.4056 193.397 129.827 [34] Water (1) + 2-butanol (2) 891.](https://thumb-eu.123doks.com/thumbv2/123doknet/3694251.109684/31.892.97.785.165.624/parameters-uniquac-equations-studied-uniquac-amixtures-reference-butanol.webp)