Analysis and Uncertainty of Airport Pushback Rate
Control Policies
by
Patrick Kough McFarlane
B.S., University of Notre Dame (2014)
Submitted to the Department of Aeronautics and Astronautics
in partial fulfillment of the requirements for the degree of
Master of Science in Aeronautics and Astronautics
at the
MASSACHUSETTS INSTITUTE OF TECHNOLOGY
February 2016
Massachusetts Institute of Technology 2016. All rights reserved.
A uthor ...
Signature redacted
Department of Aeronautics and Astronautics
December 17, 2015
Certified by...
...
Accepted by...
ARCMVM
MAR 18
ZO16
Signature redacted
Hamsa Balakrishnan
Associate Professor of Aeronautics and Astronautics
Thesis Supervisor
Signature redacted
...,I.
...
. . . .
Paulo C. Lozano
Associate Professor of Aeronautics and Astronautics
Chair, Graduate Program Committee
Analysis and Uncertainty of Airport Pushback Rate Control
Policies
by
Patrick Kough McFarlane
Submitted to the Department of Aeronautics and Astronautics on December 17, 2015, in partial fulfillment of the
requirements for the degree of
Master of Science in Aeronautics and Astronautics
Abstract
This thesis analyzes the effects of two algorithms that control the departure of aircraft at congested airports, with an emphasis on the uncertainty of the underlying pro-cesses. These algorithms, N-control and dynamic programming, belong to a broader class of control policies called Pushback Rate Control (PRC) policies that calculate a pushback rate for departing aircraft based on the state of the airport surface conges-tion. During times of congestion, these algorithms limit the amount of aircraft on the airport surface while maintaining departure throughput. This reduces the taxi-out time of aircraft, resulting in reduced fuel burn and emissions. This thesis introduces the policies and simulates their performance at LaGuardia Airport while varying two policy parameters, the length of the prediction interval and the number of predic-tion intervals, under several types of uncertainty, including the departure schedule and arrival rate. As will be shown, each policy results in significant taxi-out time reductions, saving airlines at least 60,000 minutes of taxiing over a 2-month period with the traditional 15-minute time window simulations. However, when accounting for the uncertainty in the algorithm inputs or the variation of policy parameters, the performance of both PRC policies degrades. By accounting for the variation of policy parameters and the different sources of uncertainty that affect airport surface management, the main contribution of this thesis provides a realistic analysis of PRC policies.
Thesis Supervisor: Hamsa Balakrishnan
Acknowledgments
This research was funded by the Federal Aviation Administration.
I would like to express my sincerest gratitude to my academic and thesis advisor, Professor Harnsa Balakrishnan. Since my first day at MIT, Professor Balakrishnan has made me feel truly welcome. In addition, her passion for the research we have been doing has transformed me into a better student and researcher. I have greatly enjoyed researching airport surface management, and Professor Balakrishnan has taught me a great deal about statistical modeling, stochastic processes, and the aviation industry. I am very thankful for all that she has done for me.
Next, I would like to thank my family. It is difficult to articulate the positive influence of my family on my life. Rather than citing specific examples, I believe all of the love and efforts of my family constantly surround me and support me in all of my pursuits, especially this degree. Research is a nonlinear function of progress, frustration, time, and reward. My mother and father, Deborah and Scott McFarlane, have been my foundation throughout my entire life, while my brothers, Ryan and Sean McFarlane, have been my guideposts. For their unwavering support, I am eternally grateful.
Lastly, I would be remiss if I did not mention my colleagues in ICAT. Thank you for all of your help and guidance with classes and research. I feel lucky to have learned so much from you.
Contents
1 Introduction 19
1.1 Motivation . . . . 20
1.2 Literature Review . . . . 22
1.2.1 PRC Policies . . . . 22
1.2.2 Variation of Policy Parameters . . . . 24
1.2.3 Uncertainty . . . . 24
1.2.4 Contributions of this thesis . . . . 25
1.3 Thesis Organization . . . . 26
2 Pushback Rate Control Policies 27 2.1 N-Control . . . . 28
2.2 Dynamic Programming . . . . 37
2.3 Summary . . . . 43
3 Variation of Policy Parameters 45 3.1 Input Data . . . . 46
3.2 Time Window . . . . 47
3.2.1 Assessment of the Time Window Length . . . . 47
3.2.2 N-Control . . . . 48
3.2.3 Dynamic Programming . . . .. . . . . 51
3.3 Time Horizon . . . . 54
3.3.1 Assessment of the Time Horizon Length . . . . 54
3.3.3 Dynamic Programming . . . . 58 3.4 Gate Conflicts . . . . 60 3.5 Conclusions . . . . 63 4 Operational Uncertainty 65 4.1 Departure Schedule . . . . 66 4.1.1 N-control Results . . . . 68
4.1.2 Dynamic Programming Results . . . . 69
4.2 Arrival Rate . . . . 72
4.2.1 15-minute Predictions . . . . 73
4.2.2 N-control Results . . . . 74
4.2.3 Dynamic Programming Results . . . . 76
4.3 Overall Uncertainty . . . . 78
4.3.1 N-control Results . . . . 78
4.3.2 Dynamic Programming Results . . . . 80
4.4 Variation of Parameters with Uncertainty . . . . 81
4.4.1 Arrival Rate Predictions . . . . 81
A1.4C) NT\T D 14-- no 4t.4 .2IL NI--VJ" Ittr lResults . . . . 083
4.4.3 Dynamic Programming Results . . . . 85
4.5 Conclusions . . . . 87 5 Conclusion 89 5.1 Summary of results . . . . 90 5.1.1 Variation of Parameters . . . . 90 5.1.2 Operational Uncertainty . . . . 91 5.1.3 Overall Uncertainty . . . . 92
5.2 Contributions of this thesis . . . . 93
5.2.1 Future work . . . . 94
A LGA Saturation Curves and Regression Trees 97 A.0.2 3114; IMC . . . . 97
A.0.3 22131; VMC ... ... 98 A.0.4 22131; IM C . ... 99 A.0.5 31131; VM C ... 100 A.0.6 31131; IMC ... 101 A.0.7 4131; VM C ... . 102 A.0.8 4131; IMC ... ... 103 A.0.9 22113; VM C ... 104 A.0.10 22113; IMC ... 105 A .0.11 4113; VM C ... .. .. .. .. .. ... .. ... 106 A.0.12 4113; IMC ... ... 107 A.0.13 414; VMC ... 108 A.0.14 414; IMC ... ... 109
List of Figures
2-1 Departure throughput versus departure aircraft taxiing at LaGuardia
Airport for segment (3114; VMC) with a 15-minute window. . . . . . 28
2-2 Regression tree with predicted departure throughput at the leaves for
LaGuardia Airport for segment (3114; VMC) with a 15-minute win-dow. "Arr" indicates the arrival rate for the time window and "RAPT"
indicates the single RAPT value for the time window. . . . . 31
2-3 Scatter plot with taxi-out time as a function of the adjusted traffic for
flights from terminals C and D at LGA. Data from April 2014. . . . . 34
2-4 Best fit of the empirical data with taxi-out time as a function of the
adjusted traffic for flights from terminals C and D at LGA with runway
configuration 22113. Data from April 2014. . . . . 36
2-5 Parametric solution of pushback rate with observed values of aircraft
taxiing and departure queue length for a 15-minute time window. Each line is the optimal pushback rate for the given state, increasing from 0
to 15 from right to left. . . . . 41
2-6 Flow chart for airport surface management with PRC policies. . . . . 43
3-1 Visualization of time windows and time horizons. . . . . 45
3-2 Average gate conflict frequency per hour for each airline, with and
without metering. . . . . 62
3-3 Average gate conflict frequency per day for each airline, with and
4-1 Probability distribution of the departure time perturbations relative to
the scheduled departure times. . . . . 67
4-2 Frequency of total taxi-out reduction benefits for the N-control 50
Monte Carlo method simulations. . . . . 68
4-3 Percent taxi-out reduction by airline for the N-control 50 Monte Carlo
method simulations. . . . . 69
4-4 Frequency of total taxi-out reduction benefits for the dynamic
pro-gramming 50 Monte Carlo method simulations. . . . . 70
4-5 Percent taxi-out reduction by airline for the dynamic programming 50
Monte Carlo method simulations. . . . . 71
4-6 Airport Arrival Demand Chart for LGA on 3/12/2015. The bars in-dicate how many aircraft will be approaching LGA for landing during
each 15-minute time window. . . . . .. . . . . 72
4-7 Predicted minus actual arrivals at LGA for the next 15-minute window. 73 4-8 Frequency of total taxi-out reduction benefits for the N-control 50
Monte Carlo method simulations with arrival rate uncertainty. ... 75
4-9 Percent taxi-out reduction by airline for the N-control 50 Monte Carlo
method simulations with arrival rate uncertainty. . . . . 75
4-10 Frequency of total taxi-out reduction benefits for the dynamic
program-ming 50 Monte Carlo method simulations with arrival rate uncertainty. 77
4-11 Percent taxi-out reduction by airline for the dynamic programming 50
Monte Carlo method simulations with arrival rate uncertainty. ... 77
4-12 Frequency of total taxi-out reduction benefits for the N-control 50
Monte Carlo method simulations with overall uncertainty . . . . 79
4-13 Percent taxi-out reduction by airline for the N-control 50 Monte Carlo
method simulations with overall uncertainty. . . . . 79
4-14 Frequency of total taxi-out reduction benefits for the dynamic pro-gramming 50 Monte Carlo method simulations with overall uncertainty. 80 4-15 Percent taxi-out reduction by airline for the dynamic programming 50
Monte Carlo method simulations with overall uncertainty . . . . 81
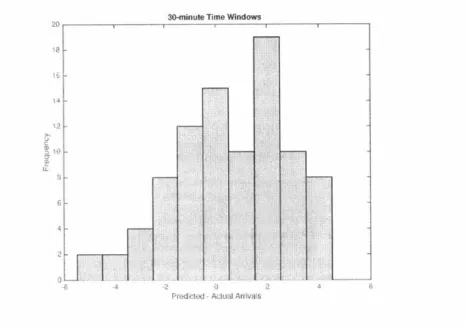
4-16 Predicted minus actual arrivals at LGA for the next 30-minute window. 82 4-17 Predicted minus actual arrivals at LGA for the next 60-minute window. 83 4-18 Total taxi-out reduction for the July-August 2013 LGA N-control time
window simulations. . . . . 84
4-19 Total taxi-out reduction for the July-August 2013 LGA N-control time
horizon simulations . . . . 84
4-20 Total taxi-out reduction for the July-August 2013 LGA dynamic
pro-gramming time window simulations. . . . . 85
4-21 Total taxi-out reduction for the July-August 2013 LGA dynamic
pro-gramming time horizon simulations. . . . . 86
A-1 Departure throughput versus departure aircraft taxiing at LaGuardia
Airport for the 3114; IMC segment. . . . . 97
A-2 Regression tree with predicted departure throughput at the leaves for LaGuardia Airport for the (3114; IMC) segment with a 15-minute
win-dow . . . . 98 A-3 Departure throughput versus departure aircraft taxiing at LaGuardia
Airport for the 22131; VMC segment. . . . . 98
A-4 Regression tree with predicted departure throughput at the leaves for LaGuardia Airport for the (22131; VMC) segment with a 15-minute
w indow . . . . . 99
A-5 Departure throughput versus departure aircraft taxiing at LaGuardia
Airport for the 22131; IMC segment . . . . . 99
A-6 Regression tree with predicted departure throughput at the leaves for LaGuardia Airport for the (22131; IMC) segment with a 15-minute
w indow . . . . 100
A-7 Departure throughput versus departure aircraft taxiing at LaGuardia
A-8 Regression tree with predicted departure throughput at the leaves for LaGuardia Airport for the (31131; VMC) segment with a 15-minute
w indow . . . . 101
A-9 Departure throughput versus departure aircraft taxiing at LaGuardia
Airport for the 31131; IMC segment . . . . 101
A-10 Regression tree with predicted departure throughput at the leaves for LaGuardia Airport for the (31131; IMC) segment with a 15-minute
w indow . . . . 102
A-11 Departure throughput versus departure aircraft taxiing at LaGuardia
Airport for the 4131; VMC segment. . . . . 102
A-12 Regression tree with predicted departure throughput at the leaves for LaGuardia Airport for the (4131; VMC) segment with a 15-minute
w indow . . . . . 103
A-13 Departure throughput versus departure aircraft taxiing at LaGuardia
Airport for the 4131; IMC segment. . . . . 103
A-14 Regression tree with predicted departure throughput at the leaves for LaGuardia Airport for the (4131; IMC) segment with a 15-minute
win-dow . . . . 104
A-15 Departure throughput versus departure aircraft taxiing at LaGuardia
Airport for the 22113; VMC segment. . . . . 104
A-16 Regression tree with predicted departure throughput at the leaves for LaGuardia Airport for the (22113; VMC) segment with a 15-minute
w indow . . . . 105
A-17 Departure throughput versus departure aircraft taxiing at LaGuardia
Airport for the 22113; IMC segment. . . . . 105
A-18 Regression tree with predicted departure throughput at the leaves for LaGuardia Airport for the (22113; IMC) segment with a 15-minute
w indow . . . . 106
A-19 Departure throughput versus departure aircraft taxiing at LaGuardia
Airport for the 4113; VMC segment. . . . . 106
A-20 Regression tree with predicted departure throughput at the leaves for LaGuardia Airport for the (4113; VMC) segment with a 15-minute
w indow . . . . . 107
A-21 Departure throughput versus departure aircraft taxiing at LaGuardia
Airport for the 4113; IMC segment. . . . . 107
A-22 Regression tree with predicted departure throughput at the leaves for LaGuardia Airport for the (4113; IMC) segment with a 15-minute
win-dow . . . . 108
A-23 Departure throughput versus departure aircraft taxiing at LaGuardia
Airport for the 414; VMC segment. . . . . 108
A-24 Regression tree with predicted departure throughput at the leaves for
LaGuardia Airport for the (414; VMC) segment with a 15-minute window. 109
A-25 Departure throughput versus departure aircraft taxiing at LaGuardia
Airport for the 414; IMC segment. . . . . 109
A-26 Regression tree with predicted departure throughput at the leaves for
List of Tables
3.1 Simulation for each time window policy, separated by airline. . . . . . 50
3.2 Dynamic programming time window simulation results, separated by
airline. . . . . 51
3.3 PRC policy variable time window performance comparison (N:
N-control, DP: dynamic programming). . . . . 52
3.4 Simulation for each time horizon policy, separated by airline. . . . . . 58
3.5 Dynamic programming time horizon simulation results, separated by
airline. . . . . 59
3.6 PRC policy variable time horizon performance comparison (N: N-control,
DP: dynamic programming). . . . . 60
5.1 Overall Uncertainty Analysis for the N-control Policy. . . . . 93
Chapter 1
Introduction
In 2014, airlines in the United States operated 7.7 million departures [121 from the 77 Aviation System Performance Metrics (ASPM) airports and consumed 10.3 billion gallons of fuel [13J. With such a high level of traffic, congestion can occur, resulting in delays. Specifically, in the taxi-out phase of flight, the average delay across the entire United States is greater than 5 minutes, with LaGuardia Airport in New York leading the nation with an average taxi-out delay of more than 12 minutes [5]. During congestion, these taxi-out delays result from aircraft waiting in the departure queue. Because the engines are running in the departure queue, these delays have additional costs in terms of fuel burn and emissions. A widely noted 2008 study by the Joint Economic committee found that delays in 2007 resulted in 7.07 million metric tons of
CO2 emissions from 740 million gallons of fuel consumed, costing an estimated $1.6
billion [6]. These high costs to both the economy and the environment stem from all sources of delays, some of which, such as weather and unforeseen maintenance issues, are unavoidable. However, delays resulting from the length of the departure queue can be reduced or redistributed through the control of departing aircraft. While the control of the departure process can limit congestion, careful consideration must be given to the uncertainty surrounding both airport operations and the control algo-rithms. The benefits of limiting airport surface congestion must be weighed against the costs of changing airport operations. Also, the accuracy of control algorithms de-pends on the accuracy of the data required. The goal of this thesis is the development
and application of control algorithms that mitigate congestion, while maintaining a focus on the uncertainty of the overall process.
1.1
Motivation
Congestion occurs when the number of aircraft on the airport surface exceeds an amount necessary to maintain the departure throughput. The additional aircraft provide no benefit in terms of departure capacity, so their presence on the surface simply adds to the cost of congestion. Airport surface management represents one approach to address the problem of congestion.
Airport surface management controls the aircraft operating at an airport so as to reduce congestion while maintaining departure and arrival throughput. Several control algorithms have been developed to mitigate congestion by controlling the rate at which departing aircraft push back from their gates. These algorithms are called Pushback Rate Control (PRC) policies. Two of these policies, N-control and dynamic programming, will be thoroughly examined in this thesis. PRC policies work within the existing airline schedules by holding certain flights during times of congestion.
While PRC policies seem to be straightforward, many constraints and limitations surround the implementation of any airport surface management policy. One subset of these constraints includes the effects of PRC policies on airport operations. Currently, once aircraft receive authorization from the control tower, departures push back from their gates, regardless of the state of the airport surface. Aircraft are usually ready to push back relatively close to their scheduled departure time, which allows for push-back and maintenance crews to be adequately assigned to flights. Holding an aircraft through PRC policies has the potential to interfere with the crew schedules, which could cause further delays. Airlines must be capable of the dynamic scheduling of aircraft crews that accounts for the possibility of held aircraft due to congestion. Also, holding aircraft at their gates increases the chance of gate conflicts. Gate conflicts occur when an arrival lands at an airport and a departure is still at the gate to which the arrival is scheduled. Because gates are occupied by departures for a longer period
of time, gate conflicts are more likely to occur during PRC policy implementation. Because gate conflicts add to airport surface congestion and increased traffic, these are highly undesirable. The last airport operations constraint is the increase of the workload of air traffic controllers. Because controllers must implement the policy, the controllers must learn new procedures in addition to their current duties. The effects of PRC policies on airlines, gate conflicts, and controllers must be considered.
In addition to the operational constraints, the PRC policies require real-time and forecasted data from arrivals and departures. The surface traffic level, future de-partures, future arrivals, airport capacity, and weather all represent variables required by the PRC algorithms to accurately calculate a departure pushback rate. While the surface traffic level can be observed, future operations, capacity, and weather must be predicted. These predictions represent another source of uncertainty. If the algo-rithm inputs cannot be predicted with an acceptable degree of accuracy, the departure pushback rate of the PRC policies is not accurate. This could result in poor surface management because a high pushback rate during congestion could lead to increased congestion and more delays, while a low pushback rate during with low congestion could lead to a decrease in departure throughput. Both of these results are undesir-able, as one is not effective at mitigating congestion, while the other one "starves" the runway by not maintaining runway utilization.
The last source of uncertainty is the use of PRC policies. PRC policies calcu-late departure pushback rates that are valid for a certain time window. Historically, the choice of this time window has been 15 minutes. A 15-minute time window for the pushback rate usually allows aircraft pushing back in one 15-minute window to reach the runway by the next 15-minute window. However, there may be reasons to adjust the length of the time window. A shorter time window leads to more accurate departure pushback rates because the rates are updated more frequently and fore-casted data are not projected far into the future. However, a shorter time window increases the workload for controllers due to the need to frequently update the depar-ture pushback rate. A longer time window decreases this workload, but at the cost of less accurate departure pushback rates due to the inaccuracy of predictions further
into the future. This tradeoff is an important consideration for controllers, airlines, and airports when implementing PRC policies. In addition to the time window, the time horizon is also of importance for PRC policies. The time horizon is defined as the number of time windows that a PRC policy "looks ahead" and calculates a push-back rate for a time window in the future. Most PRC policies use a time horizon of 0, meaning that the PRC policy updates the pushback rate at the end of each time window. The same tradeoff between accuracy and workload exists for time horizons as well.
Reducing congestion is a strong motivating factor for this research, but the un-certainty involved in achieving that goal is arguably just as important. PRC policies are an effective way to reduce congestion while not decreasing operations or altering airport capacity. However, implementation of PRC policies introduces potential is-sues in terms of airport operations and policy accuracy. A thorough examination of both PRC policies and the associated uncertainties illustrates a complete picture of the costs and benefits of airport surface management.
12 Literature Review
1.2.1
PRC Policies
The two surface management strategies examined in this thesis are the N-control and dynamic programming PRC policies. These policies lead to reductions in fuel burn and emissions, minimizing the impact of surface operations, as analyzed by many studies [211 [221 [161 [101. Simaiakis et al. develop an N-control simulation for Boston Logan International Airport and reports important metrics to describe the effects of airport surface management [21]. They then go on to calculate those metrics for several major airports and analyze emissions and fuel burn [221. Ravizza et al. demonstrate the relationship between airport surface movement and fuel burn [161. Khadilkar examines the control of both departures and arrivals on an individual aircraft basis [101.
Simaiakis [18] [19] lays the foundation for controlling departure processes. He develops an estimation of airport capacity, unimpeded taxi-out times, and a dynamic programming algorithm for Boston Logan International Airport. Many of these tech-niques will be used in this thesis to develop models for LaGuardia Airport and extend the study of airport surface management to include the variation of policy parameters and operational uncertainty. Simaiakis also notes that PRC policies are flow-based approaches to airport surface management, which means that these policies use vir-tual queues by holding aircraft at their gates. The use of virvir-tual queues were initially suggested [9] and proposed in separate studies [1]. Feron et al. [9] give a detailed overview of the conceptual departure control process, culminating in the idea of us-ing virtual queues to mitigate congestion. Burgain et al. [1] use virtual queues to minimize a cost function related to passenger wait time.
As for the N-control policy, several studies have developed the theoretical
framework [14]
13]
[181119]
and the implementation procedures are demonstrated in acase study at Boston Logan International Airport [17]. Pujet et al. [14] introduce an N-control algorithm while also suggesting the possibility of using dynamic program-ming to help address some of the uncertainties associated with the N-control policy. Carr et al. [3] develop a software tool to simulate the departure process at airports to support the research of airport surface management. Burgain et al. [2] derive a full-state feedback algorithm to control departures, where the algorithm uses a cost structure based on the number of aircraft taxiing and the non-utilization of the run-way. This thesis expounds upon the work of a potential implementation proposed for LaGuardia Airport [11] [20], in which the authors performed an N-control simulation for the airport focusing on the length of gateholding times allowed by the algorithm. For dynamic programming, a recent paper introduced this method of departure metering [23]. This method accounts for the underlying uncertainty of the airport capacity by modeling the state of the airport surface as a semi-Markov process. The optimal pushback rate is calculated based on a cost of queuing function and the prob-ability of the airport surface being in a given state. However, the policy still relies on obtaining an arrival rate and weather prediction to build the model, which
intro-duces uncertainty. The remaining relevant work with dynamic programming applied to airport operations only focuses on the optimization of aircraft scheduling.
Rathi-nam et al.
1151
propose a dynamic programming approach for the departure schedulethat finds the optimal pushback schedule for a given amount of departing aircraft.
Chandran and Balakrishnan
14]
also use a dynamic programming algorithm for thedeparture schedule, but they account for the uncertainty and random deviations in-herent in the departure process. Dell'Ohno and Lulli [7] consider both arrivals and departures with dynamic programming and the tradeoff and interactions between the two different types of flights at an airport.
1.2.2
Variation of Policy Parameters
The structure of the PRC policies includes the time window and time horizon. The length of the time window for which a pushback rate is valid can be changed. Re-searchers to this point generally set this time window to be 15 minutes, reasoning that the time window should roughly equal the lead time of the system [171 [23]. The lead time of the departure process is the time it takes for the runway to experience a given pushback rate. A runway experiences a pushback rate when the aircraft sub-jected to that rate begin to arrive at the runway. Rathinam et al. [151 only calculate a departure schedule for a given number of aircraft, while Dell'Olmo and Lulli [7J appear to settle on a time window of 15 minutes for their analysis. Burgain et al. [2] use a sampling time of 1 minute for their full-state feedback algorithm. In terms of time horizons, most studies do not look ahead, meaning that the PRC policy updates the pushback rate at the end of each time window. Longer time horizons would mean that a PRC policy calculates a pushback rate for a time window further into the future.
1.2.3
Uncertainty
While the literature review introduces the state of research concerning airport surface management, the issue of uncertainty remains a crucial problem. The departure
planner provides a introductory discussion of uncertainty and its role in controlling
the departure process
191.
The sources of uncertainty cited include weather, airlineoperations, air traffic operations, and human factors. These sources of uncertainty all have an effect on the data required by PRC policies to calculate departure pushback rates. Simaiakis and Balakrishnan demonstrate the uncertainty in the taxi-out time
of aircraft, indicating the taxi-out time is a stochastic process [211. Others have
used this approach as well
12] 114]
[3]. Chandran and Balakrishnan [4] address theuncertainty that results from perturbations in the departure and arrival schedules.
1.2.4
Contributions of this thesis
This thesis summarizes the research efforts to understand the effects of policy param-eter variation and uncertainty on PRC policies. The main contributions of this thesis are:
1. The analysis of policy parameter variation for the length of time windows and horizons of PRC policies. 15-minute, 30-minute, and 60-minute time windows are examined to weigh the costs and benefits associated with different time window lengths. For time horizons, the analysis explores the use of looking ahead into the future to calculate future departure pushback rates. These "look aheads" will be for 15-minute time windows. For example, the 0 look-ahead is equivalent to the 15-minute time window analysis and 1 look-ahead calculates a departure pushback rate for the 15-minute time window following the current 15-minute time window.
2. The analysis of operational uncertainty stemming from the stochastic departure and arrival rates in a given time period. Scheduled departure times for aircraft are rarely met, as aircraft are often ready before or after that time. Arrivals often arrive before or after their scheduled times as well. PRC policies require accurate arrival rates for a time window to ensure an accurate departure push-back rate. Also, PRC policies rely on sustained demand, which is not always the case at airports.
3. The development of two PRC policies for LaGuardia Airport with particular attention paid to gate conflicts. The simulations of these policies include the potential uncertainties discussed above, providing a more realistic evaluation of PRC policies. This thesis also discusses other possible constraints that may accompany the implementation of airport surface management.
1.3
Thesis Organization
This introduction describes airport surface management and the uncertainties asso-ciated with both PRC policies and airport operations. Chapter 2 gives a thorough description of the two PRC policies of interest, N-control and dynamic programming. The algorithm development serves as the foundation for the rest of the thesis. Chapter 3 begins to look at the policy parameter variation of time windows and time hori-zons. For both PRC policies, the results include a sensitivity analysis for each policy parameter. Chapter 4 considers the operational uncertainties surrounding departure and arrival rates. Finally, Chapter 5 concludes the thesis and suggests future research areas.
Chapter 2
Pushback Rate Control Policies
Pushback Rate Control (PRC) policies belong to a broader class of techniques related to airport surface management. The goal of airport surface management is to control the number of active aircraft on the airport surface so as to reduce congestion. PRC policies accomplish this by mitigating the rate at which departing aircraft push back from their gates during times of congestion. This is in direct contrast to current operations at U.S. airports, which use a first-come, first-served (FCFS) approach for departing aircraft. When a departure is ready for pushback, the controllers allow pushback regardless of the state of the airport surface. Therefore, PRC policies shift the delays incurred by congestion from the airport surface to the departure gate. Instead of waiting in the runway queue with engines on, an aircraft absorbs the delay at the gate in a virtual queue with engines off. This reduces the fuel burn and emissions caused by congestion. However, this also increases the likelihood of a gate conflict in which an arrival lands while a departure is still parked at the arrival's gate. A later section explains the positives and negatives of PRC policies more closely, with particular attention paid to the actual implementation of these policies at airports. This section describes and explains two PRC policies of interest, N-control and dynamic programming.
2.1
N-Control
N-control is a PRC policy that ises the relationship between the iiiiiiiber of departure
aircraft on the airport surface N and the ruiiway throughput ii a particular time wiiidow. This relatiouship is best described through a saturation ciirve. which is shown in Figure 2-1 for runway configuration 3114 at LGA under visial imeteorological conditions (VMC). or segment (31 4; VMC), for a 15-minute window.
14- Optimized Mean Optimized Median Error Bar 12-E 101 8 --6 . . 4 2I 0 'I ' ' 0 5 10 15 20 25 30 35 40 surface traffic
Figure 2-1: Departure throughput versuiis dei)arture aircraft taxiing at LaGunardia
Airport For segnict (31I4; VMC ) with a li-miuIte window.
Figure 2-1 contains a pairs of the departure throughput T(t) and surface traffic N(t) for each 15-niinute period at LaGuardia Airport for 2013 for the given segment.
The saturation curve is a least-squares regression
fit
to the data. As described bySimaiakis
191,
the a pairs of N(t) and T( t) take the form of (X I y1).,, y9) Thefmean(N) is found using simple convex optimization:
minZ(yi - yi)2, (2.1)
i=1
subject to the following constraints:
y = fmean(Ui), = 1, ... , n (2.2)
fmean(i + 1) > fmean(i), i = 0, ..., (n - 1) (2.3)
fmean(i + 1) - fmean() < fmean(i) - fmean(i - 1), i = 0,..., (n - 1) (2.4)
While this solution is for the mean regression, the median regression can also be found:
n
mil l -
yij,
(2.5)i= 1 subject to the following constraints:
yi
= fmed (i), i=,..,n (2.6)fmed(i + 1) > fmed(i), i = 0, ... ,(n - 1) (2.7)
fmed(i + 1) - fmed(') K fmed () - frned ( - 1), i = 0, ... , (n 1) (2.8)
Figure 2-1 has several interesting features. Note the nearly linear relationship between departure traffic and runway throughput for low levels of departure traffic. This indicates that, during times of low departure traffic, runway throughput benefits from an increase in departure traffic. However, the linear relationship does not extend for higher levels of departure traffic, and runway throughput hits a maximum. In words, more departure traffic leads to less of an increase in runway throughput until a certain point, after which runway throughput does not increase. This point, N*, is called the saturation point, and it is unique to each segment at an airport. For the N-control policy, an acceptable level of surface traffic Nctr is chosen around N*.
The goal of the N-control policy is to maintain surface traffic at or around N* for a particular segment to maintain maximum departure throughput while decreasing unnecessary surface congestion. The pushback rate R for a time window is calculated using the following equation:
R = Ntr + T -- Ner,, (2.9)
where T is the predicted throughput for that time window and N"', is the number of departing aircraft taxiing at the beginning of the time window. Calculating pre-dicted throughput is described below. The N-control policy only controls the rate of
departure aircraft when N, > Ncti at the beginning of a time window. Examining
Figure 2-1 reveals a tradeoff in the choice of Ntr. For Net,, < N*, the N-control policy will be used more often, but the departure throughput could be less than the maximum departure throughput. Using the N-control policy more leads to more taxi-out time reduction benefits. However, this risks reducing the departure capacity of the airport, which is very undesirable. For Nct, > N*, the N-control policy will be used less often, meaning congestion levels would be higher and the benefits of the
prliwy decrease. The chvice
-f
eAT.
for a particular sgment must account for thistradeoff.
Notice the error bars for each value of surface traffic N in Figure 2-1. The satura-tion curve is the best fit line for each 15-minute period in 2013 at LaGuardia Airport. However, the standard deviation of throughput around the saturation point is about 2 aircraft. This indicates that factors other than surface- traffic affect the departure throughput. These factors include weather, arrival aircraft, and human factors. Two of these factors, weather and arrival aircraft, can be used to more accurately predict departure throughput during times of congestion.
With the machine learning technique of regression trees, departure throughput can be predicted during times of congestion (Neiir > Netz). Using empirical data, the
regression trees calculate the predicted departure throughput based on the arrival rate and Route Availability Planning Tool (RAPT) for the next time window. RAPT is a
tool used to estuinate the location ant ScvrXUity of weatthLer iII thc ara surrounding ali
airport. RAPT is on a scale of w
to ) wh)le iicates no weather and 3 reptisents
very severe coiivective weather. A IRAPT value is given for sevral areas around tle airport. as well as 15 ininutes into the past and 1.5 mnlintes Into ti future in 5-niute
increienits. To get a silie value, the BAPT Is averaged
over
all time i i ucrete it's al(d all areas aroundtie
airport. Because the e1gressioi trees only predict tliroughputduring tinies of collgestioll. tlley captIire the licertaui1ty preselt III the ilaxilinill
depai rt ure throughplit iiI Figure 2-1. Figure 2-2 shows an exainple of a regression tree
for LaGiardia Airport.
Arr < 4.5
Arr >= 4.5
RAPT
0.6
RAPT >= 0.6
11
Arr < 9.5
Arr >= 9.5
8
9
10
Figure 2-2: Regrssii tree with predicted depjrttire throIghpu it at the
leaves
for La-Gtan ia A t fr 0irpt stgiet 11 N&IC) with a 15-.nun itt wi ow w Arr' inldicates the arrival rate for the tilat vuidow and "BAFT" iltdicates the single IAPT valuefor the t~ine wiiidv.
With all of the piec-es of the N-control policy introduced- the N-control algoritlini proceds ill tHie fol wing imanner. At the beginnilig of a time wiltdow of arbit rary
length, a controtler otserves the current departure traffic oii t le airport surface Ne, the sin'-le RiAPT valu , and t expected arrival rate foa the tinle widow. I
NA
>the N-control policy controls the pushback rate of departing aircraft for the next time window. If N.,. <_ Nri., the pushback rate of departing aircraft is not controlled and pushbacks are FCFS based on scheduled departure time. If N-control is in effect, a departure pushback rate needs to be calculated. With the RAPT value and arrival rate, the regression tree for a particular segment calculates the predicted throughput for that time window. With this, all of the independent variables of Equation 2.9 are known and the departure pushback rate is found.
For the simulations of the N-control policy, the departure pushback rate creates equally-spaced pushback slots for departures in that time window. Each departure is then mapped to a unique pushback slot in the order of their scheduled departure time. If the number of scheduled departures in a time window exceeds the number of pushback slots, the departures without a pushback slot must wait until the next time window. If the scheduled pushback time for an aircraft is after the pushback slot, the aircraft pushes back at the scheduled departure time. If the scheduled pushback time for an aircraft is before the pushback slot, the aircraft is held at the gate until the pushback slot time arrives. This holding time corresponds to time spent at the gate with the engines off. Under the FCFS policy, the aircraft spends that holding time waiting in the departure queue with the engines on. Therefore, the N-control policy shifts the congestion-induced delay from the departure queue to the gate. This reduces the total taxi-out time of aircraft and, because the engines are off, fuel burn is also decreased. This reveals how the benefits of reduced taxi-out time and fuel burn result from the use of the N-control policy.
For the policy to accurately simulate airport operations, a reliable taxi-out time for each aircraft must be found. The total taxi-out time in the simulations consists of two parts: the unimpeded taxi-out time and time spent waiting in the departure queue. The unimpeded taxi-out time is the time it takes an aircraft to taxi to the departure runway when departure traffic is low or nonexistent. So, the simulation uses this as a proxy for the amount of time it takes an aircraft to reach the departure queue from each terminal at an airport. Of course, taxi-out times depend not only on the terminal from which an aircraft departs, but also the gate from which an aircraft departs.
However, analyzing taxi-out times from each gate is impractical for several reasons. Certain gates may not have taxi-out times in the dataset. For the gates represented in the dataset, the sample size may be too small to get an accurate estimate. For these reasons, the unimpeded taxi-out times from each terminal represent a reasonable approximation for unimpeded taxi-out times for aircraft.
The calculation of unimpeded taxi-out time requires the taxi-out time during different levels of surface traffic. For each flight in the Aviation Specific Perfor-mance Metric dataset (ASPM), the taxi-out time is simply the difference between the wheels-off time and pushback time. However, the definition of surface traffic for this application is nontrivial. The number of departing aircraft on the airport surface almost certainly changes from the pushback time of an aircraft and the wheels-off time of that same aircraft. For this reason, adjusted surface traffic Nadj serves as the metric describing the state of the departure traffic. Nag for an aircraft is the sum of the number of departing aircraft on the airport surface at pushback time and the number of aircraft that push back after that time but before the original aircraft's wheels-off time. This definition indicates that Nadj represents the maximum number of departure aircraft that a departure can expect to encounter on the airport surface.
Nadj can also be extracted from ASPM data, so the calculation of unimpeded taxi-out
time can move forward. Simply using the departure traffic at the time of departure pushback may underestimate the traffic conditions that an aircraft experiences.
Figure 2-3 shows a scatter plot of all flights from Terminals C and D at LGA in April 2014. Notice the concentration of points for lower levels of adjusted traffic. Taxi-out times with a lower level of adjusted traffic appear to have less variability than taxi-out times with higher adjusted traffic. This agrees with intuition. With lower levels of departure traffic, an aircraft taxiing is more likely to achieve the unimpeded taxi-out time. With higher levels of departure traffic, an aircraft taxiing may encounter many impediments on the airport surface.
taxi-out times for T-C&D in April 2014 j14) ?j
,o
it
90 70b 100 90 80 70 60 50 40 30 20 10 ) 0 10 20 30 40 50 60adjusted traffic (aircrafts/1 5 minutes)
70 80 90
Figirv 2-,i: Scatter
plot
With titXi-olt tiMIR as a uit io of 1l1t
ights Fon i'rinlinals C atld D at UCA. Data iron April 2014.
a( lj isi(5 til h flc fir
Siiiir to saturatitn wu vs( , w the s( cif. plof c)111t ha
(if
1i Ilgng convex optimiiizatiOll[P558it0l. finir t- conltainlsn //Pcais P if l out tiiitC Tit) 411(d tdjpisiti surlface
tia ic NJq1(I) fR eaih flight fron T1iinllas C anid D at LaHhrd Airp ot jr April
2014. The it pairs of NAQ1(t) and rt) tAK tW frMj of ( i I ) (, y) The curve i5 itoii-thtrtstii 11111(ilOll T = f/fn (Nq). A t l va111 fub, fun- u(N aw) is [ lld111I usilng sili.ple cP)nVeX (pt illliZaion:
111I11 (S - y ) .. )
i 20 qi(2. [w)
sul putt h,)P lie flo. twingentra t s
S4 0
Ox
KY>C
fmean(i + 1) > fmean(i), i = 0, ..., (n - 1) (2.12)
fmean(i + 1) - fmean() > fmean(i) - fmean(i - 1), i = 0, ... , (n - 1) (2.13)
While this solution is for the mean regression, the median regression can also be found:
n
minl
J'i
- yil,
(2.14)i= 1
subject to the following constraints:
Qi = fmed (Ui),= 1, ... ,fn (2.15)
fmed(i + 1) > fmed(i), i = 0, ... , (n - 1) (2.16)
fmed(i + 1) - fmed(i) fmed(i) - fmed(i - 1), = 0, ... , (n - 1) (2.17)
Solving for the best fit results in Figure 2-4. The unimpeded taxi-out time is then the value of this fit when Nad = 0. This process is repeated for each combination of runway configurations and terminals. Terminals C & D are combined for this calculation due to their proximity. Note, the unimpeded taxi-out time calculation does not include separate results for the different meteorological conditions. While taxi-out times may differ between VMC and IMC, this analysis assumes that the unimpeded taxi-out times for the two meteorological conditions remain the same. The motivation for this assumption mirrors the sample size and reasonable approximation arguments made for excluding individual gates from the unimpeded taxi-out time calculations.
taxi-out times in April 2014
90
80- 70-_60 -0>50 i -E S40- 30-10 0 10 20 30 40 50 60 70 80 90adjusted traffic (aircrafts/1 5 minutes)
Figure 2-4: Best fit of the empirical data with taxi-out time as a function of the adjusted traffic for flights from terminals C and D at LGA with runway configuration 22|13. Data from April 2014.
Because aircraft spend more time at the gate under the N-control policy, the likelihood of a gate conflict increases. Recall that a gate conflict occurs when an arriving aircraft lands while a departing aircraft still occupies that arrival's gate. Gate conflicts are undesirable as they introduce an additional complexity to the airport surface. Often, the arrival must wait on taxiways or other areas until the departure is ready for pushback and clears the gate area. However, the additional gate conflicts caused by the N-control policy consist of departures ready to depart because they are being held at the gate after their scheduled departure time. To solve the gate conflict issue, if an arrival lands and is headed to a gate with a departure being held by the N-control policy, the departing aircraft is immediately cleared for pushback. This solution ensures that the departure will clear the gate area before the arrival
reaches the gate.
Gate conflicts only account for one of the costs of implementing an airport sur-face management policy. This section describes the N-control policy without varying the policy parameters or accounting for operational uncertainty. These additional considerations greatly influence the effectiveness of airport surface management.
2.2
Dynamic Programming
The dynamic programming policy models the state of the airport surface as a Markov process with the state described by the number of aircraft taxiing to the runway and the number of aircraft queuing at the runway. By modeling the runway service times as an Erlang distribution[191 with the shape and rate (k, ky), the transition probabilities over a time window are found by numerically integrating the Chapman-Kolmogorov equations, which are described below. The runway service time is the time between successive takeoffs on a runway, meaning that a service time is the time it takes the aircraft at the head of the queue to leave the airport surface. Dynamic programming then uses value iteration to find the optimal pushback policy in terms of the costs of queuing and runway utilization.
The dynamic programming policy contrasts with the N-control policy in the fol-lowing manner. N-control uses a simple equation to maintain departure surface traffic at a predetermined level based on empirical data. Dynamic programming models the runway service time to get a probability distribution of the state of the airport at some point in the future. With this, and a cost of queuing and runway utilization function, dynamic programming finds the departure pushback rate that minimizes costs. While N-control predicts that the state of the airport surface will evolve in a certain manner, dynamic programming considers all of the potential states of the airport and the departure pushback rate accounts for the uncertainty in the evolution of the state of the airport. From this perspective, dynamic programming is a more robust policy than N-control.
be found using the method of moments. Each leaf of the regression trees introduced in Figure 2-2 and described above contains niany observations of departure through-put. Because these empirical observations are Erlang distributed, the event of having exactly i services during a time period A is a Poisson random variable. The two moments pi and P2 are:
- (i+1)k-1 k - (ktA)J) (2.18) Pi = (i - k e .A . )(. i=O j=(i-1)k+1 00 (i+1)k-1 2 (i2.
zk
- . -A. p ) (2.19) i=O j=(i-1)k+1The method of moments, with the condition that the shape k must be a natural number, is done in the following manner. First, a numerical solution to Equation 2.18 can be found for different values of k. Then, the error of Equation 2.19 is found
for each value of k. These steps repeat until the absolute error increases. Once this happens, the last shape k and rate kp describe the Erlang distribution for a given
leaf of a regression tree. The shape k and rate ky give the lowest absolute error
of Equation 2.19. This is done for each leaf of all of the regression trees. For each airport, a solution is found for each shape of the Erlang distribution of service times. These solutions may contain different segments. If so, the rate ky is averaged over all segments of the same shape k. This is an approximation, but the rates of the distributions of equal shape do not differ drastically. Therefore, the' averaging does not greatly affect the accuracy of the final solution. This improves upon the work of Simaiakis [191, which uses one shape and rate for the entire airport.
At the beginning of the time window, the state (r, q) is observed, where r is the number of aircraft taxiing to the runway and q is the stages-of-work to be completed at the runway. The stages-of-work are the product of the number of aircraft queuing and the shape of the Erlang distribution. The shape and rate have already been calculated using the methods described above. The runway configuration, weather conditions, and arrival rate dictate which shape and rate apply. With the state known at the beginning of the time window (Ro, Qo) and the runway capacity C, the
following Chapman-Kolmogorov equations are then solved throughout the entire time window of length A to get the probability P,q(A) of the airport surface being in a given state at the end of the time window:
(2.20)
di =o kpPo,1
dtdPoq
=kIPo,q+1
-kpPo,q, dt 1 < q < k (2.21) kpPoq+1 + P1,qk -A
S-t
1 A -- t Pk(c-1) - kpPo,kck p~r,1
-
Pr'O
ptPoq, k < q < kC (2.22) (2.23) (2.24) 1 q < k-
klpPrq - A - t Pr,q, (2.25)r
At Pr,q, k < q < k(C - 1) (2.26) r-+ 1 + r - I Pr+1,q-k - kpPr,q, A -tk(C - 1) < q < kC
A
- t Pr+1,k(C-1) -kplPr,.kC
kpPR,q I kpPRO,q+1 A-PRo,0 -+
+ ky)PRO,q, (2.27) (2.28) (2.29) 1 < q: k(C - 1) (2.30) k/pPRO,q+1 - klpPiAq,,, k(C - 1) < q < kC (2.31) (2.32) dtPRkC = -kpPRO,kc dPo,q dt dPokc dt dPro dt dPrq dt dPrqdt
dPrqdt
- k pPr,q+i kjtPrq+1 + - kpPr,q+1 dPr kC cit dPROO0 dit dPROq dt dPRoqdt
r+1Pr+1,,-k - klpP,,,, A -- tWith these transition probabilities, the costs of releasing a number of aircraft with pushback rate A can be found, with the assumption that aircraft traveling to the runway queue at the beginning of one time window reach the queue by the start of
the next time window. The minimum cost J (r, q) at each state is given by Bellman's
equation for the infinite horizon problem with discount factor a:
kC
J*(r,q) = min{T(r, q) + a Pr,J*(A,j)} (2.33)
j=0
where T is an average cost of a state over a time period and A is the set of all possible pushback rates. This equation can be solved by value iteration. The pushback rate for the time window is then given by the pushback rate that minimizes the cost function. The cost function must penalize both non-utilization of the runway and lengthy queues. Following the lead of Simaiakis [191, non-utilization of the runway has a constant cost H, while for q > 0, the cost is a non-decreasing function of q. This leads to the following equation
c(q) = (2.34)
[(q 1)2 if q > 0.
H is chosen by an airport to reflect the true cost of losing capacity by not
main-taining runway utilization. The equation for c(q) is only a function of queue length and service time shape, so time is not a factor here. Because dynamic programming accounts for all possibilities for the evolution of the airport state, the cost function must be combined with the probability that the runway queue is of a certain length. To add the time component, the vector of these probabilities is
RO Ro Ro
Pq(RoI
Qo,
t) =
[E
Psro
W),
Pr,1(t), ..., Pr,kC(t)]. (2.35)r=O r=O r=O
In words, the above equation states that, given that the state of the airport was
(RO, Qo) at the beginning of the time window, these are the probabilities that the
runway queue consists of q stages-of-work at time t. Now, with the probability of
runway queue length as a function of time, the product of these probabilities and the cost function can be summed over an entire time window A to find the expected cost of each state:
t(Ro, Qo) =
Z
pq(Ro, Qo, i/10) - c(q). (2.36)i=O
Because Equation 2.35 is sampled 10 times a minute, the summation in Equation 2.36 reflects this sampling. With the expected cost over a time window, Equation 2.33 is solved to find the optimal pushback rate.
The solution over all states for a 15-minute time window can be seen in Figure 2-5
for an Erlang distribution of service times with shape k = 2 at LaGuardia Airport
with a maximum pushback rate of 15 aircraft per 15 minutes.
15 CV :3 Cc 0 0)-CD cis as 10 5 0 0 5 10 15 Departure Queue 20 25
Figure 2-5: Parametric solution of pushback rate with observed values of aircraft taxiing and departure queue length for a 15-minute time window. Each line is the optimal pushback rate for the given state, increasing from 0 to 15 from right to left.
0 3 6 9 15
I . . I
Examining Figure 2-5 provides an intuitive understanding of the underlying math-ematics of the dynamic programming algorithm. For a low departure queue Qo and departures taxiing Ro, the airport surface is relatively empty and the dynamic pro-gramming recommends a maximum pushback rate. For high Qo and low RO, the pushback rate decreases slower with increasing Qo when compared to increasing RO for high Ro and low Qo. This makes sense because, with high Qo and low RO, the queue will likely diminish by the time the recommended pushback rate reaches the runway queue. If Ro is high and Qo is low, the aircraft taxiing to the queue will replen-ish the queue before the recommended pushback rate reaches the runway. Therefore, the pushback rate does not need to be as high in this circumstance. This is reflected in both the slope and nonlinear characteristics of each parametric solution in Figure 2-5. The intuitive nature of the solution reinforces the methodology of the algorithm. Also, the solution can be summarized in a clean figure that can be used in imple-mentation because it contains all possible evolutions of the airport surface, given
RO and Qo. Because the solution is understandable and general, the complexities of
the dynamic programming algorithm are masked, making potential implementation possible.
With the pushback rate found, the dynamic programming policy behaves identi-cally to the N-control policy. Equally-spaced pushback slots form to allow for depar-tures to be held at their gates. Again, this increases the likelihood of gate conflicts, and the dynamic programming policy solves this problem in the same manner as the N-control policy. The two policies do differ in execution. While N-control is only in
effect during times of congestion Nur > Ntri, the dynamic programming policy is
always in effect. Because dynamic programming does not rely on a defined airport congestion threshold, the algorithm can always minimize the cost function, even if the airport is not congested. This difference is evident in the resulting benefits of the two policies as will be seen in the coming chapters.
2.3
Summary
This chapter litroduct s, derives, ad explai118 two PRC liuies, N-control
amd
dv-lin11ic prograniuning. N-control aims to imamitaill depart ilg traffic around an
accept-able value N,1,1 hased oil uiipirical analysis of t he relationaship etweenl departure
throughplit and departure traffic. Dynai1ic progranrinig s5eks to iIi/IIniz a cost
function that penahzes both long queues a(1nd runwvy starvation by uaculating t
lit'
probability of thc airport being I I a certain state at some futur tiie. Each potiCY is thoroughly explajied i1nd derived so as to illustrate cearly the assiuiiptions andI111t(hlodologv used to control depature pushbacks. FiUre 2provides an ill ustrationi of airport surface manageinent wvithl PR( policIs.
''I irK 5 1