by
BRUCE CURTIS LUBOW
S.B., Massachusetts Institute of Technology (1979)
SUBMITTED IN PARTIAL FULFILLMENT OF THE REQUIREMENTS FOR THE
DEGREE OF MASTER OF SCIENCE
at the
MASSACHUSETTS INSTITUTE OF TECHNOLOGY January 1981
) Massachusetts Institute of Technology 1981
Signature of Author
Department of Aeronautics and January 13, 1981 Astronautics Certified by Antonio L. Elias X X :~ Thesis SuperVisor Accepted by MASSACHUSETTS INSTITUTE OF TECHNOLOGY FEB 2 0 1981 Harol Y. Wachman
Chaiffman, Departmental Graduate Committee
LIBRARIES
-AIRCRAFT SCHEDULING:
AN INTERACTIVE GRAPHICS APPROACH by
BRUCE CURTIS LUBOW
Submitted to the Department of Aeronautics and Astronautics on January 16, 1981
in Partial Fulfillment of the Requirements for the Degree of Master of Science
ABSTRACT
The problem of scheduling aircraft is approached with the intent of providing a computerized tool to play a central role in the schedule development process. It is determined that automated approaches and batch processing aids
provide supplementary assistance but that interactive graphics are essential if the
manual scheduling methods currently employed are to be replaced and improved upon.
Various visual representations of schedule data are reviewed and the
sequence chart is determined to provide the best choice for mechanization in
terms of usefulness and practicality. Designs are presented for various scales of
the basic sequence chart and a set of variations that are determined to provide
the information required by schedulers to make each of the major decisions involved in the scheduling process. Those displays are designed for the possibility of implemention on terminals with color, special character sets and highlighting
features.
A set of commands is presented which utilize full screen panels with restricted cursor movement to guide the user through data entry processes. Commands are included to produce and control the content of the various displays and to enter and manipulate schedule data.
Thesis Supervisor: Antonio Elias
Title: Assistant Professor of
ACKNOWLEDGEMENT
I am indebted to Professor Antonio Elias as my advisor on this project for numerous helpful suggestions and constant support. My sincere gratitude is extended to William Pacelli of Eastern Airlines and Jerry Frisora and John Scalea of USAir for the information they supplied on the status of scheduling at their companies. I am also indebted to Professor Robert Simpson for introducing me to this topic and encouraging me to pursue it.
Acknowledgement is also made to Ruth Erickson and Linda Martinez for
AIRCRAFT SCHEDULING: AN INTERACTIVE GRAPHICS APPROACH Table of Contents PAGE i. INTRODUCTION 2. THE 2.1 2.2 SCHEDULING PROBLEM
The Makings of a Valid Schedule 2.1.1 Resources
2.1.2 Components 2.1.3 Relationships 2.1.4 Constraints
Desirable Qualities of a Schedule 2.2.1 The Customer's Requirements 2.2.2 The Airlines' Viewpoint
12 13 14 17 19 23 23 27
3. CURRENT MANUAL AND COMPUTERIZED SCHEDULING AIDS 3.1 Visual Representations of Schedules
3.2
3.1.1 Two Dimensional Projections 3.1.2 Cross Section Views of Schedi
Maps
3.1.3 Projections of Schedule Maps
Existing Computer Aids for Scheduling 3.2.1 3.2.2 3.2.3 32 32 34 ile 41 47 Automated Programs Batch Processing Aids
Online Scheduling Aids
4. INTERACTIVE GRAPHICS DESIGN FOR SCHEDULE DEVELOPMENT 4.1 The Advantages of Interactive Graphics
4.1.1 Simplification 52 53 54 56 61 61 62
TABLE OF CONTENTS (Continued)
PAGE
4.1.2 Visualization 64
4.1.3 Communication 65
4.2 Information Requirements of the Schedule
Development Process 68 4.2.1 Production 68 4.2.2 Manipulation 70 4.2.3 Validation 74 4.2.4 Evaluation 77 4.3 Requirements of CRT Displays 80 4.3.1 Size 80 4.3.2 Resolution 83 4.3.3 Format Generality 85 4.4 Displays Design 87
4.4.1 Level One: The Basic Sequence Chart
Display 87
4.4.2 Level Two: Modified Displays 100
4.4.2.1 Scale Modifications 100
4.4.2.2 Rearrangement 115
4.4.2.3 Highlight 126
4.4.3 Level Three: Combined Modifications 129
4.5 Interactive Commands and Working Panels 143
4.5.1 Access Sieve 144
4.5.2 Display 152
4.5.3 Access Flight 156
4.5.4 Sequence 168
4.5.5 Crossover 168
4.5.6 Access Global Parameters 171
5. RECOMMENDATIONS AND CONCLUSIONS 172
LIST OF FIG URES FIGURE 1-1 FIG URE FIG URE FIG URE FIG URE FIG URE FIG URE FIG URE FIGURE FIG URE FIG URE FIG URE FIG URE FIG URE FIG URE FIGURE PAGE
Organizational View of Scheduling 7
3-1 3-2 3-3 3-4 3-5 3-6
Three Dimensional Schedule Space Route Maps
Typical Schedule Map
Station Activity Representations Routing Charts
Typical Sequence Chart
4-1 4-2 4-3 4-4 4-5 4-6 4-7 4-8 4-9 FIGURE 4-10 33 35 39 44 48 51
Three Levels of Display Derivatives
Alternative Data Arrangements
Complete Sequence Chart Display
Use of Background Color in Sequence Display Expanded Sequence Chart Display
Compressed Display Scales
Altered Format Compressed Display Scales Origination and Termination Display Format
Daily Sequence Summary of Originations and Terminations, Flight Numbers and
Supplemental Information
Daily Sequence Summary of Flight Numbers and Supplemental Information
88 92 96 98 102 103 105 108 109 112
Daily Sequence Summary of Flight Numbers Sequence Inventory FIG URE FIGURE 4-11 4-12 113 114
LIST OF FIGURES (continued) FIG URE FIG URE 4-13 4-14a FIG URE 4-14b FIGURE 4-14c
FIG URE 4-15a
FIG URE 4-15b FIGURE FIGURE 4-16 4-17 FIG URE 4-18 FIG URE 4-19 FIGURE 4-20 FIG URE FIG URE FIG URE FIG URE FIG URE FIGURE 4-21 4-22 4-23 4-24 4-25 4-26 FIGURE 4-27
Aircraft Type Inventory
Sequence Display for Turns to Specific
Flight
Sequence Display for Turns by Station and Time
Sequence Display for Turns in
First-In-First-Out Order
Sequence Display for Crossovers to Specific Flight
Sequence Display for Crossovers by Station and Time
Ramp Chart Display
Ramp Chart with Incremental Aircraft
Count Highlight
Compressed Turn Display for Single Time Band
Compressed Turn Display for Multiple
Dates
Compressed Crossover Display for Single Time Band
Compressed Crossover for Multiple Dates Compressed Station Activity List
OAG Timetable Service List Access Sieve Working Panel
Initial Access Flight Working Panel
Typical Completed Access Flight Working Panel
Sequence Working Panel
PAGE 116 118 119 120 122 123 125 132 134 136 137 138 140 142 151 158 161 169
LIST OF TABLES
PAGE TABLE 4-1 Character Definitions
TABLE 4-2 Command Language Symbols and Syntax
TABLE 4-3 Display Options Menu Items
99
145
1. INTRODUCTION
To the casual observer airlines seem to be on the leading edge of high technology applications. They use modern and sophisticated aircraft, a highly advanced reservation system and communications network, and the most refined navigation and electronics equipment available. So it is disillusioning to discover that in the back rooms, corporate planning, and especially aircraft scheduling, has not kept pace with recent advances in modern techniques and technologies.
This is even more surprising considering how critical the scheduling function is to the success of an airline. Although the scheduling of manpower,
production and inventory resources is performed in many industries, it rarely
assumes the significance that it does for an airline. In most industries the
selection of products to produce, the methods of production and the markets to target are somewhat independent functions. The scheduling process of an airline, however, combines all of these functions: the schedule is at one time the means
of production, the product and the marketing plan.
Scheduling plays such a central role because it is the sole output and
objective of the airline. All departments, personnel and resources ultimately
contribute to the determination and implementation of the schedule. Figure 1.1
shows how scheduling interacts with other functional groups within a typical airline.
U, oL
W Z =
?:a
- aNo function in the airline can be performed independently of the schedule. Each department must provide the schedulers with an estimate of resources and
requirements and receive similar feedback from them. Scheduling coordinates the
activities of the airline by supplying a focal point for the planning process. Because of this coordinating role, scheduling occupies one of the highest positions in the management hierarchy.
The planning cycle is normally a hierarchical activity with each level's decisions influencing the level below to a much larger extent than the one above. Airline planning, however, does not fit this rigid methodology since scheduling cuts across all three levels. Essentially all corporate level planning, from fleet planning to mergers, must be evaluated in terms of its impact on the schedule. Each alternative must be quantified in terms of a detailed schedule, which can be further evaluated, before a decision can be made. Only limited confidence exists in aggregate methods for forecasting the impact of decisions because complex issues in the scheduling problem often make otherwise reasonable management goals impracticable.
In spite of its importance, scheduling is still done by a few analysts using colored pencils and large pieces of paper taped to the wall. Attempts have been made to mechanize some of this process but have met only limited success. Algorithms to automatically generate schedules have only been able to deal with limited subsets of the total problem, and have therefore not had a major impact on the scheduling function and programs to provide batch processing services have only had a peripheral influence on scheduling. On line access to data bases and other schedule development tools, while steps in the right direction, have not yet
This analysis proposes that a computerized system that can handle the full complexity of realistic commercial schedules, provide interactive response to human decisions and utilizes graphics capable of replacing and even improving upon the wall charts now used, is the appropriate tool to improve the quality of schedules and the speed at which they are developed. The availability of moderately priced stand-alone computer systems with full graphics capability and the realization that the human role in decision making processes as complex as scheduling can not be eliminated, have made this approach the most promising at
this time.
The need to improve the scheduling process is particularly strong at this time. Increased fuel prices, and competitive pressures created by deregulation, can best be dealt with through better and more responsive planning. Because of its significance to airline planning, scheduling is probably the best candidate for improvement. By increasing the quality and speed of schedule development, an airline is equipped to investigate more viable alternatives in each planning cycle.
The following analysis identifies the elements involved in building a schedule and then presents a design for a set of displays and interactive commands that will allow a schedule to be developed entirely on a computer. The computer tool presented here is designed to supplement schedule development, not to automate it. This tool is intended to replace the manual methods now employed, and, in so doing, provides a wide range of improvements in the way the complex schedule data base is produced, recorded, modified and displayed.
Implicit in the approach described is the assumption that the human role is
intended to contribute to easing the scheduler's job by taking over routine deterministic tasks, presenting information in the most convenient form possible and minimizing the effort required to control the computer. The goal is to leave the scheduler free to make important decisions and to present the information
essential to making them.
Section 2 provides a background on the scheduling problem including
definitions of the important terms and concepts needed to understand subsequent
discussions. Section 3 reviews the many manual graphic aids currently used by schedulers in industry today as well as a number of the existing computerized tools designed to aid this process. In Section 4 the advantages and requirements of interactive graphics are discussed and designs for reference displays, inter-active displays and a controlling command language are presented.
2. THE SCHEDULING PROBLEM
The complexity of the aircraft scheduling problem has best been described by Melvin Brenner of American Airlines as "...trying to put together a jigsaw puzzle, constructed in three dimensions, while the shape of key pieces is constantly changing." (Tipton, Stuart G., et al. 1961). A formidable task indeed.
This analogy is an excellent one, but the problem is, in fact, even more complex than this might indiciate. A jigsaw puzzle is normally made up of a single material such as cardboard. These pieces are two dimensional and of a constant shape, the interlocks between pieces are unvaried both in number and in kind, and finally, the precise picture printed on the pieces is not only unchanging but is known in advance.
Scheduling, however, has none of these consistencies. Many additional
degrees of freedom exist for each aspect of the puzzle. A variety of materials
are used to construct three dimensional pieces of flexible size and shape. A number of interlocks are required but nearly an infinite number of solutions exist, not all of which are equivalent. Other interlocks may optionally be specified to
alter the final picture.
This picture must meet certain criteria for quality and excellence, and must have certain characteristics and some specific images present, but the
actual final picture is the scheduler's decision. The scheduler has a conception of the image he hopes to produce, he has his colored pencils and an understanding of
with certain portions that he is confident belong, and proceeds with other
attractive additions. Some aspects will augment each other and bring the
schedule to life, other portions will be overwritten and drawn again to fit the
emerging patterns.
In the following sections each of these aspects of scheduling will be defined
and expanded. First, some of the major resources that are used, the construction
of the components of the schedule or puzzle pieces, the nature of the interlocks, and the requirements and characteristics of a completed schedule are all defined. Next, some of the techniques for visualizing this complex three dimensional problem in two dimensional media are discussed. Finally, the qualities and
characteristics that constitute the goals of the scheduler or the desired picture
that the finished schedule should depict are described.
2.1 The Makings of a Valid Schedule
To understand the problem the various elements that make up a schedule and the relationships between them must be precisely defined. The following
discussion presents these key definitions and concepts. Unfortunately, these
terms have not been used in a consistent and rigorous manner in practice, so to
clarify and delineate these concepts each term will be given a precise definition,
2.1.1 Resources
Scheduling is concerned primarily with two basic resources: airplanes and airports. Without either of these there would not be air transportation or any need to schedule air transportation services.
Within these categories a number of distinctions can be made. An aircraft, as used here, refers in a generic sense to any "aircraft of a particular type." An
aircraft type is a specific configuration of technical and performance
charac-teristics such as: model, seats, range, speed, etc. Associated with these is an identifier such as 727-200, DC9-30, etc. When referring to a single specific aircraft of a given type and with a unique tail number identifer such as A1234B, the term piece-of-equipment will be used. Finally, an aircraft fleet is a number of pieces of equipment of the same type which can be used interchangably.
The scheduler is concerned with a fleet or a number of fleets of aircraft that can be flown between airports. Although it is of some importance to the corporate planning process, and even to a large degree to the scheduler, the
details of the operation of this fleet are ignored in this definition of the
scheduling problem. So for now, this fleet is assumed to be manned with flight and cabin crews, fueled and ready to go.
Airport
Again, the scheduling problem will be initially defined without any consid-eration of the details of station opconsid-erations. Each station will be presumed to have sufficient gates, man power, fuel, baggage and passenger handling facilities, etc.
2.1.2 Components
The basic component, or building block, of a schedule is the flight. A flight is a complex combination of the resources forming a relationship in both space and time. Each flight is identified uniquely by its flight number, currently a combination of up to four alphanumeric characters. A unique aircraft type is associated with a flight and, eventually, one or more pieces of equipment will be assigned to a flight.
The construction of a flight begins by joining pairs of stations together to form links over which aircraft will fly. A whole series of links on which passengers can travel in succession is known as a routing. Links and routings are space dimension variables which can be combined with specific departure and arrival times. When a link is supplied with these operating times it becomes a
segment.* Similarly, a routing is transformed into an itinarary when the time
dimension is included.
In addition to the operating times, itineraries contain two types of event duration times: block time, which is the duration of a segment from the time the aircraft leaves the gate at one station to the time it docks with the gate at the next station; and, transit or station transit time, which is the time between
successive segments of an itinerary. These four times (Departure, Arrival, Block
*The term "segement" is frequently used to refer to a link in which adds to the confusion of this terminology.
and Gate) can be used in combination to unambiguously define a flight's operations, however, under or over specification is possible and must be avoided. Proper specification requires that the following conditions be met:
1) At least one arrival or departure time must be explicitly specified
for each flight itinerary.
2) Exactly one block or gate time between two specified arrival or
departure times must be left unspecified.
3) All block and gate times before the first specified departure time
and all block and gate times after the last specified arrival time
must be explicitly specified.
A flight, then, is composed of a number of itineraries. Each itinerary may be applicable to a flight on certain days, this is known as the itinerary's
application. Normally, an application will begin on some date, continue until a later date and will be valid on certain days of the weeks during that period. A single flight may only contain one valid itinerary on any given day although it need not have an itinerary valid on every day.
In addition to being a collection of aircraft movements between stations at
specific times, a flight also specifies a set of markets to be served. These
services are of a variety of types and quality and may not correspond directly to
the segments of the flight. Three types of service are possible : nonstop, direct
or through, and connecting. Each of these provides transportation between one market area where a passenger has intentionally spent time, known as his origin,
and a second market area where the passenger will also remain for some time, known as his destination.
a) Non stop service is provided by a single segment of a flight. It allows a passenger to travel between his origin and destination on a single plane and without intervening stops.
b) Direct or through service provides a link between two market areas using more than one successive segments of a single flight. This allows a passenger to travel between his origin and destination on a single plane but making one, two or more stops enroute.
c) Connecting service is provided by segments on more than one flight. This service carries a passenger from his origin to an intermediate
station, known as a connecting point, where the passenger can take
another flight to his destination. Service can be provided with a combination of through and connecting flights. Connections be-tween two flights provided by the same airline are known as online
connections, as opposed to interline connection between flights on different airlines.
A single flight of N segments can provide N nonstop services, N-1 one stop services, N-2 two stop services, etc. In addition, an unlimited number of connecting services could be provided at any or all stations in the itinerary. However, it is only desirable to provide a selected subset of the possible services.
The ability to exclude services from flights adds another degree of freedom to the shape of the flight.
Therefore, the three primary components of a schedule are: routing, timing, and service exclusion. Each of these is variable allowing the scheduler a great deal of flexibility. On the other hand, none of these can be specified independently. The services possible depend on routing and, in the case of connections, on timing. Timing, of course, depends on routing and services to be offered and routing is similarly dependent on the other two.
2.1.3 Relationships
Once a number of flights have been created the process of joining the pieces together can begin. As this process proceeds new flights can be added and the old ones rearranged to meet the scheduler's needs. Rather than making the problem easier to solve, this degree of freedom increases the viable options open
to the scheduler and lengthens the search for a better solution. Still, to a large
extent the scheduler can manipulate the pieces of the schedule independently
while retaining the option of returning to the flight creation phase to improve the
shape of the pieces.
Flights can be joined together into larger blocks of the schedule. However, this is not an easy matter, since two different types of interlocking relationships
between flights are possible, and these interlocks must be compatible in both the
space and time dimensions.
The first interlock between flights is known as the turn. A turn indicates
the path that an individual aircraft will take in flying a series of flights. Thus, an
so on. A string of flights so joined will be called a sequence, although the term "cycle" is often used for this concept.
A flight can only turn to another flight if they are compatible in both time and space as well as equipment type. It is insufficient for the first flight to terminate: an origination must occur at the same station as well. The ground
time constraint is usually extended so that a specified interflight or turn time is
allowed between two flights turning at a station.
As discussed earlier, a flight is not a single itinerary nor is it likely to be flown on only a single day. Each application of a flight is a seperate unit which can be turned to different flights on different days. There is no requirement that applications of a flight on different days be members of the same sequence. Thus, not only are flights three dimensional but they are discontinuous with parts at many times and locations. All of these parts must be considered when forming
the pieces and interlocking them.
Sequences can continue for days, weeks or months. Each sequence is flown by one aircraft throughout this period. A sequence can be a complete and independent schedule with no relationship to other sequences; however, this
situation rarely exists. Rather, sequences are linked together using the second of
the two interlocking methods.
Crossovers also join flights in both the space and time dimensions. A cross
over is the relationship between two flights, one arriving at a station before the
second one departs. Again the times must be separated by a specified time known as the connection time. The crossover produces a number of connection
possibilities for passengers on the arriving flight. This distinction between
cross-overs-the logical relationship between flights that permits connections to
occur-and connections themselves, must be understood. Flights may act as both donors and recipients of traffic flow if the crossovers are provided both ways between flights. Many flights may be crossed over to one another at a single station during a period of time. These arrangements of many flights mutually exchanging traffic are known as connecting banks or connecting complexes.
Thus, flights may be joined together both into sequences and connecting complexes. However, the same set of flights must be joined into sequences and linked into one or more connecting complexes making these processes highly interdependent. The flights must be so configured to permit as many desirable crossovers to occur as is possible while still permitting all the necessary turns to
occur.
2.1.4 Constraints
Many limits to the freedom to shape and join the different aspects of
scheduling exist. These constraints affect both airports and aircraft and arise
from both internal economic causes as well as external regulatory ones. Of
course, many of the constraints are three dimensional, specifing simultaneous space and time limits.
Fleet size is probably the most important and immediate concern of the scheduler. Although aircraft can be leased and purchased given sufficient time,
that no more simultaneous sequences can be scheduled than there are aircraft available of the type specified to fly those sequences.
Of even more signficance is the constraint that the fleet size must at least remain constant during a schedule period. Therefore, at the very least, exactly as
many aircraft arrive at each station as depart that station. This condition
constitutes balanced flow. If this condition were not met, stations would be acting as aircraft "sinks" and "sources." Aircraft flow can be balanced over any period of time; for instance, each station may be balanced every day or only once a week.
A network with balanced flow may have continuous flow. Continuous flow exists when every flight turns to another flight so that sequences have no gaps from the beginning to the end of a schedule period. Continuous flow can exist over a period without resulting in a net balanced flow over the entire period. Thus continuous flow could carry a fleet of aircraft from some initial geograph-ical distribution to another one over an extended period of time.
If a network has both continuous and balanced flow then it is said to have cyclic flow. A cyclic schedule not only maps a continuous flow of aircraft but ends in a state identical to its initial state thereby permitting the schedule to be repeated. Individual sequences can repeat at regular intervals, for instance daily, and are thus themselves cyclic. This is the origin of the term cycle which is often used to refer to any daily sequence whether it is cyclic or not.
Maintenance restrictions impose another significant constraint on sche-dules. Routine maintenance that must be performed on a regular basis can only
be accomplished at the airlines maintenance bases. This requirement means that every sequence must include a turn at one of the airlines maintenance bases of an adequate duration at regular intervals. For a typical airline (e.g., USAir), this means that aircraft must spend every other night at a maintenance base.
Often, resequencing flights can provide adequate maintenance time for all aircraft without rerouting any flight itineraries. Flights can also be ferried for
maintenance, however, careful planning can usually eliminate the need for this wasteful operation. This planning includes locating maintenance bases as well as
scheduling aircraft.
A parallel problem to the scheduling of aircraft is the scheduling of
aircraft crews. Although not strictly a constraint, inattention to crew
require-ments and limitations can result in inefficient schedules. Because of both regulatory and union rules concerning flight and cabin crew, many constraints are placed on their utilization. Limits are placed on actual flight time, duty time which includes the non flight portion of the crew's job, and overnights which result
when aircraft schedules and duty time restrictions prevent the crew from
returning to their home base for a required rest period. These constraints on crew utilization translate into costs for the airline when schedules are so configured as
to require excessive overnights, deadheading, and other inefficiencies. Although
not the primary task of the scheduler, this must be a consideration.
An important set of constraints involves the capacity of individual stations. These take four forms: gate capacity, station staff capacity, fuel availability, and regulated airport access (slot) capacity. Again these are combined time and space constraints. The average capacity of a station is rarely a problem, rather it
is the peaking of activity at busy times of day that overloads the fixed resources at the station. A scheduler must pay careful attention to the peaks of activity to keep them within acceptable levels.
This is particularly true for airports with regulated access capacity which
must be strictly complied with. Four U.S. airports (DCA, ORH, JFK, and LGA) have already begun setting fixed limits on the number of operations (takeoffs or landings) at the airport per hour, known as slots. Other airports, such as DEN, are
close to ths situation. Curfews also exist at many airports restricting the
operating times of the earliest and latest flights of the day.
Another critical situation for station activity peaking occurs at small or
infrequently used stations. It is bad enough that facilities must be maintained for the handful of flights that use them; even more inefficiencies result if a schedule calls for two aircraft to be serviced simultaneously while station facilities and staff remain idle throughout the remainder of the day, or when flights are spaced so far apart that a second shift must be hired to cover both.
Another restriction on the use of airports relates to the types of aircraft
permitted to operate there. This limit can arise from noise regulation, which may vary by time of day, or from runway length or construction, or from gate size. The quantity of fuel available at a station may also restrict the number of flights
2.2 Desirable Qualities of a Schedule
The previous section described the materials, pieces, interlocking
relation-ships and constraints involved in the schedule problem. But what are the qualities and characteristics of a "good" schedule? Clearly, many valid schedules are possible, but not all of them are equally attractive to the customer or the airline.
In addition to meeting the many constraints, a scheduler attempts to produce a plan that constitutes the best possible compromise between the requirements of the customer and the goals of the airline. This section describes
who some of the customers are and their needs, as well as some of the desirable qualities of a schedule from the standpoint of airline management.
2.2.1 The Customer's Requirements
The Importance of Service/Demand to Scheduling
As in any industry, the airline's customers are unconcerned with the means of production. Their primary concern is the resulting product. The product, of
course, is transportation between two points, but there are many other aspects that are of interest to the customer. Furthermore, there are many different types of customers, each desiring not only service between different points but also at different times and with a variety of other features.
Customers are attracted by a variety of factors unrelated to the actual
reser-vations and ticketing procedures, fast and reliable baggage or cargo handling,
attractive and comfortable terminals and aircraft, and many others. For the purposes of this discussion, only those considerations that are influenced directly
by the schedule will be considered.
As far as the customer is concerned, the schedule is what is presented in the Official Airline Guide (OAG) and similar timetable publications. He is not
concerned with how aircraft are routed and turned nor with the complex compromises that resulted in producing crossovers, satisfied station constraints or
economical crew duty rotations. The bottom line is the table of services between a passenger's origin and his destination. To understand the customer's viewpoint it is only necessary to study how he will perceive various alternative services as
presented in the OAG or indirectly through a travel agent or airline reservations agent.
The market for air transportation is a diverse and highly heterogeneous one. Both passengers and cargo are carried by airlines. Demand exists between
many market areas, which are defined as geographical regions that are homo-geneous in that demand for service to them is not affected by which airport
located there is used. A market is a directional pair of market areas such as Los Angeles to New York or vise versa. Demand for transportation in each market is highly variable with the time of day, day of the week and season of the year. Each of these dimensions of demand combine to produce a multiplicity of
different components to the total demand for transportation services.
Passenger traffic has traditionally been partitioned into two classes:
are highly sensitive to the time of day and day of the week on which flights are offered. They are most likely to travel during traditional commuting periods so as to be able to conduct business on the same day as their trip, or so as to reduce interference with their working and rest periods. In short and medium haul markets they usually prefer to travel on week days, whereas on longer haul, international routes, they often choose to travel on Sunday so as to have
sufficient time to get settled and rested before Monday morning. (See Elias,
1979).
On the other hand, pleasure travelers are more likely to travel during the less hectic mid-day hours and on weekends. Much larger differences in the seasonal variations in demand exist for pleasure travelers than for business
travelers.
Cargo demand tends to be higher at night. (Taneja, 1979) Various
companies, freight forwarders and the post office collect cargo throughout the
day to ship after normal business hours for delivery before the start of the next business day.
Concern for flight times involve a combination of local arrival and departure times. This is of particular concern for flights crossing a number of time zones. A five hour flight departing from Los Angeles at 6:00 PM will arrive in New York at 2:00 AM, clearly an inconvenient time for most travelers. This
problem alone causes very different patterns of demand between different
The type of service offered is another aspect of the schedule affecting the customer. It is not merely the increased time of a through or connecting path that disturbs passengers and cargo shippers. Stops increase the probability of delays and are uncomfortable for passengers. Connections create the possibilities of missing a flight and losing baggage or cargo in addition to the drawbacks of the stop involved. Non-stop service is always the customer's first choice: however, a through flight or connection at a more convenient time may outweigh inherent disadvantages. The number of competing nonstops in a market and their
departure times will determine whether other services will be acceptable.
Finally, flight times as close together as one minute may not be viewed equally by the customer. This condition arises from a variety of causes. Since
services are listed in chronological order the earliest one is the first one
encountered and often the one chosen for that reason alone. The other two
considerations for setting flight times are related to passenger convenience. Passengers making frequent trips become accustomed to using particular services
at specific times. They may have worked out a routine around a particular service that they are comfortable with and don't wish to change. Another
convenience is regular service such as hourly, daily, etc. Also, service times that are round numbers are easy to remember and more appealing so an 8:00 flight might be chosen over a 7:53 flight just for the convenience of on-the-hour service.
If service were the only consideration, a timetable could be drawn up independently of aircraft routings that might be a highly desirable product.
However, only the objectives for a desirable timetable can be specified and a schedule must be constructed to produce a timetable as close to this perceived one as possible.
2.2.2 The Airline's Viewpoint
In trying to produce the desired timetable from the service standpoint, while meeting the many constraints, the airline is also trying to maximize its revenue and minimize its costs. Although these goals are often contradictory,
carefully planned schedules will optimize potential earnings.
A variety of routing and timing decisions are influenced by the goal of efficient use of the airline's resources. The primary concern of the scheduler is to provide flights that will produce sufficient volumes of traffic to fill the aircraft to profitable levels. This goal can be accomplished through a variety of means.
Some markets, because of their high density, geographic location or heavy competition will easily justify nonstop service. In many markets, however, the frequency of flights needed to meet competitive schedules and to provide an
adequate level of service exceeds the quantity justified by the traffic in that
market alone. Two approaches can be taken in this situation to provide
reasonable service without committing the airline to an unprofitable situation.
Both of these involve combining traffic flows from multiple markets on single flight segments. Which technique will be used depends primarily on the geography
of the network.
The first of these techniques is sometimes called cascading of traffic. This involves creating aircraft routings between complimentary areas. For example,
connected to one another by nonstop service the number of separate segments required to serve each market once would be N(N-1), where N is the number of cities; or in this example, N(N-1) = 12 segments.
But if these cities could be linked together by a single route from A to B to C to D flown once in each direction, then service would be provided in each market with only (N-I), or 6 segments. If a link is added between D and A to route the aircraft in a closed loop, then only N, or 4 segments are required. In addition to saving the costs of flying the extra segments, each flight will now have passengers from 3 different markets on each segment. Between A and B the flight will carry AB, AC and AD traffic. Between B and C it will carry AC, BC, and BD traffic, and so on.
This simple routing has simultaneously reduced the cost of serving those
markets while increasing the traffic on each segment that will be flown. Of
course, the quality of service has declined from nonstop to through service in 6 of the 12 markets. For this reason and for a number of others that will be discussed later, this technique must be used with a great deal of care. Still it is a good way to provide economical service in markets in which it would otherwise be impossible.
Another opportunity arises to provide economical service in low density
markets that share a common origin or destination. An isolated market area may
not produce enough traffic in any single market to justify service. But all traffic originating at this station can be combined and carried as a whole to a convenient connecting hub. At this point the aggregated traffic flow can be parceled out to a bank of flights departing that station for any number of destinations. This
procedure also helps to cascade traffic on those departing flights by increasing
the traffic using various segments and combinations of segments on these flights, at the expense of making some, if not most, of the direct services into connecting services.
Despite the power of aggregating traffic flows, many drawbacks exist. While very high load factors may be achieved using these techniques, profits might actually suffer if they are not used properly. A scheduler must be careful
to consider costs and revenue above mere traffic.
To really maximize airline profitability not only must high load factors be achieved on most flights, but also the utilization (average number of hours an aircraft is flying per day) must be high. High equipment utilization is essential if the airline is going to be able to cover its fixed costs. Utilization is limited by the ability of the airline to find markets with sufficient demand. At less popular
times utilization must be sacrificed to preserve average load factor.
The length of a flight segment, known as stage length, also has an important impact on profitability. Short stage lengths have two major disad-vantages. First of all, the high costs of takeoff and landing, including ground
handling of the aircraft, passengers, baggage and cargo constitute a large portion
of the segments cost. Although fares can be higher per mile on short haul
segments, they cannot be raised indiscriminately without forcing traffic into
other modes of travel which are readily available for shorter trips. In addition, on
short stage lengths the gate time between segments is a larger portion of the
Yet the objectives of cascading and combining traffic flows is inconsistent
with the objective of maximizing stage lengths. Multiple stops and connections
require shorter stage lengths than do nonstop links between distant stations. Not only are shorter segments being flown, thereby increasing costs, but, in addition,
long haul traffic that is occupying space on many short haul segments cannot be charged for the added costs of the stops or the added circuity (see below). If long haul passengers make up a large portion of the traffic on these short haul segments, service could be improved and costs reduced by providing more nonstops.
Another related problem is that of seat "block out". This occurs when a flight contains both short and long haul segments and there is significant demand
for service in the short segment. On such a flight it is particularly desirable to
fill up the long haul segment or segments since these will produce the most revenue. If one of the short haul segments becomes filled primarily by local
traffic, then traffic between stations upline from this blocked segment that would
have continued on through the long segment cannot use the flight. For example, imagine a flight from A to B to C to D, where BC is a long haul segment and AB and CD are short hauls. If AB demand is high, then AC traffic, which would help
to fill the important BC segment, will be blocked out.
One other factor must be considered when combining links to form routes.
This is the issue of circuity. Fares, at least standard coach fares, are normally based in large part on the great circle distance between the origin and destination stations. The actual path taken including intermediate stops and connections may
be much longer, or circuitous, than a direct flight. This not only results in poorer service to the customer, but also dilutes the revenue per mile, or yield, received.
In conclusion, the ability to cascade and connect traffic is a very powerful tool that must be used with care. It is possible for inappropriate routings and
connections to dilute fares, block out traffic and reduce utilization. On the other
hand, proper combinations of the schedule elements can produce a tremendous synergy. Each flight can be both receiving and contributing traffic support to many other flights in a profitable manner. All elements of the network can work
together in consistent and compatible ways that result in far greater output than
3. CURRENT MANUAL AND COMPUTERIZED SCHEDULING AIDS 3.1 Visual Representations of Schedules
How can a scheduler expect to grasp the immense complexities of the three dimensional and ill-defined aspects of the scheduling problem? Ways have been found to represent the elements and relationships of a schedule so that they may be more readily understood and manipulated. These representations are visual or graphic models of the complete three dimensional picture of the schedule.
What could have been a four dimensional problem (three in space plus time) is conveniently reduced to three dimensions by ignoring the vertical component -altitude. Thus the problem is one of motion on a two dimensional plane or map. The vertical axis in a three dimensional drawing of a schedule is now free to represent time. Aircraft movements can be depicted as space-time lines winding their way from station to station while continuously progressing through time. Figure 3-1 shows a sketch of such a representation for a single aircraft sequence.
While this representation accurately depicts all of the events that make up
a schedule, it is not a practical tool. The difficulties of drawing three dimensional relationships on a two dimensional medium make this method cumber-some. This will be even more true as more aircraft sequences are added. As the
event lines crisscross through the network the diagram will become increasingly
difficult to read. A mechanical version of this model can be imagined using
strings to represent sequences that wind between posts representing each station.
This would soon produce a tangled web of interwoven sequences that would be
TIME EAST SOUTH AAA
I
;CC
I DDD FIGURE 3-1As with any form of mechanical or architectural drawing the solution to this dilemma lies in somehow eliminating one of the dimensions so that a two dimensional drawing can be made. In doing this it is important to preserve as much of the information contained in the original representation as is possible. Often combinations of different views or cross sections is necessary to completely
represent the original information.
The following discussion describes the possible projections and cross sections used separately or in combination to compress the three dimensional picture to two and then to one dimension. Many of the resulting representations are used by schedulers today and have been named. Some variations exist for many of those basic drawings. Still, all customizations are members of one of the basic families of compressed schedule space drawings.
3.1.1 Two Dimensional Projections
Three projections, one parallel to each of the three axis, are possible. However, the two projections onto the time-east/west and the time-north/south,
plane are very similar. These will be referred to jointly as schedule maps. The
other projection onto the east/west - nortVsouth plane is a quite different
representation known as a route map.
Route Map
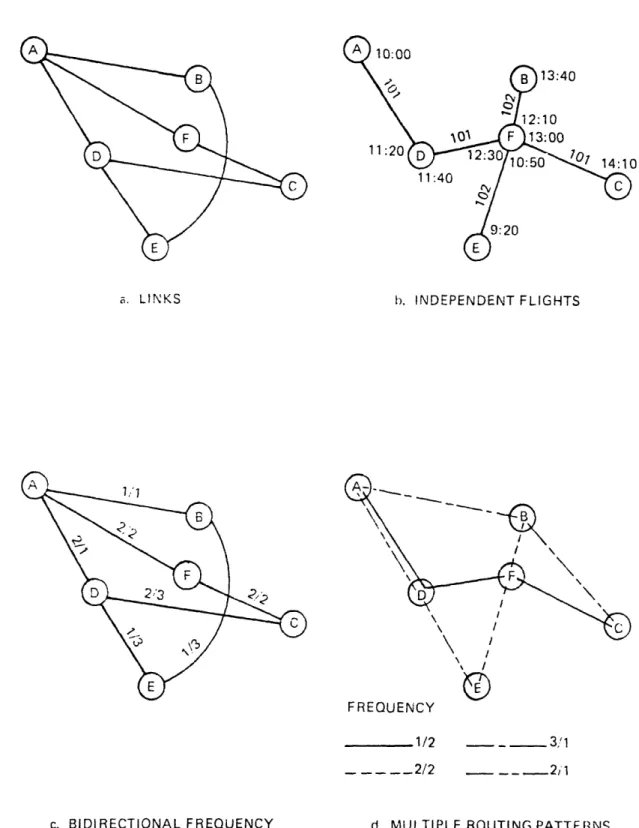
Route maps (see Figure 3-2a) are probably the most familiar representation of an airline network. They actually depict the location of each station and the links between stations. However, three significant portions of the original
10:00 13:40 11:20 b. INDEPENDENT FLIGHTS FREQUENCY 1/2
_
- -
_2/2
c. BIDIRECTIONAL FREQUENCY d. MULTIPLE ROUTING PATTERNS
FIGURE 3-2 Route Maps ;3 a. LINKS ... f- --- ----1\ - ---- -I
rl)
- -~~~
3,!l - - --2ii/'
information content are lost in this projection. Most important is the loss of all time information. The essence of a schedule over a mere route plan is completely lost. Turns and crossovers cannot be shown-this loss is critical.
Almost as significant is the loss of identity of individual routings. All segments between two stations overlap so that it is impossible to determine the frequency of nonstop service in any market. Furthermore, a route map, despite its name, does not show routings. Only links are depicted on this map; the chronological sequence of segments and flights is lost: through service is not depicted, only nonstops can be inferred.
These last two deficiencies are partially a result of the loss of the time variable since frequency and chronological sequence are time dependent relation-ships. But it is also true that all three of these losses result from the overlapping of events that are independent when viewed in space-time but are identical when only their spatial dimensions are considered. For instance, if only one flight were shown on a route map each of these problems would be resolved.
In Figure 3-2b two flights that have no common segments are shown and labeled with operating times. Here it is possible to see most of the schedule's dimensions including the frequency (one) and the routings. Still, without a time axis it is difficult to visualize the relationships between many events occuring throughout the system simultaneously. In addition, it is difficult to indicate which of the potential service offerings have been excluded.
To alleviate the overlapping problem to some extent, a number of methods can be used. Each link on a route map can be labeled with bidirectional frequency
of flight segments. In Figure 3-2c the frequency from the first (alphabetically)
station is shown before the reverse direction. This provides nonstop service
information but still does nothing to depict through service or service times.
The use of color, or other discriminating drawing technique such as the broken lines used in Figure 3-2d, makes it possible to indicate which segments are members of the same routing pattern. In this representation not only are nonstop frequencies shown but all through services are shown as well. The crisscrossing lines within the station symbols indicate how flights turn to one another. If drawn large enough flight numbers and operating times could be added to this map and a
complete representation of the original information could be achieved.
However, it is easy to see that if many different routings were specified over the same set of stations it would become increasingly difficult to find unique colors or line dotting patterns to represent each routing. In high density markets the number of lines that will have to be drawn will become cumbersome. This
problem will aggrevate the confusion of links that cross each other or that must
be drawn as arcs to avoid passing through intervening stations. Short haul, high density regions become tremendously cluttered with the volume of service needed to serve them. These problems, combined with the difficulty of poor depiction of time and time dependent relationships such as crossovers, make route maps poor candidates for primary schedule development tools.
Route maps do have some valuable functions, however. They provide a quick and easy way to grasp an overview of the network geography and link patterns. They can also be used to display numerical data about each individual link or market. These provide valuable reference data to schedulers during
schedule development. In addition to frequency, route maps can be labeled with
costs, fares, origin-destination traffic, on board traffic, distances or block times.
Schedule Map
Schedule maps (see Figure 3-3) are the most basic representation of the
schedule puzzle. They preserve all of the important information about the
schedule while simplifying the representation tremendously. They are often used by schedulers for small networks; however, as we will see, they become cumber-some for larger networks.
The projection of a three dimensional schedule space must be perpendicular
to the time axis, however, it may be done parallel to either the north/south or
east/west axis. In fact, any intermediate axis would also be satisfactory. This arbitrary axis will be labeled the S (for space) axis.
However, an immediate problem with any of these projections can be recognized. Stations will be located on the S-axis with varying spacing. Some stations may even overlap or be excessively far apart thereby wasting space on what will likely be a very large chart already.
This problem is usually solved by mapping, rather than simply projecting
each station onto the axis stations are placed at equal distances along the S-axis. The width of each station is varied to permit the necessary number of
sequence lines to pass through them without overlapping. This width, in fact,
corresponds directly to the number of gates available at each station (see below).
EST 7:00 8:00 9:00 10:00 w 2 11:00 12:00 13:00 14:00 15:00
north to south, or they may be rearranged in any convenient order. For example, if one routing is flown frequently, the stations in this routing may be shown
adjacent to one another. The only information lost here is the actual distance between stations and the direction of each segment. Distance information can be inferred from the block time of a segment. Directional information, meaning
whether the aircraft is flying north, south, east or west, is of interest in determining the circuity of a flight, but it is not difficult to refer back to a route map for this information.
The sequence lines are often labeled with additional data to enhance the value of the chart. Arrival and departure time may be shown next to these operations since reading directly from the time axis is somewhat inaccurate. When this is done the hour is usually dropped and only the minutes past the hour shown, since the time axis is sufficient to infer the hour. Flight numbers, traffic, cost or other information can be indicated along each segment line.
The value of a schedule map is that it depicts the pieces of the schedule puzzle in both time and space dimensions. Relationships between flights such as turns and crossovers are readily seen. Patterns of service can be inferred directly by noting the number and times of flights linking two stations. Through service is also depicted because flight sequence lines are drawn as continuous space-time lines on the chart. The problem of overlapping lines is not as severe since two services in a single market are unlikely to occur at the same time, and stations can be represented not as single locations but as a set of "gates".
No matter how the stations are arranged, some routings will join stations that are separated by one or more intervening stations on the s-axis. The lines
connecting these stations must pass over the intervening stations and mingle with the nonstop segment lines in these markets. Flights that actually proceed on a very straight course providing good through service between two points, may be depicted by long lines that not only cross over many other stations, but may even reverse direction on the schedule map. The problem becomes quite severe when many sequences are shown simultaneously. The web of lines becomes so tangled
that these charts are often referred to as "spider charts". Sequences become
difficult to trace, service patterns in various markets become obscured and room for auxiliary information such as precise times and flight numbers is wiped out. Congestion is particularly acute at connecting banks. The schedule map shows so
much information at once that it can't all be drawn in one place.
Both two dimensional representations of a schedule suffer from this problem. Too much information is compacted on one piece of paper resulting in confusion and loss of vital information. The solution lies in extracting or untangling this information. Four ways exist to extract one dimensional subsets of the schedule map that are often far more convenient to use.
3.1.2 Cross-Section Views of Schedule Maps
Schedule maps can be cut or cross-sectioned along either the time axis or the s-axis. A cross-section at a single point in time provides very little visual information but does serve to count aircraft. Cross-sections of the s-axis can be made either at a single station, producing a station activity or ramp chart, or
Aircraft Count
Sequences must be continuous descriptions of the activity of a single
aircraft. All flights arriving at a station either turn to subsequent flights or
remain at that station until the end of the schedule period. Similarly, all flights departing a station must turn from a prior flight or must have been located at that station since the beginning of the period.
When the schedule map is cut at a single time across the entire network, all sequences will be found to be either enroute or on the ground at one of the stations. The number of sequence lines crossing any time cross section must be identical for any time chosen. This sum is the number of aircraft needed to fly this schedule.
This is, of course, a valuable procedure, but very little information is retained by this cross section of limited value in the entire schedule development process. Events may occur continuously through time and thus an infinite number
of those cross sections would theoretically be needed to represent the entire
schedule.
Station and Market Profiles
In contrast to the continuity of the time dimension, the space dimension
consists of a finite number of discrete stations and markets. This makes cross sections along these discrete spacial elements far more valuable as schedule development tools.
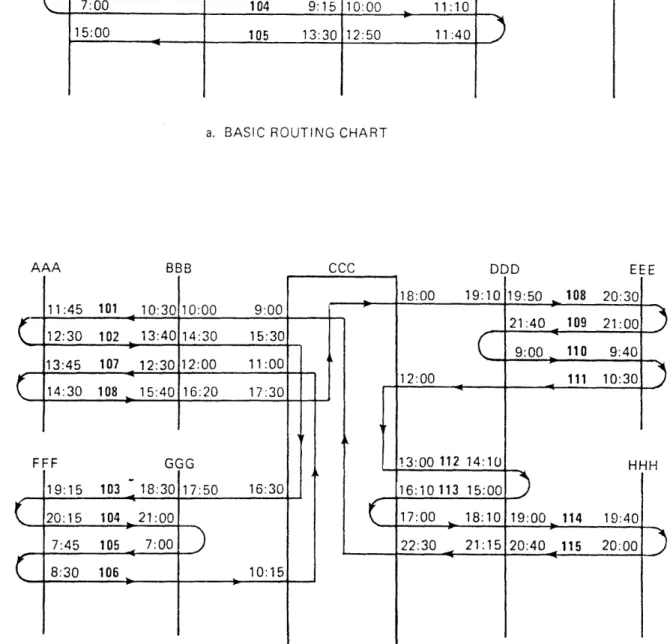
Figure 3-4a shows a basic station activity chart. Each event, arrival or departure, is labeled with the number of the flight involved. When charts for each station are used together the complete schedule can be represented.
Many of the difficulties of the schedule map are eliminated in this representation. The confusion of criss-crossing lines is eliminated. The routings
of individual flights may still be traced through the flight number labels, although
this is clearly more cumbersome. The labels on each arrival and departure can include the upline and downline itineraries, respectively. This addition makes the
tracing of flights through the system feasible.
Overlapping still occurs in both the time and space dimensions on the
station activity chart. Many flights may arrive or depart at nearly the same time,
making the chart difficult to draw. To solve this problem, clusters of arrivals and
departures can be mapped to equidistant locations on the time axis and then
actual operation times can be shown. In the space dimension, because it is only a
single point, all events occuring simultaneously at that location overlap. This
problem can be alleviated by expanding the cross section from a single station to a collection of gates. Each flight sequence is assigned to a gate and remains
there until its departure. No two flights can occupy a gate location simul-taneously, thereby eliminating any overlap.
Figure 3-4b shows a fully labeled station activity chart with gates. It is evident that this is a much more valuable tool than the simple version in Figure
3-4a. In this chart it is possible to trace not only flight routings thorugh the itinerary tables, but also to see turns occuring at the station. Possible crossovers
AAA 101 t-102 - 0 L 103
--105 106 BBB CCC 1( XXX YYY 1 101 -o 102 ,--*.---o. 104 DDD CCC 1( XXX YYY 1( -I F106 105 101 DDD 102 NNN 04 EEE FFF 107 NNN 105 PPP
a. BASIC STATION ACTI\ TY
:35 -.20 :00 :451 LU -C o .O 0 0 :55
-1;_
c
:55
-
_
c. RAMP CHARTb. EXPANDED STATION ACTIVITY
3 4 p 0 :20 :20 :40 :35 :55 :00 :20 :45 :55 d. ACTIVITY PROFILE FIGURE 3-4
Station Activity Representations
a. n 10:00 11:00 12:00 Z.Uu 10:00 11:00 12:00 I 0.UU r r . 1( A At' :U ' T n nn .n
can be readily found on this diagram by looking for flights with compatible
operating times.
It should be noted that these charts are not very efficient in terms of the area needed to represent them. Itineraries and flight numbers must be repeated
at each station that a flight uses, and the turn information is represented by a
multitude of lines at each station which would be avoided if flight itineraries were shown strung together on a single line. This concept will be discussed in the next
section.
Another version of the station profile is shown in Figure 3-4c. This is known as a ramp chart. Upline and downline itineraries are dropped, but the representation of gates is retained. Flight numbers still provide a means of
tracing the flight's itinerary. In addition, the times needed for maneuvering to
the gate and for the deplaning, enplaning, and cabin cleaning activities are each indicated separately from any slack, or unused time on the aircraft.
Ramp charts are useful in isolating the problems of gate and station charts
are useful in isolating the problems of gate and station facilities utilization. Periods of peak activity can be spotted readily. In addition, maintenance scheduling can be done using this chart to determine when and if a piece of equipment is at a maintenance base for a sufficient period to permit necessary
maintenance to be performed.
Another important application of the ramp chart is for determining
coverage. The slack periods on each of the aircraft can be integrated to produce a discrete function over time (see Figure 3-4d) of the number of free aircraft on
the ramp known as a station activity profile. This function known as the incremental count. The function is increased by one for each arrival and decreased for each departure of the same equipment type. This function reveals a number of interesting things about the schedule. First of all, while the function is non-zero, at least one aircraft is always sitting on the ground unused. This situation may be planned so that one aircraft will always be available to take over for, or "cover", a malfunctioning one. When the function stays above any number for an extended period of time, this many aircraft are always available. It may be desirable to use these extra aircraft. Note that, depending on how the physical equipment is actually turned, these "aircraft" may be composed of different individual pieces of equipment. By returning some flights the actual aircraft can be freed during this period.
When an aircraft is available for an extended continuous period except for a short interruption, this will be seen as a small trough in the function. A minor change in scheduled flight times could close this gap and free an aircraft for additional flights or reduce the minimum number of aircraft of this type required to fly the schedule.