Supplementary Material
Doped barium cerate perovskite catalysts for simultaneous NOx
storage and soot oxidation
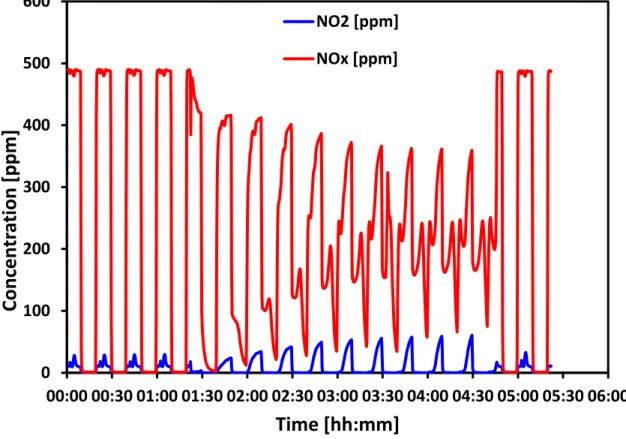
Fig. S1 NOx concentration versus time for BaCe0.8Zr0.1Co0.1O3 at 380°C for consecutive NOx
storage/reduction cycles. The samples were pretreated at 400°C for 0.5 h under a nitrogen flow of 500 mL min-1. During the storage cycle (10 min) the gas composition was 500 ppm NO, 10 vol. % O
2, 5 vol. %
H2O balance nitrogen. For the reduction cycle (10 min) the gas composition was 10 vol. % H2, 5 vol. %
H2O balance nitrogen. The gas flow for both cycles was 500 mL min-1. The effluent gas was analyzed
using an MKS Multi Gas 2030 FTIR analyzer.
The first 4 storage/reduction cycles in Fig. S1 show the NO2 and NOx concentration as a function of time.
These data were generated by allowing the gas feed to be directed to the MKS FTIR analyzer via a by-pass valve. The gases in these cycles did not interact with the catalyst. The data show that the NOx
concentration was ~500 ppm. The presence of a small amount of NO2 was due to the oxidation of NO in
the feed gas by oxygen, also present in the feed gas. The gas feed was then introduced to the catalyst and the resulting NO2 and NOx concentrations for storage/reduction cycles are shown in the subsequent
10 cycles. The data show a significant drop in NOx concentration during the storage cycle and is ascribed
to storage on the catalyst. The data also reveal an NO2 concentration of ~50 ppm during the storage
0
100
200
300
400
500
600
00:00 00:30 01:00 01:30 02:00 02:30 03:00 03:30 04:00 04:30 05:00 05:30 06:00
Conc
en
tr
at
ion
[ppm]
Time [hh:mm]
NO2 [ppm]
NOx [ppm]
cycles. This suggests that the catalyst is producing NO2 as well as storing NOx. The storage capacity of
the catalyst was calculated on the 10th storage cycle by integrating the area under the curve. For the
last three storage/reduction cycles the feed gas was again fed directly to the MKS FTIR analyzer via the by-pass valve. The data show that the concentration of NOx was the same as at the beginning of the
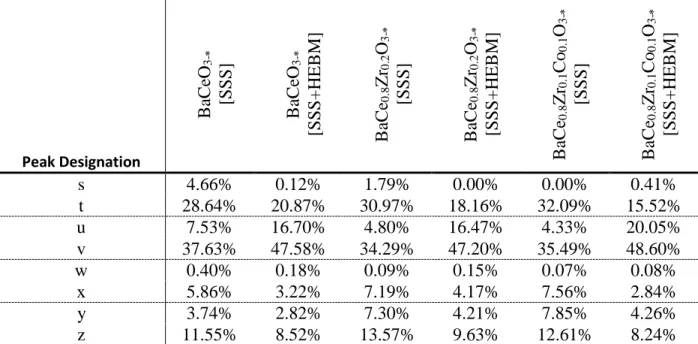
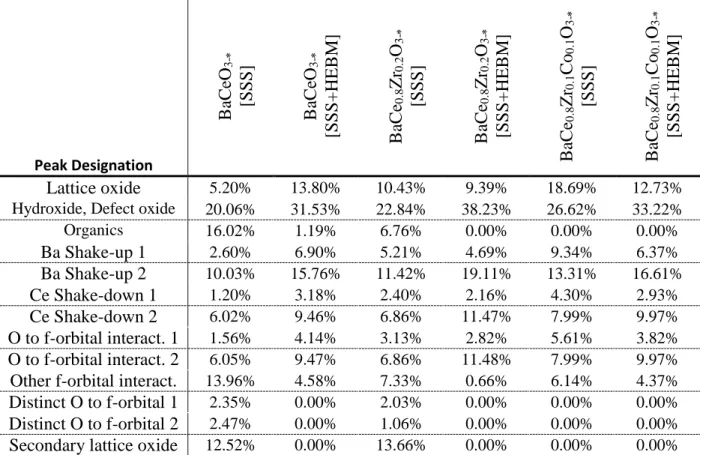
Table S1 through S3 show the chemical breakdown of the XPS spectra for each key atom present.
Table S1: The chemical breakdown of the barium spectra, by sample.
Peak Designation
B
aC
eO
3 -[SS
S
]
B
aC
eO
3 -[SS
S
+
HE
B
M]
B
aC
e
0.8Zr
0 .2O
3 -[SS
S
]
B
aC
e
0.8Zr
0 .2O
3 -[SS
S
+
HE
B
M]
B
aC
e
0.8Zr
0 .1Co
0 .1O
3 -[SS
S
]
B
aC
e
0.8Zr
0 .1Co
0 .1O
3 -[SS
S
+
HE
B
M]
a
10.15%
4.29%
6.12%
9.71%
7.53%
13.05%
a’
6.81%
2.88%
4.11%
6.15%
5.05%
8.75%
b
9.38%
17.63%
13.91%
14.47%
13.23%
10.67%
b’
6.29%
11.82%
9.33%
9.70%
6.87%
7.15%
c
10.03%
16.61%
9.67%
14.16%
10.50%
16.06%
c’
6.72%
11.14%
6.48%
9.49%
7.04%
10.77%
d
4.41%
3.86%
7.81%
6.96%
5.74%
6.65%
e
27.21%
17.88%
26.42%
16.28%
25.71%
7.80%
f
18.97%
13.88%
16.15%
12.49%
16.22%
18.74%
g
0.03%
0.02%
0.00%
0.23%
0.10%
0.37%
Table S2: The chemical breakdown of the cerium spectra, by sample.
Peak Designation
B
aC
eO
3 -[SS
S
]
B
aC
eO
3 -[SS
S
+
HE
B
M]
B
aC
e
0.8Zr
0 .2O
3 -[SS
S
]
B
aC
e
0.8Zr
0 .2O
3 -[SS
S
+
HE
B
M]
B
aC
e
0.8Zr
0 .1Co
0 .1O
3 -[SS
S
]
B
aC
e
0.8Zr
0 .1Co
0 .1O
3 -[SS
S
+
HE
B
M]
s
4.66%
0.12%
1.79%
0.00%
0.00%
0.41%
t
28.64%
20.87%
30.97%
18.16%
32.09%
15.52%
u
7.53%
16.70%
4.80%
16.47%
4.33%
20.05%
v
37.63%
47.58%
34.29%
47.20%
35.49%
48.60%
w
0.40%
0.18%
0.09%
0.15%
0.07%
0.08%
x
5.86%
3.22%
7.19%
4.17%
7.56%
2.84%
y
3.74%
2.82%
7.30%
4.21%
7.85%
4.26%
z
11.55%
8.52%
13.57%
9.63%
12.61%
8.24%
Table S3: The chemical breakdown of the oxygen spectra, by sample. Peak Designation
B
aC
eO
3 -[SS
S
]
B
aC
eO
3 -[SS
S
+
HE
B
M]
B
aC
e
0.8Zr
0 .2O
3 -[SS
S
]
B
aC
e
0.8Zr
0 .2O
3 -[SS
S
+
HE
B
M]
B
aC
e
0.8Zr
0 .1Co
0 .1O
3 -[SS
S
]
B
aC
e
0.8Zr
0 .1Co
0 .1O
3 -[SS
S
+
HE
B
M]
Lattice oxide
5.20% 13.80% 10.43% 9.39% 18.69% 12.73%Hydroxide, Defect oxide 20.06% 31.53% 22.84% 38.23% 26.62% 33.22% Organics 16.02% 1.19% 6.76% 0.00% 0.00% 0.00%