Publisher’s version / Version de l'éditeur:
Compendium of Papers CD-ROM, TRB 85th Annual Meeting : January 22-26,
2006, Washington, D.C., 2006-01-22
READ THESE TERMS AND CONDITIONS CAREFULLY BEFORE USING THIS WEBSITE.
https://nrc-publications.canada.ca/eng/copyright
Vous avez des questions? Nous pouvons vous aider. Pour communiquer directement avec un auteur, consultez la première page de la revue dans laquelle son article a été publié afin de trouver ses coordonnées. Si vous n’arrivez pas à les repérer, communiquez avec nous à PublicationsArchive-ArchivesPublications@nrc-cnrc.gc.ca.
Questions? Contact the NRC Publications Archive team at
PublicationsArchive-ArchivesPublications@nrc-cnrc.gc.ca. If you wish to email the authors directly, please see the first page of the publication for their contact information.
NRC Publications Archive
Archives des publications du CNRC
This publication could be one of several versions: author’s original, accepted manuscript or the publisher’s version. / La version de cette publication peut être l’une des suivantes : la version prépublication de l’auteur, la version acceptée du manuscrit ou la version de l’éditeur.
Access and use of this website and the material on it are subject to the Terms and Conditions set forth at
Degradation of bituminous sealants due to extended heating before
installation: a case study
Masson, J-F.; Collins, P.; Woods, J. R.; Bundalo-Perc, S.; Al-Qadi, I. L.
https://publications-cnrc.canada.ca/fra/droits
L’accès à ce site Web et l’utilisation de son contenu sont assujettis aux conditions présentées dans le site LISEZ CES CONDITIONS ATTENTIVEMENT AVANT D’UTILISER CE SITE WEB.
NRC Publications Record / Notice d'Archives des publications de CNRC:
https://nrc-publications.canada.ca/eng/view/object/?id=c2e4ebf9-d052-40fe-9b73-3377a9315dd1 https://publications-cnrc.canada.ca/fra/voir/objet/?id=c2e4ebf9-d052-40fe-9b73-3377a9315dd1
http://irc.nrc-cnrc.gc.ca
De gra dat ion of bit um inous se a la nt s due
t o ex t e nde d he at ing be fore inst a llat ion: a
c a se st udy
N R C C - 4 7 3 1 6
M a s s o n , J - F . ; C o l l i n s , P . ; W o o d s ,
J . R . ; B u n d a l o - P e r c , S . ; A l - Q a d i ,
I . L .
A version of this document is published in / Une version de ce document se trouve dans:
85th Annual Meeting of the Transportation Research Board, Washington, D.C., Jan.22-26, 2006, CD-ROM Paper #06-0759, 18 pages.
Degradation of bituminous sealants due to extended heating before installation:
a case study*
J-F. Masson
Corresponding author
Institute for Research in Construction
National Research Council of Canada, Ottawa, ON, K1A 0R6, Canada. Tel. (613) 993-2144, Fax (613) 952-8102
E-mail: Jean-Francois.Masson@nrc-cnrc.gc.ca Peter Collins
Institute for Research in Construction
National Research Council of Canada, Ottawa, ON, K1A 0R6, Canada. Tel. (613) 993-9721, Fax (613) 952-8102
E-mail: Peter.Collins@nrc-cnrc.gc.ca John R. Woods
Institute for Chemical Process and Environmental Technology
National Research Council of Canada, Ottawa, ON, K1A 0R6, Canada. Tel. (613) 993-2520, Fax (613) 991-2384
E-mail: John.R.Woods@nrc-cnrc.gc.ca Slađana Bundalo-Perc
Institute for Research in Construction
National Research Council of Canada, Ottawa, ON, K1A 0R6, Canada. Tel. (613) 993-3766, Fax (613) 952-8102
E-mail: Sladana.Bundalo-Perc@nrc-cnrc.gc.ca Imad L. Al-Qadi
Founder Professor of Engineering
Advanced Transporation Research and Engineering Laboratory, Director University of Illinois at Urbana-Champaign
205 N Mathews Ave., MC-250, Urbana, IL 61801 Email: alqadi@uiuc.edu
Paper 06-0759, 85th Annual Meeting of the Transportation Research Board (2006), Washington, D.C., Jan 22-26, 2006.
Degradation of bituminous sealants due to extended heating before installation: a
case study
J-F. Masson, Peter Collins, Slađana Bundalo-Perc, John R. Woods, Imad Al-Qadi ABSTRACT :
Bituminous sealants are applied to cracks and joints in pavements, bridges and other civil engineering structures. The sealants are generally applied at 180°C to 200°C, a temperature at which the sealant can degrade. In an effort to better understand the effect of installation on sealant properties, a sealant was collected at regular interval during its installation and analyzed by gel permeation chromatography (GPC), Fourier-transform infrared spectroscopy (FTIR), thermogravimetry (TG), and dynamic shear rheometry (DSR). The analysis of the aged sealants showed that the sealant was in its most degraded state early in the morning due to long pre-installation heating times around 150°C, which caused non-oxidative degradation. The degradation occurred at temperatures below the recommended installation temperatures. The
degradation led to sealant stiffening, which was found to arise from a change in polymer structure, and from a loss in bitumen and polymer contents. This loss of organic material led to a relative increase in filler content. It is concluded that sealant preparation conditions, prior to installation, should be better controlled to optimize sealant performance.
INTRODUCTION
Bituminous sealants are applied to joints and cracks to prevent the ingress of water, brine and
incompressible materials into the pavement structure and thereby extend its service life (1). These sealants, sometimes called hot-poured sealants, are installed at temperatures commonly between 180°C and 200°C, a temperature at which they flow easily into cracks and joints (2, 3). Extended heating at suggested
temperatures, or overheating, can lead to degradation (4).
The extent and the mechanism of sealant degradation during installation has not been the subject of detailed investigations. After collecting one sealant sample during installation, Oba and Partl (5) found an increase in sealant modulus and a decrease in polymer content, but the sample thermal history was not detailed. A laboratory study (4), where sealants were heated in an oil bath for up to 6 h showed that sealant viscosity decreased over time, possibly due to polymer degradation. The effect on sealant modulus was material dependent, with an increase in some cases, and a decrease in others. The laboratory aging conditions, however, were not totally representative of field conditions. Sealant in the small kettle was not removed and replenished as in the field, and the sealant mass was about 500g. Hence the diffusion of oxygen in the sealant and the extent of oxidation may not have been truly representative of the field conditions. Manufacturer specifications may mention gelation as a result of heating beyond the suggested application temperature, but details are rarely, if ever, provided. Consequently, the effect of sealant installation on sealant characteristics and performance remains uncertain in many respects.
The aim of this paper is to provide a better understanding of the aging mechanism of sealants during installation, its effect on sealant rheology, and in particular, highlight the effect of extended heating at moderate temperatures (i.e. 140°C) during installation. For this purpose, a sealant was collected at regular intervals throughout its installation and analyzed by gel permeation chromatography (GPC), Fourier-transform infrared spectroscopy (FTIR), thermogravimetry (TG), and dynamic shear rheometry (DSR). Before a discussion of the results, however, a brief review of these methods is helpful.
BACKGROUND: PHYSICO-CHEMICAL AND RHEOLOGICAL ANALYSIS
Bituminous sealants are mixtures. They contain an asphalt binder, bitumen, as the main component and a rubbery material that can be a polymer or ground tire rubber (6). Sealants can also contain mineral filler, often calcium carbonate, and processing oils. Given this complexity, a number of methods must be used to properly characterize the aging process in sealants. In this study, GPC, FTIR, TG, and DSR were used. The principle and use of these methods is summarized in Table 1. To illustrate the use of these methods in
the analysis of sealants and help in the interpretation of the results from aged materials, it is helpful to characterize polymer and bitumen separately.
Table 1. Physico-chemical method of characterization
Method Output Use
GPC Separation of bitumen and
polymer
Quantify polymer; degradation rates and mechanisms
FTIR Fingerprint of composition Oxidation; identification of polymer and filler; semi-quantitative analysis; degradation mechanism
TG Weight loss upon heating Contents of filler and light, medium, and heavy hydrocarbon components
DSR Stiffness, relaxation Effect of temperature and aging on mechanical properties
SB-type block copolymers
The most common polymer in sealants is a styrene-butadiene (SB) copolymer (7). SB copolymers contain a polystyrene (PS) and a polybutadiene (PB) block, thus the name SB-diblock. These diblocks can be linked to (SB)n, where n is most often 2 to 4(8, 9). A most common copolymer is the SBS triblock
copolymer, where n=2, (SB)2≡ SB-BS ≡ SBS. With n>2, the structure is that of an n-arm star. Figure 1
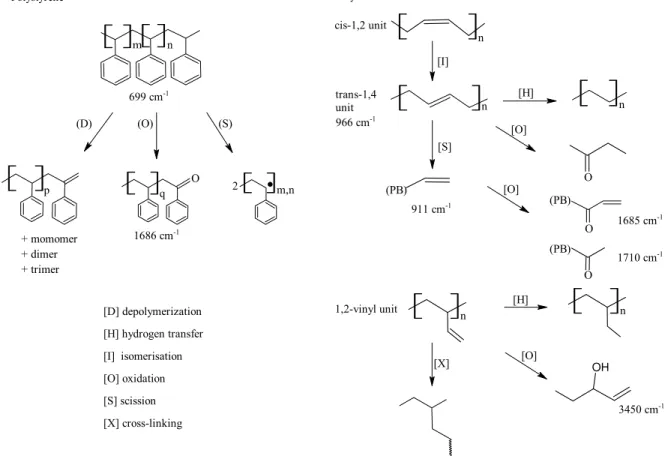
shows a bead model of styrene-butadiene copolymers, whereas Figure 2 shows detailed chemical structures and the effect of various reactions on these structures (7). The water soluble random SB copolymers, called styrene-butadiene rubbers (SBR), are found in some polymer modified bituminous emulsions, whereas the thermoplastic diblock and triblock copolymers are found in sealants and asphalt concrete binders. GPC
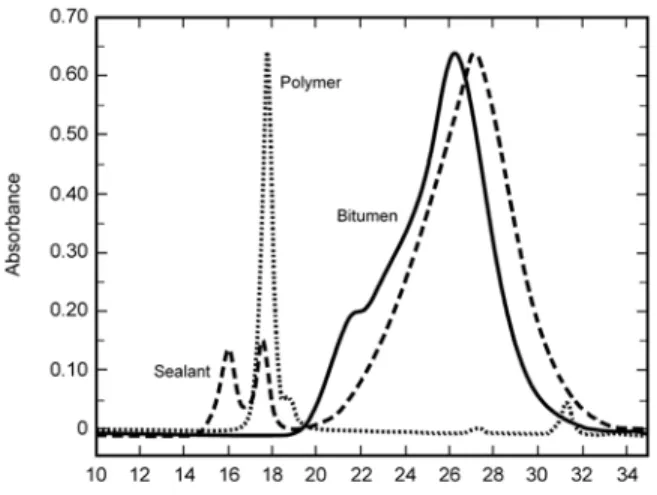
Gel permeation chromatography (GPC) separates molecules according to their size by eluting a solution of a mixture through a column filled with a gel. The process is similar to the separation of aggregates passing through several sieves of different sizes. In GPC, the larger molecules exit the column first and the smallest molecules exit last. The typical GPC result is thus an intensity-time plot, the column exit time being inversely proportional to the logarithm of the molecular size. Figure 3 shows results for a bitumen, an SBS copolymer and a bituminous sealant. Due to its higher molecular weight, from about 1.5 Mg/mol to 100 kg/mol, the copolymer shows a peak at earlier times than bitumen. A small shoulder on the right side of the SBS peak shows a residual content of SB diblock. Bitumen, which shows as a broad and intense peak at longer times, has molecular weights of about 300 to 1200 g/mol. Its molecular weight is thus 100 to >1M times smaller than that of the polymer. For the sealant in Figure 3, the GPC results show, from left to right, peaks for (SB)3, (SB)2 and bitumen.
Given that GPC allows for measuring molecular sizes, the method helps determine the aging mechanism. Figure 4 illustrates, for instance, the effect of scission and cross-linking on molecular size.
FTIR
Infrared (IR) spectroscopy is used to determine the types of chemical bonds in a molecule or a group of molecules in a mixture. The atoms in a molecule always vibrate. They stretch, bend, and twist. When IR radiation goes through a molecule, the frequencies that correspond to the various vibrations of the chemical bonds are absorbed. The collection of absorbed vibrations is called a spectrum (pl. spectra), with the intensity of the IR absorbance being proportional to concentration. The wavelength of the various absorbances in bitumen, polybutadiene and polystyrene can be used to identify these components in bituminous materials. The Fourier transform is a numerical treatment that allows for the rapid
measurement of the absorbed frequencies, hence the term Fourier-transform infrared spectroscopy (FTIR).
Figure 5 shows FTIR spectra between 1100 and 600 cm-1 for a sealant and its most important components, bitumen and the polystyrene (PS) and polybutadiene (PB) blocks of the SB copolymer. The absorbances from bitumen show little overlap with those from the copolymer blocks. The absorbances for PS at 699 cm-1, and for PB at 966 cm-1 and 911 cm-1, respectively from the trans-1,4 and the 1,2-vinyl units in Figure 2, can provide independent measures of change in the polymer due to aging. Table 2 provides a list of band ratios that allow for monitoring changes in the sealants due to heating and installation. The 873 cm-1
absorbance arises from the calcium carbonate filler (6), which serves as an internal standard. The 1700 cm
-1
and 1030 cm-1 absorbances respectively arise from carbon and sulfur oxidation (10).
Table 2. Infrared absorbance ratios for the characterization of aging in sealants
Ratio Characterization
A1030/A873 Oxidation in bitumen
A1700/A873 Oxidation in bitumen or polymer
A966/A873 Change in copolymer PB content
A699/A873 Change in copolymer PS content
A966/ A 699 Change in copolymer PB/PS ratio
A966/ A 911 Change in copolymer PB structure
TG
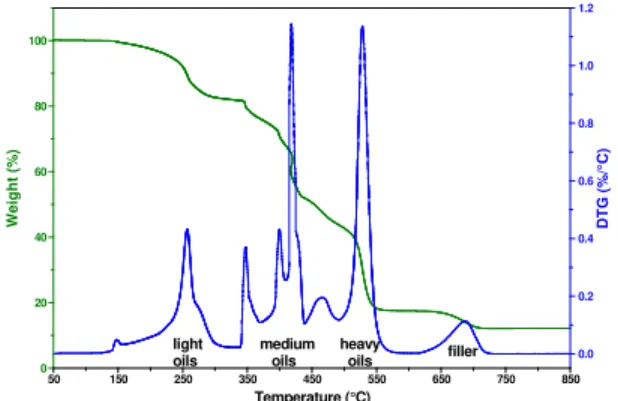
Thermogravimetry (TG) is a method of controlled combustion that allows for measuring the temperature at which a material turns into ashes and gases. This transformation is usually a cascade of mass loss. Figure 6 shows a mass loss curve and its derivative (DTG) for a sealant. The DTG curve shows four regions of mass loss: light, medium and heavy oils at 50-350°C, 350-500°C, and 500-600°C, and mineral filler (typically limestone) at 600-750°C. The standard deviation on mass loss is typically 2.5% by weight or better (11). This method is thus precise enough to determine a loss of material upon aging, if any, which may occur either through evaporation, or through oxidation of heavier oils followed by degradation and evaporation of lighter degradation by-products. Typically, the filler, non-volatile and inert, serves as internal standard and the results are expressed in terms of oil/filler ratio.
DSR
Dynamic Shear Rheometry is the method with which pavement engineers are most familiar. The stress-relaxation experiment, or creep-recovery, at fixed temperature is simple and allows for mimicking the concept of crack movement (Figure 7). The initial application of a shear stress is related to the opening of a crack, which strains the sealant. When temperature is constant and the crack opening is fixed stress relaxation occurs. The difference between the initial and final strain is the permanent deformation. The effect of aging, and its associated chemistry, on the mechanical properties of sealants can thus be assessed with this method.
With this background on sealant raw materials and physico-chemical analysis, the interpretation of the results from aged and unaged sealants will be facilitated.
EXPERIMENTAL Sealant collection
Sealant P was collected during a rout-and-seal operation on asphalt concrete. The sealant met the MTQ4401 specification, which is a Quebec modification of the ASTM D3405. The manufacturer specification indicated that the sealant could be reheated. For installation, the sealant was heated in a 1500L kettle with a rapid circumferential stirring of 25 rpm. The sealant temperature during installation was 150 to 182°C and the sealant volume in the kettle was 40 to 90% of the kettle volume (12). The suggested application temperature was 190-195°C. The virgin (as-received) sealant was collected, along with materials poured into cracks. About 1 kg of heated sealant was collected every hour from 0 to 6 h after the contractor started the work. The virgin material was labeled Pv (or Pvh after remixing in
accordance with ASTM D5167), and the samples collected in the field during installation were labeled Pk0 to Pk6, where k stood for “kettled” and the 0 to 6 for the time after the start of installation.
Methods
To determine the exact process through which sealants age during installation, sealants and typical sealant components were analyzed by GPC, FTIR, TG, and DSR. The experimental details of the GPC, FTIR, and TG methods are respectively found in (13,6, 11). The effect of ageing on the mechanical properties was measured by DSR at –22°C after 10 min of creep under 20 Pa of shear, followed by 20 min of recovery.
RESULTS AND DISCUSSION Heating history
Sealant P had a long thermal history prior to its installation. After on-site inspection and discussions with the contractor, it was estimated that the sealant had been heated for 10h at an average temperature of about 150°C. The kettle had first been filled to 60% of its capacity and the sealant heated for about 3h when the work was postponed until the next day because of torrential rain that kept the cracks moist the entire day. Given that the sealant could be reheated, the sealant was reheated in a similar manner the next day, but the work was again postponed, this time due to pavement temperature above 40°C. That was the limit beyond which the local transportation authorities did not allow crack sealing due to the excessively long sealant cooling times at such temperatures and the risk of sealant tracking. On the third day, the sealant was heated for a third time and finally installed, with regular replenishing of the kettle with fresh sealant during the workday.
The observed heating conditions provided a snapshot of the state-of-the-practice and not necessarily the state-of-the-art, which requires that each day begin with an empty kettle and that little sealant be reheated (2). Two reasons explain why the state-of-the-art was circumvented: a) the manufacturer’s sealant specification indicated that the sealant could be reheated, and b) the sealant in the kettle at the end of a day would have had to be discarded according to the local hazardous waste regulations. Hence, there was little incentive for the contractor not to reheat the sealant, and the site inspector had no data to judge of the effect of sealant reheating and enforce the state-of-the-art.
Sealant thermal degradation during installation GPC
The effect of installation on the polymer in sealant P as obtained by GPC is shown in Figure 8, where for a proper view of the overlapping curves, the polymer peaks are shown without the bitumen response. The virgin homogenized material (Pvh) showed two polymer peaks, A and C, which corresponded to molecular weights of about 420 kg/mol and 140 kg/mol.
The long thermal history of the sample had a very large effect on the polymer in the virgin sealant. This was readily seen by a comparison of the GPC signals for Pvh and Pk0. The latter was poured when the contractor started the work early in the morning. In Pk0, peak A had disappeared completely and peak C had lost 80% of its intensity. The sealant showed two features absent in Pvh. A new peak (B) for a molecular weight of about 235 kg/mol and a rise in the background at 23.5 min for a molecular weight of 70 kg/mol at D, which is better seen in the full chromatogram in Figure 9. Given the molecular weights at A, B, C and D, each of these peaks may be assigned to (SB)n, with respective n values of 6, 3, 2 and 1. The
degradation process in going from Pvh to Pk0 thus appears to be a loss in molecular weight due to polymer chains scissions:
A to B: (SB)6→ 2 (SB)3
C to D: (SB)2 → 2 SB
It is noteworthy that the loss in peak C was much greater than the rise in peak D (Figure 8). This may be explained by a net loss in polymer, which was consistent with the loss of signal from bitumen in going from Pvh to Pk0 (Figure 9).
The above changes occurred before the sealant was installed. During installation (Pk0 to Pk6), there was a loss in peak B and a rise in peak C. In other words, the GPC trace became increasingly closer to the signal provided by Pvh. As might have been expected, this indicated that as the work progressed, the sealant with a long thermal history was pumped out of the melter and progressively replaced by fresh sealant with undegraded copolymer. Never in the day, however, did the sealant contain undegraded copolymer. Hence, the installed sealant was always aged, sometimes very significantly.
TG
Figure 10 summarizes the TG results as obtained from measurements like those in Figure 6. The trends in
Figure 10 show the ratio of light, medium and heavy fractions against the filler content. In accordance with the degradation measured by GPC, TG results for sealants Pk6 and Pvh were placed near each other. The trend for all the fractions were identical, the organic/filler ratio decreased with aging in going right to left in
Figure 10. This demonstrates that aging caused a loss of material in the sealant, which was consistent with the net loss of polymer and bitumen observed by GPC. The effect was a relative increase in filler content with aging, which would be expected to increase sealant modulus. Interestingly, the very close trend between the light and heavy fractions demonstrated that light oils were not preferentially lost during installation, and that there was a general loss of matter upon ageing, contrary to what might have been expected. This loss of material helps explain the fuming of sealant during installation.
FTIR
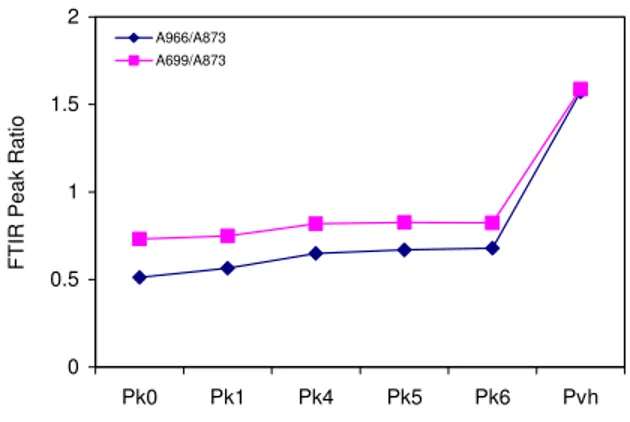
FTIR spectra for sealants Pvh and Pk0 are shown in Figure 11. The first sealant is unaged, and the other is the most aged. In accordance with GPC, aging caused a loss of polymer, visible with FTIR as a decrease in the absorbances at 966 cm-1 and 699 cm-1, for the copolymer PB and PS blocks, respectively. The effect of aging on the two polymer blocks in all the aged sealants is shown in Figure 12. As the day progressed and fresh sealant was added to the kettle, the polymer content in the sealant increased. In other words, the A966/A873 and A699/A873 ratios increased. It must be emphasized, however, that near the end of the day, the
polymer concentration in the sealant was still only half of that in the unaged sealant, as seen by a comparison of the FTIR ratios for Pk6 and Pvh (Figure 12).
The long thermal history thus had a marked effect on the polymer in the sealant. In contrast, it had relatively little effect on the bitumen portion of the sealant (Figure 11), and most noteworthy is the absence of oxidation bands at 1030 cm-1 for oxidized sulfur and around 1700 cm-1 for oxidized carbon. This is an important finding. It demonstrates that oxidation of the hot-poured sealant does not occur in the sealant reservoir and that the observed degradations are non-oxidative, in contrast to binder oxidation during the laying of pavements (10).
FTIR further revealed changes in the structure of the PB block of the polymer upon aging of the sealant. The PB block contains cis- and trans-1,4 units in addition to 1,2-vinyl units on a side chain, each with a different infrared absorbance. In the absence of oxidation, the possible reactions are hydrogen transfer, scission and cross-linking (Figure 2). GPC did not show an increase in molecular weight so cross-linking must be low, if it occurs at all. The scission of the trans-1,4 units would lead to a terminal double bond with an IR absorbance at 911 cm-1 that would overlap with that of the 1,2-vinyl unit also at 911 cm-1. Hence, PB chain scission upon aging would be visible as a decrease in A966/A911, the ratio of the
absorbances at 966 cm-1 and 911 cm-1. The result of sealant installation on this ratio is shown in Figure 13. As sealant aging increases, from right to left, the A966/A911 ratio does decrease, which demonstrates that PB
does degrade through the scission of its main chain. The change in PB between Pk0 and Pvh was about 12%.
Given the scission of PB segments, a 30% decrease in the PB/PS ratio was also measured upon aging, i.e., (A966/A699) (Figure 13). Given that the PS block is stiffer than the PB block due to the differences in glass
transition temperatures (14), the change in PB/PS ratio would be expected to promote sealant stiffening. DSR
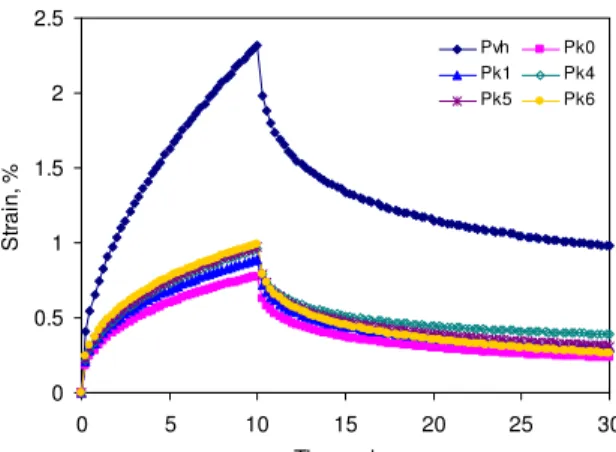
Physico-chemical analysis of the aged sealants suggested that the stiffness of the sealant would increase as it ages, firstly because of an increase in filler content, secondly because of a loss of polymer, and thirdly because of a change of PB/PS ratio in the copolymer. The DSR results confirmed the stiffening of the sealant with increased aging (Figure 14). The strain and the relaxation in the unaged Pvh was relatively high before it decreased to the lowest measured values in Pk0, after the sealant had been heated for long times. As fresh material was added to the melter, the final strain increased regularly, but it never attained the level of the unaged sealant. This is best seen in Figure 15. The progression in the strain was strikingly similar to the change in PS and PB contents upon aging (Figure 12), and in fact the correlation between the FTIR and DSR results was nearly perfect (Figure 16), which demonstrated that the strain capacity of sealant P was dictated by its copolymer content. In contrast, the sealant strain after relaxation was not
collinear with the strain after the creep, or polymer content (Figure 15), possibly because the sealant relaxation properties were also affected by the change in filler content and PB/PS ratio with aging. CONCLUSION
A bituminous sealant used for joint and crack sealing was collected at regular interval during its installation. The analysis of the aged sealant showed that it was in its most degraded state early in the morning due to a long pre-installation heating at moderate temperatures, about 40°C below the sealant recommended installation temperature. Despite the addition of fresh sealant to the sealant reservoir throughout the day, the applied sealant always contained a significant amount of degraded material. This translated into the application of a sealant that was always stiffer then the unaged sealant.
Aged sealants were analyzed by physico-chemical methods and the reason for sealant stiffening after aging was found to arise from a loss of polymer and bitumen, the result being a relative increase in filler content, and from an increase in the PS/PB ratio in the remaining SB copolymer. A reduction in molecular weight due to non-oxidative chain scission was also measured. The effect of this scission was to soften the sealant, but the overall increase in sealant stiffness indicated that this effect was not prevalent.
Finally, it may be concluded that in crack and joint sealing work with hot-poured bituminous sealants, the time and the temperature of the sealant should be tightly controlled not only during installation, but also prior to the start of the work.
REFERENCES
1. Chong, G. J. Rout and Seal Cracks in Flexible Pavement : A Cost-Effective Preventive Maintenance Procedure. Transportation Research Record 1268, TRB, Washington, DC, 1990, pp. 8-16.
2. Masson, J-F., S. Boudreau, C. Girard Guidelines for Sealing and Filling Cracks in Asphalt Concrete Pavement : A Best Practice. National Guide to Sustainable Municipal Infrastructure, National Research Council of Canada, 2003. Available from: http//www.infraguide.gc.ca/bestmunicipal.html.
3. Smith, K. L., A. R. Romine. Materials and Procedures for Sealing and Filling Cracks in Asphalt-Surface Pavements, Strategic Highway Research Program, National Research Council, Washington, DC, Report SHRP-H-348. Available at http://www4.trb.org/trb/onlinepubs.nsf/web/Highway_Operations_Reports. 4. Masson, J-F., C. Lauzier, P. Collins, and M. A. Lacasse, Sealant Degradation During Crack Sealing of Pavements. Journal of Materials in Civil Engineering, Vol. 10, No. 4, November1998, pp. 250-255. 5. Oba, K., and M. N. Partl. Application of Infra-Red Thermography for Studying Viscoelastic Behavior, Proc. 4th World Congress on Joint sealants and Bearing Systems for Concrete Structures, American Concrete Institute International, B. Atkinson Ed.,Vol. 2, pp. 1219-1230, 1996.
6. Masson, J-F., P. Collins, J. Margeson, and G. Polomark. Analysis of Bituminous Crack Sealants by Physicochemical Methods: Relationship to Field Performance. In Transportation Research Record 1795, TRB, National Research Council, Washington, D.C., 2002, pp. 33-39.
7. Masson, J-F., L. Pelletier, and P. Collins. Rapid FTIR Method for Quantification of Styrene-Butadiene Type Copolymers in Bitumen. Journal of Applied Polymer Science 79, 2001, pp. 1034-1041.
8. Legge, N. R. Rubber Chem. Technol. 1987, 60(3), G83-G117.
9. Harlan, J. T.; Petershagen, L. A.; Ewins, E. E.; Davies, G. A. Thermoplastic Rubbers (ABA Block Copolymers) in Adhesives. In Handbook of Adhesives, 3rd Ed. Skeist, I. Ed., Van Nostrand Reinhold: New York, 1990, 239-269.
10. Petersen, C. Quantitative functional group analysis of asphalts using differential infrared spectrometry and selective chemical reactions: theory and application. Transportation Research Record 1096, TRB, Washington, DC, 1986, pp. 1-11.
11. Masson, J-F. and S. Bundalo-Perc. Solventless Fingerprinting of Bituminous Materials: A High-Resolution Thermogravimetric Method. Thermochimica Acta, accepted for publication.
12. Masson, J-F., P. Collins, M. Lowery. Temperature control of hot-poured sealants during the sealing of pavement cracks. Construction and Building Materials Vol. 19, 2005, pp. 423-429.
13. Masson, J-F., P. Collins, G. Robertson, J. R. Woods, and J. Margeson, Thermodynamics, Phase Diagrams and Stability of Bitumen-Polymer Blends. Energy & Fuels Vol. 17, 2003, pp. 714-724. 14. Masson, J-F., S. Bundalo-Perc, A. Delgado. Glass Transitions and Mixed Phases in Block SBS. Journal of Applied Polymer Science B, Vol. 43, (2005), 276-279.
Figure 1. Bead model for random, diblock and triblock SB copolymers.
Polystyrene C H3 CH3 m n (D) (O) (S) C H3 CH2 p H3C CH2 q O m,n C H32.
+ momomer + dimer + trimer [D] depolymerization [H] hydrogen transfer [I] isomerisation [O] oxidation [S] scission [X] cross-linking Polybutadiene [I] cis-1,2 unitH3C CH3 n C H3 nCH3 trans-1,4 unit [H] C H3 CH3 n [O] CH3 C H3 O O [S] C H3 CH2 (PB) [O] C H3 CH2 CH2 (PB) O C H3 CH3 CH2 (PB) O CH3 C H3 CH2 n [H] CH3 C H3 CH3 n [O] C H3 CH2 OH C H3 CH3 CH3 [X] 1,2-vinyl unit 699 cm-1 1686 cm-1 966 cm-1 911 cm-1 1685 cm-1 1710 cm-1 3450 cm-1Figure 2. Structure and reactivity of polystyrene and polybutadiene units in SB
copolymers, and some infrared absorbances (8).
Figure 3. Typical GPC results for bitumen, an SBS copolymer and a sealant.
Molecular size and weight increase from right to left.
Figure 4. Illustration of the effect of scission and cross-linking on the size of the
copolymer.
0 0.2 0.4 0.6 0.8 1 1.2 1.4 1.6 600 700 800 900 1000 1100 Wavenumber, cm-1 A b sor b a n ce Bitumen Polybutadiene Polystyrene Sealant
Figure 5. FTIR spectra of a typical bituminous sealant and its generic components
between 1100 cm and 600 cm .
-1 -1 light oils medium oils heavy oils filler 0.0 0.2 0.4 0.6 0.8 1.0 1.2 DT G ( % /° C) 0 20 40 60 80 100 W e igh t (%) 50 150 250 350 450 550 650 750 850 Temperature (°C)Figure 6. Mass loss and DTG curves for a sealant by high resolution TG.
Time St ra in Stressing Relaxation crack opening stationary crack size permanent deformation
Figure 8. Polymer portion of the GPC from the virgin and kettle-aged sealant P.
The trace for Pk5 was removed for clarity.
Figure 9. Complete chromatograms for the virgin and kettle-aged sealant P. Peak
E is from bitumen.
0 1 2 3 4 5 Pk0 Pk1 Pk4 Pk5 Pk6 Pvh sealant P organic m a terial/filler ratio
light medium heavy
Figure 10. TG ratios for the light, medium and heavy bitumen fractions against the
filler content of sealant P.
600 800 1000 1200 1400 1600 1800 2000 Wavenumber, cm-1 Absorbance Pvh Pk0 PB PS
Figure 11. FTIR spectra for Pk0 and Pvh. The spectrum for Pk0 was shifted up for
clarity.
0 0.5 1 1.5 2 Pk0 Pk1 Pk4 Pk5 Pk6 Pvh
FTIR Peak Ratio
A966/A873 A699/A873
Figure 12. The change in ratio of characteristic FTIR peak absorbances for kettle
aged sealant P. Aging increases right to left. The legend is explained in Table 2.
0 1 2 3 4 5 Pk0 Pk1 Pk4 Pk5 Pk6 Pvh
FTIR Peak Ratio
A966/A699 A966/A911
Figure 13. The change in ratio of characteristic FTIR peak absorbances for kettle
aged sealant P. Aging increases right to left. The legend is explained in Table 2.
0 0.5 1 1.5 2 2.5 0 5 10 15 20 25 30 Time, min St ra in , % Pvh Pk0 Pk1 Pk4 Pk5 Pk6
Figure 14. DSR creep–recovery curves for sealant P at –22°C after kettle ageing.
0 0.5 1 1.5 2 2.5 Pk0 Pk1 Pk4 Pk5 Pk6 Pvh St ra in , % 0 10 20 30 40 50 P er m ane nt def or m at ion, % Strain % Permanent deformation
Figure 15. Percent strain and permanent deformation in sealant P due to
installation. Ageing increases right to left.
R2 = 0.9997 0 0.5 1 1.5 2 2.5 0.6 0.8 1 1.2 1.4 1.6
FTIR Peak Ratio A699/A873
St
ra
in
, %