Publisher’s version / Version de l'éditeur:
Vous avez des questions? Nous pouvons vous aider. Pour communiquer directement avec un auteur, consultez la première page de la revue dans laquelle son article a été publié afin de trouver ses coordonnées. Si vous n’arrivez Questions? Contact the NRC Publications Archive team at
PublicationsArchive-ArchivesPublications@nrc-cnrc.gc.ca. If you wish to email the authors directly, please see the first page of the publication for their contact information.
https://publications-cnrc.canada.ca/fra/droits
L’accès à ce site Web et l’utilisation de son contenu sont assujettis aux conditions présentées dans le site
LISEZ CES CONDITIONS ATTENTIVEMENT AVANT D’UTILISER CE SITE WEB.
Client Report (National Research Council of Canada. Institute for Research in
Construction), 2009-11-02
READ THESE TERMS AND CONDITIONS CAREFULLY BEFORE USING THIS WEBSITE. https://nrc-publications.canada.ca/eng/copyright
NRC Publications Archive Record / Notice des Archives des publications du CNRC :
https://nrc-publications.canada.ca/eng/view/object/?id=34924b02-c935-404f-b884-24e82bd982ec https://publications-cnrc.canada.ca/fra/voir/objet/?id=34924b02-c935-404f-b884-24e82bd982ec
NRC Publications Archive
Archives des publications du CNRC
For the publisher’s version, please access the DOI link below./ Pour consulter la version de l’éditeur, utilisez le lien DOI ci-dessous.
https://doi.org/10.4224/20375005
Access and use of this website and the material on it are subject to the Terms and Conditions set forth at
Assessment of the Impact of a Natural Gas Fireplace on Heating
Energy Consumption and Room Temperatures at the Canadian Centre
for Housing Technology
ASSESSMENT OF THE IMPACT OF A NATURAL GAS FIREPLACE
ON HEATING ENERGY CONSUMPTION AND ROOM TEMPERATURES
AT THE CANADIAN CENTRE FOR HOUSING TECHNOLOGY
Contract: B-6039
Armstrong M.M., Swinton, M.C. and Szadkowski, F.
The Canadian Centre for Housing Technology (CCHT)
Built in 1998, the Canadian Centre for Housing Technology (CCHT) is jointly operated by the National Research Council, Natural Resources Canada, and Canada Mortgage and Housing Corporation. CCHT's mission is to accelerate the development of new technologies and their acceptance in the marketplace.
The Canadian Centre for Housing Technology features twin research houses to evaluate the whole-house performance of new technologies in side-by-side testing. The twin houses offer an intensively monitored real-world environment with simulated occupancy to assess the performance of the residential energy technologies in secure premises. This facility was designed to provide a stepping-stone for manufacturers and developers to test innovative technologies prior to full field trials in occupied houses.
As well, CCHT has an information centre, the InfoCentre, which features a showroom, high-tech meeting room, and the CMHC award winning FlexHouse™ design, shown at CCHT as a demo home. The InfoCentre also features functioning state-of-the art equipment, and demo solar photovoltaic panels. There are over 50 meetings and tours at CCHT annually, with presentations and visits occurring with national and international visitors on a regular basis.
Acknowledgements
The funding for Year 2 of this project was provided by Canada Mortgage and Housing Corporation. Thanks are extended to Ken Ruest (CMHC) for making this project possible and for his valuable guidance, Randy Biggs (NRCan) for assisting with fireplace operation, and to Martin Thomas (NRCan) for providing energy efficiency testing.
Project Team
Marianne Armstrong (NRC-IRC) as project manager was responsible for monitoring data collection, performing data analysis and writing this report. Mike Swinton (NRC-IRC), expert in side-by-side evaluation, oversaw operations throughout the experiment, monitored results, and provided important feedback throughout the analysis. Frank Szadkowski (NRCan Buildings Group) ensured proper operations of the CCHT Research Houses and fireplace throughout the experiments, and provided important feedback for the data analysis and report.
Acronyms
ach air changes per hour
ANCOVA analysis of covariance
CCHT Canadian Centre for Housing Technology
cfm cubic feet per minute
CMHC Canada Mortgage and Housing Corporation
HRV Heat Recovery Ventilator
IRC Institute for Research in Construction
NRC National Research Council Canada
NRCan Natural Resources Canada
Executive Summary
Over two winters from 2008 to 2010, a series of experiments were conducted in the twin house facility at the Canadian Centre for Housing Technology (CCHT) to examine the impact of gas fireplace operation on an R-2000 house. The interaction of the fireplace with the central heating system was explored, including impact on furnace natural gas and electrical consumption, and room and surface temperature effects.
Three different modes of fireplace operation were examined: continuous evening fireplace operation from 18:00 to 24:00 with the furnace providing continuous air circulation; continuous evening fireplace operation from 18:00 to 24:00 with no continuous air circulation provided by the furnace; and fireplace operation by dedicated thermostat. Additionally, the impact of pilot light operation, and the impact of having an open fireplace vent were also investigated.
Evening operation of the fireplace heated the family room well above the temperature setpoint of the furnace thermostat (22°C), exceeding 25°C during the experiment. To operate for six hours, the fireplace required an average consumption of 144 MJ/day natural gas and 0.256 kWh/day to operate its circulation fan. Operating the fireplace decreased furnace operation, reducing furnace gas consumption by an average 106 MJ/day (39.4%) over the experiment period, and reducing furnace fan electrical consumption by 0.86 kWh (8.0%) with continuous circulation and 1.7 kWh (30.9%) without continuous circulation. Overall, evening fireplace operation resulted in an increase in total energy consumption of 36.4 MJ/day (12.5%) with continuous furnace fan operation and 29.9 MJ/day (11.6%) without continuous fan operation. When efficiencies of the furnace and fireplace were taken into account, the net energy supplied to the house by the fireplace and the furnace increased by an average 2.8% from the benchmark case, and was up to 12% greater on the warmest days of testing.
During evening fireplace operation, air temperature in bedrooms on the second floor dipped by as much as 2°C. This effect was most pronounced in the bedrooms furthest away from the fireplace location. Despite these daily dips in air temperature, minimal differences in surface temperatures were measured on the second floor of the house – the biggest difference was noted on the exterior wall of the bedroom closet, where the minimum surface temperature was reduced by 0.7°C due to fireplace operation. Little temperature difference was noted between continuous and non continuous air circulation.
Operation of the fireplace by thermostat control resulted in a large reduction in furnace operation – due to the close proximity of the fireplace to the central thermostat of the home. On average, the fireplace consumed 249 MJ/day of natural gas and 1.28 kWh of electricity, and reduced furnace consumption by 208 MJ/day (59.3%) of natural gas and 0.85 kWh of electricity, for an overall increase of 38 MJ/day (9.8%) in total heating energy consumption. Despite this increase in consumption, the total heat output was 2.3% lower with fireplace operation. This may have contributed to cooler temperatures on the second floor (1 to 2°C cooler), as the furnace did not cycle frequently to provide heat to the home.
Pilot light operation also had an impact on the home. To keep the pilot light lit, the fireplace consumed on average 38 MJ/day of natural gas. The pilot light also decreased furnace natural gas consumption by 19 MJ/day (5.6%), and furnace fan electrical consumption by 0.19 kWh/day (1.7%) for a total increase in energy consumption of 18 MJ/day (5.0%). A ~0.3°C temperature increase in the family room (where the fireplace was located) and a small temperature decrease on the second floor of the house (~0.2°C) were detected.
The impact of having the opening of the fireplace vent was also examined, but for only four days in relatively mild weather (>0°C). A small increase in energy consumption for heating was detected (3.6% increase), however, more data are needed to fully understand this effect.
Table of Contents
1 Introduction ... 1
2 Objective ... 1
3 Background ... 1
3.1 CCHT Twin House Facility ... 1
3.2 Fireplace Description ... 4
4 Methodology ... 5
4.1 Side-by-side testing procedure ... 5
4.2 Test Dates... 7
4.3 Instrumentation ... 8
Electrical and Natural gas Consumption ... 8
Temperature measurement ... 8
Weather data ... 9
4.4 Statistical Analysis ... 10
5 Results from Year 1 - Fireplace operation from 18:00 – 24:00 with and without continuous air circulation ... 11
5.1 Outdoor Temperature and Solar Conditions ... 11
5.2 Energy Consumption ... 13
Natural Gas Consumption ... 13
Electrical Consumption ... 16
Total Energy Consumption for Heating ... 17
5.3 Family Room Temperature ... 2
5.4 Second floor room temperature ... 5
5.5 Surface Temperatures ... 12
6 Results from Year 2 – Fireplace with thermostat control, pilot light only and fireplace vent open ... 17
6.1 Outdoor Temperature and Solar Conditions ... 17
6.2 Energy Consumption ... 19
Natural Gas Consumption ... 19
Electrical Consumption ... 22
Total Energy Consumption for Heating ... 24
6.3 Room Temperatures ... 27
7 Summary and Discussion ... 35
7.1 Year 1 ... 35
7.2 Year 2 ... 36
7.3 Recommendations for future work ... 37
8 References ... 37
Appendix A. CCHT Research Houses ... 39
Appendix B. Simulated Occupancy ... 40
Appendix C. Savings Calculation Method ... 42
Appendix D. Floor Plans of the CCHT Twin Houses ... 43
Appendix E. Year 1 Summary Tables of Consumption Data ... 46
Appendix F. Year 2 Summary Tables of Consumption Data ... 54
Appendix G. Year 2 Room Temperatures, cloudy days ... 59
Appendix H. Year 1 Surface Temperature Cumulative Frequency and Probability Distribution Diagrams ... 72
Appendix I. Analysis of Covariance (ANCOVA) Results ... 75
Table of Figures
Figure 1 – First floor layout of the CCHT Experimental House, showing fireplace and
thermostat locations ... 2
Figure 2 – Second floor layout of the CCHT Experimental House ... 3
Figure 3 - CCHT Twin-House Facility during winter (Experimental House shown at right) ... 4
Figure 4 - The Experimental House fireplace... 4
Figure 5 - Sealed fireplace vent during Benchmarking ... 6
Figure 6 - Air temperature measurement in the family room ... 8
Figure 7 – North face of the CCHT Reference House, showing the location of the outdoor temperature sensor. ... 9
Figure 8 – South face of CCHT Reference House, showing location of the precision spectral pyranometer to measure incident solar radiation. ... 9
Figure 9 - Outdoor temperature and solar radiation during Year 1 of the experiment... 12
Figure 10 – Outdoor temperature and solar radiation during Year 1 of the experiment (cont.) ... 12
Figure 11 – Sample Experimental House furnace and fireplace natural gas consumption, condition (a) fireplace operation from 18:00 – 24:00 with continuous circulation... 13
Figure 12 - Year 1 – Reduction of daily furnace natural gas consumption due to fireplace operation ... 14
Figure 13 - Year 1 - Overall increase of furnace and fireplace natural gas consumption due to fireplace operation ... 15
Figure 14 - Year 1 Reduction of daily furnace fan electrical consumption due to fireplace operation ... 16
Figure 15 - Year 1 Overall increase in total heating system gas and electrical consumption due to fireplace operation ... 17
Figure 16 – Year 1 Experimental House Energy Consumption for Heating ... 18
Figure 17 – Year 1 Experimental House Heating System Output ... 1
Figure 18 - Sample family room air temperature during Year 1 Benchmarking ... 2
Figure 19 - Sample family room air temperature during a) Operation from 18:00 – 24:00 with continuous circulation ... 3
Figure 20 – Probability Distribution of Family Room air temperature, Year 1 ... 4
Figure 21 – Cumulative Frequency of Family Room air temperature, Year 1 ... 4
Figure 22 – Sample air temperatures in Bedroom 2, measured during Year 1 benchmarking with doors closed ... 5
Figure 23 – Comparison of Experimental House Bedroom 2 and family room temperature during Year 1 Benchmarking with doors closed ... 6
Figure 24 - Sample air temperatures in Bedroom 2, measured during fireplace condition (a) Operation from 18:00 – 24:00 with continuous air circulation ... 6
Figure 25 - Comparison of Experimental House Bedroom 2 and family room temperature during fireplace condition (a) Operation from 18:00 – 24:00 with continuous air circulation ... 7
Figure 26 – Sample air temperatures in Bedroom 4, measured during Year 1 benchmarking with doors closed ... 8
Figure 27 – Comparison of Experimental House Bedroom 4 and family room temperature during Year 1 Benchmarking with doors closed ... 8
Figure 28 - Sample air temperatures in Bedroom 4, measured during fireplace condition (a) Operation from 18:00 – 24:00 with continuous air circulation ... 9
Figure 29 - Comparison of Experimental House Bedroom 4 and family room temperature during fireplace condition (a) Operation from 18:00 – 24:00 with continuous air
circulation ... 9
Figure 30 – Sample bedroom closet surface temperatures during the Year 1 Benchmark with doors closed ... 14
Figure 31 – Sample bedroom closet surface temperatures during a) Operation from 18:00 – 24:00 with continuous circulation ... 14
Figure 32 - Sample bathroom cupboard surface temperatures during the Year 1 Benchmark with doors closed ... 15
Figure 33 - Sample bathroom cupboard surface temperatures during a) Operation from 18:00 – 24:00 with continuous circulation ... 15
Figure 34 - Sample living room wall corner surface temperatures during the Year 1 Benchmark with doors closed ... 16
Figure 35 - Sample living room wall corner surface temperatures during a) Operation from 18:00 – 24:00 with continuous circulation ... 16
Figure 36 - Outdoor Temperature and Solar Radiation during Year 2 of the experiment 18 Figure 37 - Outdoor Temperature and Solar Radiation during Year 2 of the experiment (cont.) ... 18
Figure 38 - Sample furnace and fireplace natural gas consumption in the Experimental House, Condition (c) Fireplace operation with thermostat control ... 19
Figure 39 - Sample furnace and fireplace natural gas consumption in the Experimental House, Condition (d) Pilot light only ... 20
Figure 40 - Year 2 – Reduction in daily furnace natural gas consumption due to fireplace operation and pilot light operation... 21
Figure 41 - Year 2 - Overall increase of furnace and fireplace natural gas consumption due to fireplace operation and pilot light operation ... 22
Figure 42 – Sample furnace and fireplace electrical draw in the Experimental House, Condition (c) Fireplace operation with thermostat control ... 23
Figure 43 - Year 2 Reduction of daily furnace fan electrical consumption due to fireplace operation and pilot light operation... 23
Figure 44 – Year 2 – Overall increase in total heating system gas and electrical consumption due to fireplace and pilot light operation ... 24
Figure 45 – Year 2 Experimental House Consumption for Heating ... 25
Figure 46 - Year 2 Experimental House Heating System Output ... 26
Figure 47 - Sample family room air temperatures during benchmarking ... 29
Figure 48 - Sample family room air temperatures during c) fireplace operation with thermostat control ... 29
Figure 49 - Sample master bedroom air temperatures during Year 2 benchmarking ... 30
Figure 50 - Comparison of Experimental House master bedroom and family room temperature on a sample day during Year 2 Benchmarking ... 30
Figure 51 - Sample bedroom air temperatures during c) fireplace operation with thermostat control ... 31
Figure 52 - Comparison of Experimental House master bedroom and family room temperature on a sample day during c) fireplace operation with thermostat control 31 Figure 53 - Probability Distribution of master bedroom air temperature, Year 2 ... 33
Figure 54 - Probability Distribution of master bedroom air temperature – cloudy days only, Year 2 ... 33
Figure 55 - Cumulative Frequency of master bedroom air temperature, Year 2 ... 34
Figure 56 - Cumulative Frequency of master bedroom air temperature – cloudy days, Year 2 ... 34
Figure C-1 Graphic Representation of the Savings Calculation Method ... 42
Figure D-1. Floor plan - CCHT Research House first floor ... 43
Figure D-2. Floor plan - CCHT Research House second floor ... 44
Figure D-3. Floor plan - CCHT Research House basement ... 45
Figure G-1. Cumulative Frequency Diagram, Year 2 cloudy days - Bedroom 2 ... 59
Figure G-2. Probability Distribution, Year 2 cloudy days - Bedroom 2 ... 59
Figure G-3. Cumulative frequency diagram, Year 2 cloudy days - Bedroom 3 ... 60
Figure G-4. Probability Distribution, Year 2 cloudy days - Bedroom 3 ... 60
Figure G-5. Cumulative frequency diagram, Year 2 cloudy days - Bedroom 4 ... 61
Figure G-6. Probability Distribution, Year 2 cloudy days - Bedroom 4 ... 61
Figure G-7. Cumulative frequency diagram, Year 2 cloudy days – Second floor bathroom ... 62
Figure G-8. Probability distribution, Year 2 cloudy days – Second floor bathroom ... 62
Figure G-9. Cumulative frequency diagram, Year 2 cloudy days – Master bedroom .... 63
Figure G-10. Probability distribution, Year 2 cloudy days – Mater bedroom ... 63
Figure G-11. Cumulative frequency diagram, Year 2 cloudy days – Ensuite ... 64
Figure G-12. Probability distribution, Year 2 cloudy days – Ensuite ... 64
Figure G-13. Cumulative frequency diagram, Year 2 cloudy days – Laundry room ... 65
Figure G-14. Probability distribution, Year 2 cloudy days – Laundry room ... 65
Figure G-15. Cumulative frequency diagram, Year 2 cloudy days – Living room ... 66
Figure G-16. Probability distrubtion, Year 2 cloudy days – Living room ... 66
Figure G-17. Cumulative frequency diagram, Year 2 cloudy days – Powder room ... 67
Figure G-18. Probability distribution, Year 2 cloudy days – Powder room ... 67
Figure G-19. Cumulative frequency diagram, Year 2 cloudy days – Dining room ... 68
Figure G-20. Probability distribution, Year 2 cloudy days – Dining room ... 68
Figure G-21. Cumulative frequency diagram, Year 2 cloudy days – Top landing of stairs ... 69
Figure G-22. Probability distribution, Year 2 cloudy days – Top landing of stairs ... 69
Figure G-23. Cumulative frequency diagram, Year 2 cloudy days – Middle landing of stairs ... 70
Figure G-24. Probability distribution, Year 2 cloudy days – Middle landing of stairs ... 70
Figure G-25. Cumulative frequency diagram, Year 2 cloudy days – Family room ... 71
Figure G-26. Probability distribution, Year 2 cloudy days – Family room ... 71
Figure H-1. Cumulative frequency diagram, Year 1 – Bathroom cupboard surface ... 72
Figure H-2. Probability distrubution, Year 1 – Bathroom cupboard surface ... 72
Figure H-3. Cumulative frequency diagram, Year 1 – Bedroom closet surface ... 73
Figure H-4. Probability distribution, Year 1 – Bedroom closet surface ... 73
Figure H-5. Cumulative frequency diagram, Year 1 – Living room corner surface ... 74
List of Tables
Table 1 - Operating Conditions for the Benchmark ... 5
Table 2 – Year 1 Experiment and Benchmark Dates ... 7
Table 3 – Year 2 Experiment and Benchmark Dates ... 7
Table 4 - Outdoor Temperature and Solar Radiation during Year 1 of the experiment ... 11
Table 5 – Maximum family room temperature during Year 1 ... 2
Table 6. Average Second Floor Air Temperatures During Year 1 of the Fireplace Experiment ... 10
Table 7. Minimum Second Floor Air Temperatures During Year 1 of the Fireplace Experiment ... 11
Table 8 – Average Surface Temperatures During Year 1 ... 13
Table 9 – Minimum Surface Temperatures During Year 1 ... 13
Table 10 - Outdoor Temperature and Solar Radiation during Year 2 of the experiment . 17 Table 11 - Average room air temperature during Year 2 (cloudy days only, vertical solar gains < 15000 kJ/m2/day) ... 28
Table B-1 CCHT Simulated Occupancy Schedule ... 41
Table E-1. Year 1 Natural Gas Consumption, MJ ... 46
Table E-2. Year 1 Electrical Consumption, kWh ... 48
Table E-3. Year 1 Total Heating System Consumption (Electrical and Gas), MJ ... 50
Table E-4. Year 1 Total Heating System Energy Output, MJ ... 52
Table F-1. Year 2 Natural Gas Consumption, MJ ... 54
Table F-2. Year 2 Electrical Consumption, kWh ... 55
Table F-3. Year 2 Total Heating System Consumption (Electrical and Gas), MJ ... 56
Table F-4. Year 2 Total Heating System Energy Output, MJ ... 57
Table I-1. ANCOVA of Furnace Gas Consumption from: ... 75
Table I-2. ANCOVA of Total Gas Consumption from: ... 76
Table I-3. ANCOVA of Total Heating Gas and Electrical Consumption from: ... 77
Table I-4. ANCOVA of Furnace Gas Consumption from: ... 78
Table I-5. ANCOVA of Total Gas Consumption from: ... 79
Table I-6. ANCOVA of Furnace Electrical Consumption from: ... 80
Table I-7. ANCOVA of Total Heating Gas and Electrical Consumption from: ... 81
Table I-8. ANCOVA of Furnace Gas Consumption from: ... 82
Table I-9. ANCOVA of Furnace Electrical Consumption from: ... 83
1 Introduction
Gas fireplaces are prevalent in homes across Canada. In the 2007 Survey of Household Energy Use (NRCan, 2007) almost a quarter of all homes (23%) reported having a gas-burning fireplace, up from a reported 19% in 2003. Of these homes, 22% reported using the fireplace every day during the heating season.
When a fireplace is operated in close proximity to the house‟s central thermostat, the heat introduced by the fireplace can cause the heating system to delay its normal cycle of operation – affecting energy consumption and temperatures in the home. Over two winters from 2008 to 2010, researchers at the Canadian Centre for Housing Technology undertook a project to examine the impact of operating a gas fireplace in an R-2000 house. Under a variety of operating conditions, they explored the interaction of the fireplace with the central thermostat, the impact on energy consumption for heating, and changes in room air and surface temperatures. Additionally, impact of the fireplace‟s standing pilot light and open vent were explored. The results from this project are described in this report.
2 Objective
The objectives of this project were:
To evaluate the impact of operating a natural gas fireplace on house energy consumption.
To monitor the resulting room air temperatures, wall and window surface temperatures, to determine if the risk of condensation and mould growth has been increased.
To monitor any change in furnace operation due to fireplace operation.
3 Background
3.1 CCHT Twin House Facility
Built in 1998, the Canadian Centre for Housing Technology (CCHT) (www.ccht-cctr.gc.ca) is jointly operated by National Research Council (NRC), Natural Resources Canada (NRCan), and Canada Mortgage and Housing Corporation (CMHC). CCHT‟s mission is to accelerate the development of new technologies and their acceptance in the marketplace.
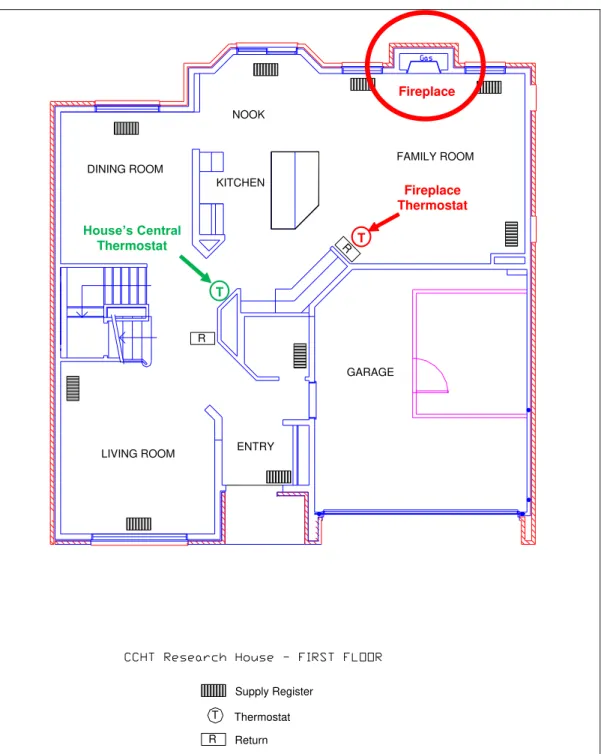
The Canadian Centre for Housing Technology features twin research houses to evaluate the whole-house performance of new technologies in side-by-side testing (Figure 3). These houses were designed and built by a local builder to the R-2000 standard. The houses are a popular model currently on the market in the region, and were built with the same crews and techniques normally used by the builder. The houses are described in more detail in Appendix A. The houses feature an open-plan layout on the main floor as shown in Figure 1 and Figure 2, and Appendix D.
Thermostat Supply Register T T T Return R R R FAMILY ROOM NOOK KITCHEN DINING ROOM
LIVING ROOM ENTRY
GARAGE Fireplace House’s Central Thermostat Fireplace Thermostat T T
Figure 1 – First floor layout of the CCHT Experimental House, showing fireplace and
Supply Register - below floor Supply Register
Thermostat T
R Return
Return - below floor R T R T R T BEDROOM 2 BEDROOM 3 BEDROOM 4 MASTER BEDROOM ENSUITE LAUNDRY T R BATHROOM Doors Closed in Year 1
Figure 3 - CCHT Twin-House Facility during winter (Experimental House shown at right)
3.2 Fireplace Description
The technology examined in this study is a direct-vent, zero clearance, natural gas fireplace, with a standing pilot light and 48W circulating fan. The fireplace has a maximum input of 20,000 Btu/h with a measured steady state efficiency of rated fireplace efficiency of 76.1%. See Appendix J for steady state efficiency testing results. According to Natural Resources Canada, a well designed non-condensing gas-fireplace should be able to achieve a Steady State Efficiency in the region of 82 to 85%. The fireplace installed in both the CCHT Experimental House and Control House at the time of construction (1998), but was not activated until this experiment. The fireplace is located in the main floor family room, recessed into the North wall (see Figure 1 for the main floor plan with fireplace location).
4 Methodology
4.1 Side-by-side testing procedure
CCHT‟s twin houses are referred to for this experiment as the “Experimental House” and the “Control House”.
For all side-by-side experiments, the twin houses are benchmarked in identical configuration at the start and periodically throughout the heating season. By quantifying the small differences between the houses during benchmarking, all additional differences in house performance during an experiment can be attributed to the technology being assessed. The benchmark configuration is described in Table 1. Note that the benchmark changed between Year 1 and Year 2 of the fireplace study. The Year 1 benchmark did not include any exterior shades, whereas the Year 2 benchmark included exterior shades on the largest two south-facing windows of both houses. This change was made to accommodate other projects in the 2009-2010 heating season. The configuration in the first year represents a passive solar R-2000 house and the configuration in the second year represents an R-2000 house that has considerable shading on the south side.
Table 1 - Operating Conditions for the Benchmark
System Setup
1 Heating system
Forced air system, heating provided by a high efficiency single-stage condensing gas furnace with split capacitor motor; circulation fan “on” at standby.
2 House Thermostat Standard central location, 22°C setpoint 3 Heat Recovery
Ventilator (HRV)
On continuous 65 cfm, with two high speed cycles per day at the same time as the simulated shower events
4 Interior Doors All Open
5 Window Shading
Year 1: no exterior shades,
Interior Venetian blinds down with slats in the horizontal position
Year 2: exterior shades on the two largest south-facing windows
7 Simulated Occupancy Standard Schedule (see Appendix B)
8 Humidifier Off
9 Hot Water Heater Standard Gas
10 Fireplace Vent sealed (as shown in Figure 5), fireplace and pilot light off
Figure 5 - Sealed fireplace vent during Benchmarking
During the experiment portion of side-by-side testing, a change is made to the Experimental House. In this experiment, a scenario of fireplace operation was introduced. A total of five different scenarios were examined in the fireplace experiment, as described below:
a) Year 1 – Fireplace operation from 18:00 – 24:00 with continuous air circulation
The fireplace was run continuously for six hours in the evening, with no thermostat control on the fireplace. The pilot light remained lit the remainder of the day when the fireplace was not running. Doors to Bedroom 2 (southwest corner of the house) and Bedroom 4 (northeast corner of the house) on the second floor were closed (see Figure 2 for bedroom locations). The furnace fan was allowed to operate normally, providing continuous air circulation (~650 cfm) at standby, and high speed airflow during heating (~1100 cfm).
b) Year 1 – Fireplace operation from 18:00 – 24:00 with no continuous air
circulation
The fireplace was run continuously for six hours in the evening, with no thermostat control on the fireplace. The pilot light remained lit the remainder of the day when the fireplace was not running. Doors to Bedroom 2 and Bedroom 4 on the second floor were closed (see Figure 2 for bedroom locations). The furnace fan did not provide air circulation at standby. For this condition only, the Control House was also operated without continuous air circulation by the furnace fan.
c) Year 2 – Fireplace with thermostat control
The fireplace was connected to a dedicated thermostat, in the location shown in Figure 1. The fireplace thermostat was set to 23°C, and cycled fireplace operation to maintain this setpoint. The setpoint was chosen 2°C above the house thermostat setpoint (21°C). The setpoint was high enough to cause the fireplace to fire, but not too high to prevent the house thermostat from calling for furnace operation occasionally. All interior doors were kept open. The furnace fan provided continuous air circulation at standby.
d) Year 2 – Pilot light only
The fireplace was turned off, and the pilot light remained lit. All interior doors were kept open. The furnace fan provided continuous air circulation at standby.
e) Year 2 – Fireplace vent open, no operation
The fireplace and pilot light were shut off. The fireplace vent remained unsealed. All interior doors were kept open. The furnace fan provided continuous air circulation at standby.
4.2 Test Dates
The experiment was performed over two years. The first year of study (2008-2009) examined the continuous operation of the fireplace in the evening, with and without continuous air circulation by the furnace fan (Table 2).
The second year of study (2009-2010) examined operating the fireplace under thermostat control, the impact of the pilot light, and the impact of the fireplace vent (Table 3).
Table 2 – Year 1 Experiment and Benchmark Dates
Configuration Date Range Number of Days Outdoor Temperature a) Operation from 18:00 – 24:00 Continuous air circulation 19-Dec-08 to 27-Dec-09 and 6-Mar-09 to 11-Mar-09 15 Max. 10.3°C Min. -19.1°C b) Operation from 18:00 – 24:00 No continuous air circulation 28 Dec-08 to 1-Jan-09 and 13-Mar-09 to 15-Mar-09 8 Max. 10.0°C Min. -18.7°C Benchmark 22-Nov-08 to 13-Apr-09 36 (not consecutive, includes 12 days of benchmarking with Bedroom 2 and Bedroom 4 doors closed) Max. 14.0°C Min. -20.0°C
Table 3 – Year 2 Experiment and Benchmark Dates
Configuration Date Range Number of Days Outdoor Temperature
c) Thermostat control
6-Feb-10 to 14-Feb-10 9 Max. 3.8°C
Min. -14.8°C d) Pilot light only
2-Feb-10 to 4-Feb-10 and 16-Feb-10 to 18-Feb-10 6 Max. 3.9°C Min. -12.7°C e) Fireplace vent open
26-Feb-10 to 1-Mar-10 4 Max. 8.9°C
Min. 1.9°C
4.3 Instrumentation
Electrical and Natural gas Consumption
Electric pulse-meters measured furnace and fireplace fan electrical consumption at a resolution of 1 pulse per 0.0006 kWh. Natural gas consumption of the furnace was measured by gas meters with a resolution of 1 pulse per 0.05 ft3 natural gas. The natural gas consumption of the fireplace was monitored using a gas meter with a resolution of 1 pulse per 1 ft3 natural gas. Meter data was collected at 5-minute intervals by the central data acquisition system (DAS). Total daily furnace and fireplace consumption were calculated from the 5-minute readings and this information was used in the analysis.
Temperature measurement
All air and surface temperature measurements were made by thermocouples connected to the centre DAS, with an accuracy of +0.2°C. The temperature of air in the family room (where the fireplace is located) was measured by thermocouple at a height of 4 feet at a central location in the room, as shown in Figure 6. Temperature data at this location was collected on a 5-minute basis.
In Year 1 of the fireplace experiment, thermocouples were deployed to measure surface temperatures in three additional locations: in the southwest corner of the living room near the floor; on the exterior wall of the closet of bedroom 2, behind a box filled with paper; and in the second floor bathroom cupboard. These surface temperature measurements were recorded once every 5 minutes. Additional measurements of room air temperature were taken at mid height and recorded once every hour.
In Year 2 of the fireplace experiment, thermocouples were deployed at a central location in each room, at a height of 4 feet (in a similar manner to the thermocouple located in the family room). These thermocouples were used to record room air temperature every 5 minutes.
Weather data
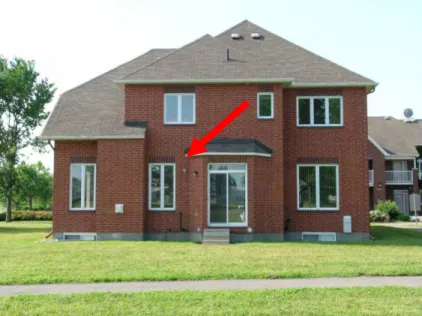
A temperature sensor mounted on the North side of the CCHT Experimental House provided outdoor temperature data in °C (Figure 7). A precision spectral pyranometer recorded solar radiation incident on the south face of the Experimental House in W/m2 (as shown in Figure 8). A second pyranometer was mounted on a horizontal platform above the Experimental House roof and recorded radiation incident on a horizontal surface. Both solar and temperature data were recorded on a 5-minute basis by the central CCHT DAS.
Figure 7 – North face of the CCHT Reference House, showing the location of the outdoor
temperature sensor.
Figure 8 – South face of CCHT Reference House, showing location of the precision
4.4 Statistical Analysis
A one-way analysis of covariance (ANCOVA) was applied to sets of consumption data to determine whether one set of data was significantly different from a second set. For example: a set of gas consumption data from the benchmark was compared to a set of gas consumption data from the pilot light experiment. For all analysis, a 5% (α=0.05) level of significance was used. The full results of the ANCOVA are provided in Appendix I. In all instances, the analysis reported no significant difference in slope of the linear regression trends being compared (P>0.05). The ANCOVA was subsequently used to compare the adjusted means to determine whether the trends were statistically different.
5 Results from Year 1 - Fireplace operation from 18:00
– 24:00
with and without continuous air circulation
The first year of results were analyzed over a 24-hour day beginning at 18:00 in order to capture the lingering effects of fireplace operation in the evening. For example, 19-Dec-08 refers to the 24-hour time period from 19-Dec-19-Dec-08 at 18:00 to 20-Dec-19-Dec-08 at 18:00.
5.1 Outdoor Temperature and Solar Conditions
The outdoor temperature and solar conditions from Year 1 are reported in Table 4, and plots of 5-minute data are shown Figure 9 and Figure 10. Outdoor temperatures during condition (a) ranged from -19.1°C to 10.3°C, with an average of -4.3°C. Most days during this period had low solar gains (<15000 kJ/m2/day on a vertical south-facing surface). Outdoor temperatures during condition (b) ranged from -18.7°C to 10.0 °C, with an average of -3.8°C. Condition (b) featured a majority of days with high solar gains (>15000 kJ/m2/day on a vertical south-facing surface).
Table 4 - Outdoor Temperature and Solar Radiation during Year 1 of the experiment
Outdoor Temperature, °C Global Solar Radiation,
kJ/m2/day
Date average Min Max On Vertical
South-facing surface
On Horizontal
Surface
a) Operation from 18:00 – 24:00 Continuous Circulation
19-Dec-08 -13.8 -15.0 -12.0 16517 6379 20-Dec-08 -14.2 -17.8 -10.2 1200 1634 21-Dec-08 -11.8 -15.5 -9.2 10194 5561 22-Dec-08 -16.0 -19.1 -11.2 3037 3788 23-Dec-08 -4.5 -11.3 2.1 733 946 24-Dec-08 1.4 -4.6 6.6 16169 6511 25-Dec-08 -9.6 -14.1 -4.5 1566 2417 26-Dec-08 -3.7 -7.0 1.4 664 1008 6-Mar-09 7.4 5.3 10.3 8555 9795 7-Mar-09 4.7 2.4 6.7 19220 15700 8-Mar-09 0.0 -3.3 4.2 6153 8088 9-Mar-09 -0.3 -5.2 4.3 4943 7716 10-Mar-09 4.2 2.1 9.0 6425 7645
b) Operation from 18:00 – 24:00 No Continuous Circulation
28-Dec-08 2.3 -0.7 5.7 1688 2463 29-Dec-08 -2.8 -9.7 2.0 17128 6807 30-Dec-08 -12.7 -14.8 -9.7 12648 6069 31-Dec-08 -15.7 -18.7 -12.1 17417 6762 12-Mar-09 -7.3 -11.2 -0.4 21040 17956 13-Mar-09 -1.2 -5.7 6.8 19193 16961 14-Mar-09 4.2 0.5 10.0 17913 16640 15-Mar-09 2.7 -1.9 10.0 18452 16503
0 200 400 600 800 1000 1200 1400 1600 -25 -20 -15 -10 -5 0 5 10 15 So la r R a d ia ti o n , W/ m 2 Te m p e ra tu re , °C Date
Year 1 - Outdoor Temperature and Solar Radiation
Outdoor Air Temperature
Solar Radiation incident on a South Facing Vertical Surface
a) Operation from 18:00 – 24:00 Continuous air circulation
b) Operation from 18:00 – 24:00 No continuous air circulation
Figure 9 - Outdoor temperature and solar radiation during Year 1 of the experiment
0 200 400 600 800 1000 1200 1400 1600 -25 -20 -15 -10 -5 0 5 10 15 So la r R a d ia ti o n , W/ m 2 Te m p e ra tu re , °C Date
Year 1 - Outdoor Temperature and Solar Radiation
Outdoor Air Temperature
Solar Radiation incident on a South Facing Vertical Surface a) Operation from 18:00 – 24:00
Continuous air circulation
b) Operation from 18:00 – 24:00 No continuous air circulation
Figure 10 – Outdoor temperature and solar radiation during Year 1 of the experiment
5.2 Energy Consumption
Natural Gas Consumption
During both condition (a) and condition (b) the fireplace was operated continuously from 18:00 to 24:00. During the remainder of the day, the pilot light remained lit. A sample graph of furnace and fireplace natural gas consumption is presented in Figure 11. When the fireplace was operating the furnace operation was reduced – with few heating cycles. During the remainder of the day the furnace cycled frequently. In this figure, the fireplace pilot light also appears to cycle – however, this effect is due to the resolution of the natural gas meter: the pilot light consumes a constant 0.025 ft3/min, while the fireplace gas meter transmits one pulse per cubic foot. The furnace gas meter had a higher resolution of 1 pulse per 0.05 ft3.
0 0.1 0.2 0.3 0.4 0.5 0.6 0.7 0.8 0.9 18:00 20:00 22:00 0:00 2:00 4:00 6:00 8:00 10:00 12:00 14:00 16:00 N a tu ra l G a s Co n su m p ti o n ( ft 3 /m in ) Time h:mm
Sample Experimental House
Furnace and Fireplace Natural Gas Consumption
a) Fireplace operation from 18:00 - 24:00 with continuous circulation
Furnace Gas Fireplace Gas
22-Dec-08 to 23-Dec-09
Figure 11 – Sample Experimental House furnace and fireplace natural gas consumption,
condition (a) fireplace operation from 18:00 – 24:00 with continuous circulation
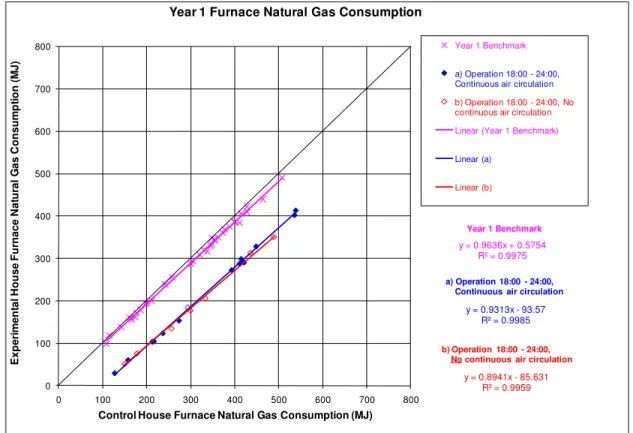
The effect of the fireplace on furnace operation can be calculated on a daily basis. Figure 12 presents a comparison of the furnace natural gas consumption in the Control House and the Experimental House. The Control House daily consumption per day is plotted on the x-axis. The Experimental House daily consumption is plotted on the y-axis. Each data point represents a single day of consumption. If the houses were completely identical, the resulting trend would be a perfect slope of 1 (a 45-degree angle) with an intercept of 0. The Year 1 benchmark data (shown in pink) has a slope of 0.964 and intercept of 0.575. The fact that the benchmark is not perfect is the result of
to benchmark. The differences in benchmarking are accounted for in the savings calculation method (refer to Appendix C for a description of this method).
Results from Year 1 of the fireplace experiment are plotted in red for condition (a) and in blue for condition (b). As indicated above, the fireplace was operated in the Experimental house, and the experiment is designed to identify any significant change in energy consumption in the Experimental House upward (more consumption) or downward (savings) compared to the benchmark line. The trend line drawn through these points for both condition (a) and (b) falls well below the benchmark trend line, indicating a decrease in furnace gas consumption due to fireplace operation in the Experimental House across the range of experiment conditions.
ANCOVA results show that the operation of the furnace fan in the home with and without continuous air circulation did not have a significant impact on furnace natural gas consumption during the fireplace experiment (F1, 18=1.72, P=0.206). During the experiment period, operation of the fireplace in the Experimental House decreased furnace gas consumption by 106 MJ/day (39.4%) was operated with or without continuous circulation at standby. Summary tables of gas consumption can be found in Appendix E. y = 0.9636x + 0.5754 R² = 0.9975 y = 0.9313x - 93.57 R² = 0.9985 y = 0.8941x - 85.631 R² = 0.9959 0 100 200 300 400 500 600 700 800 0 100 200 300 400 500 600 700 800 E x p e ri m e n ta l H o u s e F u rn a c e N a tu ra l G a s C o n s u m p ti o n ( M J )
Control House Furnace Natural Gas Consumption (MJ)
Year 1 Furnace Natural Gas Consumption
Year 1 Benchmark
a) Operation 18:00 - 24:00, Continuous air circulation
b) Operation 18:00 - 24:00, No continuous air circulation
Linear (Year 1 Benchmark)
Linear (a)
Linear (b)
Year 1 Benchmark
a) Operation 18:00 - 24:00, Continuous air circulation
b) Operation 18:00 - 24:00, No continuous air circulation
Figure 12 - Year 1 – Reduction of daily furnace natural gas consumption due to fireplace
operation
In Figure 13, the natural gas consumption of the fireplace has been added to the furnace consumption in the Experimental House. The benchmark trend in this figure is identical to the benchmark in Figure 12, since the benchmark did not include any fireplace operation. The experiment trends for condition (a) and (b) lie above the benchmark line,
indicating an increase in total natural gas consumption in the Experimental House due to the operation of the fireplace.
ANCOVA results again show that there is no significant difference between the total natural gas consumption trends for condition (a) and (b) (F1, 18=3.20, P=0.091). The fireplace consumed approximately 144 MJ of natural gas per day to operate for 6 hours continuously. As a result, the Experimental House consumed on average 38 MJ/day (15.5%) more natural gas for heating (furnace and fireplace) during the experiment.
y = 0.9636x + 0.5754 R² = 0.9975 y = 0.9278x + 52.162 R² = 0.9983 y = 0.9109x + 52.509 R² = 0.996 0 100 200 300 400 500 600 700 800 0 100 200 300 400 500 600 700 800 E x p e ri m e n ta l H o u s e F u rn a c e & F ir e p la c e N a tu ra l G a s C o n s u m p ti o n (M J )
Control House Furnace Natural Gas Consumption (MJ)
Year 1 Furnace and Fireplace Natural Gas Consumption Year 1 Benchmark
a) Operation 18:00 - 24:00, Continuous air circulation
b) Operation 18:00 - 24:00, No continuous air circulation
Linear (Year 1 Benchmark)
Linear (a)
Linear (b)
Year 1 Benchmark
a) Operation 18:00 - 24:00, Continuous air circulation
b) Operation 18:00 - 24:00, No continuous air circulation
Figure 13 - Year 1 - Overall increase of furnace and fireplace natural gas consumption due to fireplace operation
Electrical Consumption
The fireplace consumed approximately 0.26 kWh/day of electricity to operate the 33 Watt circulating fan for 6 hours.
A plot of furnace fan electrical consumption is presented in Figure 14. When the fireplace ran, the furnace operated less in high speed heating mode, and there was a resultant reduction in furnace fan electrical consumption. In case (a) with continuous air circulation, furnace electrical consumption was reduced by an average of 1.12 kWh/day (10.4%). In case (b) there was no benchmark for operation without continuous air circulation, so the benchmark curve was extrapolated to calculate savings. For (b), the fireplace operation resulted in an average 1.96 kWh/day (35.7%) reduction in furnace fan electrical consumption. Summary tables of electrical consumption can be found in Appendix E. y = 0.9538x + 0.4227 R² = 0.987 y = 0.9587x - 0.7519 R² = 0.9984 y = 0.9247x - 1.3724 R² = 0.9963 0 2 4 6 8 10 12 14 0 2 4 6 8 10 12 14 E x p e ri m e n ta l H o u s e F u rn a c e E le c tr ic a l C o n s u m p ti o n ( k W h )
Control House Furnace Electrical Consumption (kWh)
Year 1 Furnace Fan Electrical Consumption
Year 1 Benchmark a) Operation 18:00 - 24:00, Continuous air circulation
b) Operation 18:00 - 24:00, No continuous air circulation
Linear (Year 1 Benchmark) Linear (a)
Linear (b)
Year 1 Benchmark
a) Operation 18:00 - 24:00, Continuous air circulation
b) Operation 18:00 - 24:00, No continuous air circulation
Figure 14 - Year 1 Reduction of daily furnace fan electrical consumption due to fireplace operation
Total Energy Consumption for Heating
The total heating system electrical and gas consumption is plotted in Figure 15. Throughout all conditions, the operation of the fireplace for six hours in the evening, with or without continuous circulation, resulted in an increase in total heating energy consumption. ANCOVA results show that operation of the furnace fan in the home with and without continuous air circulation did impact total heating system gas and electrical consumption during the fireplace experiment (F1, 18=8.80, P=0.008).
During configuration (a) with continuous air circulation, evening fireplace operation resulted in an average increase in consumption of 36.5 MJ/day (12.5%). During configuration (b) with no continuous air circulation, evening fireplace operation resulted in an average increase in consumption of 29.9 MJ/day (11.6%). The increase in consumption was highest on the warmest days of testing (with the lowest heating loads). On these days, the fireplace potentially contributed to overheating. Summary tables of total energy consumption can be found in Appendix E.
y = 0.9634x + 1.8085 R² = 0.9977 y = 0.9288x + 51.229 R² = 0.9984 y = 0.9108x + 48.813 R² = 0.9961 0 100 200 300 400 500 600 700 800 0 100 200 300 400 500 600 700 800 E x p e ri m e n ta l H o u s e F u rn a c e & F ir e p la c e , G a s & E le c tr ic a l C o n s u m p ti o n ( M J )
Control House Furnace Gas & Electrical Consumption (MJ)
Year 1 Heating System Gas and Electrical Consumption Year 1 Benchmark
a) Operation 18:00 - 24:00, Continuous air circulation
b) Operation 18:00 - 24:00, No continuous air circulation
Linear (Year 1 Benchmark)
Linear (a)
Linear (b)
Year 1 Benchmark
a) Operation 18:00 - 24:00, Continuous air circulation
b) Operation 18:00 - 24:00, No continuous air circulation
Figure 15 - Year 1 Overall increase in total heating system gas and electrical consumption due to fireplace operation
The total daily heating system gas and electrical energy consumption is presented as a bar chart in Figure 16. In this chart, the columns labeled “Bench” refer to the expected energy consumption of the Experimental House in benchmark condition, as adjusted using the benchmark correlations (as described in Appendix C). The columns labeled “Exp” show the measured daily Experimental House energy consumption from the experiment. This plot shows clearly shows that the fireplace use resulted in higher overall energy consumption.
0 100 200 300 400 500 600 700 B e n ch E x p B e n ch E x p B e n ch E x p B e n ch E x p B e n ch E x p B e n ch E x p B e n ch E x p B e n ch E x p B e n ch E x p B e n ch E x p B e n ch E x p B e n ch E x p B e n ch E x p B e n ch E x p B e n ch E x p B e n ch E x p B e n ch E x p B e n ch E x p B e n ch E x p B e n ch E x p B e n ch E x p 19-Dec 20-Dec 21-Dec 22-Dec 23-Dec 24-Dec 25-Dec 26-Dec 6-Mar 7-Mar 8-Mar 9-Mar 10-Mar . 28-Dec 29-Dec 30-Dec 31-Dec 12-Mar 13-Mar 14-Mar 15-Mar a) Operation from 18:00 – 24:00 Continuous Circulation . b) Operation from 18:00 – 24:00 No Continuous Circulation Co n su m p ti o n , M J/ d a y
Year 1 Experimental House Consumption for Heating
Fireplace Gas Fireplace Elec Furnace Gas Furnace Elec
The bar chart in Figure 17 takes into account the low efficiency of the fireplace (76.1% measured steady state), and high efficiency of the furnace (94%) to calculate the approximate total heat output to the home. On most days of the experiment, the same or slightly more heat was delivered to the home with fireplace operation. Due to fireplace operation, there was on average 8.2 MJ/day (3.5%) more heat delivered to the home (by both the furnace and fireplace) in configuration (a) with continuous air circulation, and 2.0 MJ/day (1.6%) more heat delivered during configuration (b) with no continuous air circulation. 0 100 200 300 400 500 600 700 B e n ch E x p B e n ch E x p B e n ch E x p B e n ch E x p B e n ch E x p B e n ch E x p B e n ch E x p B e n ch E x p B e n ch E x p B e n ch E x p B e n ch E x p B e n ch E x p B e n ch E x p B e n ch E x p B e n ch E x p B e n ch E x p B e n ch E x p B e n ch E x p B e n ch E x p B e n ch E x p B e n ch E x p 19-Dec 20-Dec 21-Dec 22-Dec 23-Dec 24-Dec 25-Dec 26-Dec 6-Mar 7-Mar 8-Mar 9-Mar 10-Mar . 28-Dec 29-Dec 30-Dec 31-Dec 12-Mar 13-Mar 14-Mar 15-Mar a) Operation from 18:00 – 24:00 Continuous Circulation . b) Operation from 18:00 – 24:00 No Continuous Circulation He a t O u tp u t, M J/ d a y
Year 1 Experimental House Heating System Output
Fireplace Gas Fireplace Elec Furnace Gas Furnace Elec
5.3 Family Room Temperature
During fireplace operation, the temperature in the family room was heated above the setpoint of the furnace. Sample family room temperatures during benchmarking and during fireplace operation with continuous circulation are plotted in Figure 18 and Figure 19. During fireplace operation with continuous circulation (a), the family room air temperature reached a maximum of 25.9°C (Table 5). During fireplace operation without continuous circulation (b), the family room air temperature reached a maximum of 26.8°C, 4.9°C above the maximum temperature of the Control House family room. Even during the period of the day when the fireplace was shut off, the room remained warmer. This could be due to the continued contribution of the pilot light to heating in the family room.
Table 5 – Maximum family room temperature during Year 1
Family room
Maximum air Temperature, °C Exp. Control Difference
Y2 Benchmark 22.4 22.2 0.3
Y2 Benchmark – doors closed 22.2 22.0 0.2
a) Continuous circulation 25.9 22.0 3.9 b) No continuous circulation 26.8 22.0 4.9 15 16 17 18 19 20 21 22 23 24 25 18:00 20:00 22:00 0:00 2:00 4:00 6:00 8:00 10:00 12:00 14:00 16:00 18:00 T e m p e ra tu re ( °C) Time (h:mm)
Family Room Air Temperature during Year 1 Benchmarking Mid-height in front of fireplace
Experimental House Control House
4-Jan-09
15 16 17 18 19 20 21 22 23 24 25 18:00 20:00 22:00 0:00 2:00 4:00 6:00 8:00 10:00 12:00 14:00 16:00 18:00 T e m p e ra tu re ( °C) Time (h:mm) Family Room Air Temperature during
a) Operation from 18:00 – 24:00 with continuous circulation
Mid-height in front of fireplace
Experimental House Control House
22-Dec-08
Figure 19 - Sample family room air temperature during a) Operation from 18:00 – 24:00
with continuous circulation
The probability distribution of family room temperature data is presented in Figure 20. This diagram shows the probability of the air being at any given temperature. The plot contains data from both houses, and for three different conditions: benchmarking with doors closed, (a) fireplace operation with continuous circulation, and (b) fireplace operation without continuous circulation. All three probability distribution curves for the Control House are similar – as expected, since the Control House was in benchmark configuration throughout Year 1 benchmarking and experiments. During benchmarking, the Experimental House probability distribution resembles that of the Control House. During the fireplace experiment, the probability distribution is shifted to higher temperatures by fireplace operation.
This data can also be plotted as cumulative frequency curves (Figure 21). In this form, the data shows the probability of air being at or below a given temperature. The three cumulative frequency curves for the Control House and the benchmark curve for the Experimental House are again similar. In all these cases, family room temperature was below 20.6°C ~50% of the time, and below 22.0°C ~100% of the time. The Experimental House curves during the fireplace experiment are again distinct from the Control House and benchmark curves. Both experiment curves are similar below 23.0°C, but differ at higher temperatures. During the experiment with continuous circulation (a), the family room air temperature was above 25°C ~5% of the time, while without continuous circulation (b), the air temperature was above 25°C ~10% of the time.
0% 2% 4% 6% 8% 10% 12% 14% 16% 18% 20% 18 19 20 21 22 23 24 25 26 27 P (x ) Temperature, °C - 0.2°C bins
Family Room
Experimental House - Year 1 Benchmark with doors closed
Control House - Year 1 Benchmark with doors closed
Experimental House - a) Continuous air circulation
Control House - a) Continuous air circulation Experimental House - b) No continuous air circulation
Control House - b) No continuous air circulation
Figure 20 – Probability Distribution of Family Room air temperature, Year 1
0% 10% 20% 30% 40% 50% 60% 70% 80% 90% 100% 18 19 20 21 22 23 24 25 26 27 Cu m u la ti ve fr e q u e n cy (% ) Temperature, °C - 0.2°C bins
Family Room
Experimental House - Year 1 Benchmark with doors closed
Control House - Year 1 Benchmark with doors closed
Experimental House - a) Continuous air circulation
Control House - a) Continuous air circulation Experimental House - b) No continuous air circulation
Control House - b) No continuous air circulation
5.4 Second floor room temperature
Temperatures on the second floor of the home were affected by evening fireplace operation. On evenings when the fireplace operated, the temperature of rooms on the second floor dropped. The effect was most pronounced in the master bedroom, and Bedroom 2 (Figure 24).
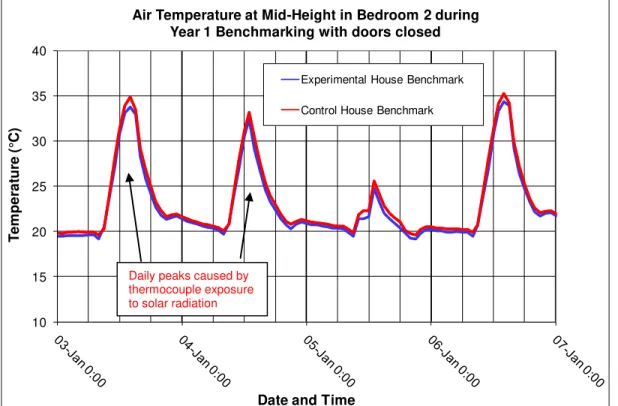
During Benchmarking with doors closed, Bedroom 2 air temperature was similar in the two houses (Figure 22), on average within 0.5°C (see Table 6 for average room air temperature). Note: the peaks in this graph are caused by the thermocouple being exposed to solar radiation on sunny days, and coincide with the peaks in measured solar radiation shown in Figure 10. Overnight (when there was no solar effect on temperature measurement), the temperature in Bedroom 2 was similar to the temperature in the family room (Figure 23).
During the Experiment, air temperature dropped in the evening, down to 15.4 °C on the coldest occasion (see Table 7 for minimum room air temperature). Similar drops were seen during a) with continuous circulation and b) without continuous circulation. As shown in Figure 25, the evening dips in temperature in Bedroom 2 coincide with evening peaks in temperature in the family room (as heated by the fireplace). As a result, the family room was up to ~8°C warmer than Bedroom 2 at times during fireplace operation.
10 15 20 25 30 35 40 T e m p e ra tu re ( °C)
Date and Time
Air Temperature at Mid-Height in Bedroom 2 during Year 1 Benchmarking with doors closed
Experimental House Benchmark Control House Benchmark
Figure 22 – Sample air temperatures in Bedroom 2, measured during Year 1 benchmarking
with doors closed
Daily peaks caused by thermocouple exposure to solar radiation
10 15 20 25 30 35 40 T e m p e ra tu re ( °C)
Date and Time
Air Temperature comparison between Bedroom 2 and the Family Room during Year 1 Benchmarking with doors closed
Experimental House - Bedroom 2 Experimental House - Family Room
Figure 23 – Comparison of Experimental House Bedroom 2 and family room temperature
during Year 1 Benchmarking with doors closed
10 15 20 25 30 35 40 T e m p e ra tu re ( °C)
Date and Time
Air Temperature at Mid-Height in Bedroom 2 during (a) Operation from 18:00 - 24:00 with continuous air circulation
Experimental House Experiment Control House Experiment
Figure 24 - Sample air temperatures in Bedroom 2, measured during fireplace condition (a)
Operation from 18:00 – 24:00 with continuous air circulation
Daily dips caused by fireplace operation
Similar overnight temperatures in the two rooms during Benchmarking
10 15 20 25 30 35 40 T e m p e ra tu re ( °C)
Date and Time
Air Temperature comparison between Bedroom 2 and the Family Room during (a) Operation from 18:00 - 24:00 with continuous air circulation
Experimental House - Bedroom 2 Experimental House - Family Room
Figure 25 - Comparison of Experimental House Bedroom 2 and family room temperature
during fireplace condition (a) Operation from 18:00 – 24:00 with continuous air circulation
The effect was less pronounced in the rooms above the location of the fireplace – the bathroom and Bedroom 4. Sample temperature data for Bedroom 4 during benchmarking with doors closed is presented in Figure 26. This room is located on the north side of the house, and the thermocouple measuring air temperature did not experience the same solar radiation peaks as seen for Bedroom 2. During Benchmarking, air temperature was similar in the two houses. Colder temperatures were seen in this room in both houses when the doors were closed (Table 6). Generally, the Experimental House Bedroom 4 air temperature was 2 to 3°C cooler than the family room during benchmarking with doors closed (Figure 27).
Family room temperature up to ~8°C warmer than Bedroom 2 during fireplace operation
10 15 20 25 30 35 40 T e m p e ra tu re ( °C)
Date and Time
Air Temperature at Mid-Height in Bedroom 4 during Year 1 Benchmarking with Doors Closed
Experimental House Benchmark Control House Benchmark
Figure 26 – Sample air temperatures in Bedroom 4, measured during Year 1 benchmarking
with doors closed
10 15 20 25 30 35 40 T e m p e ra tu re ( °C)
Date and Time
Air Temperature comparison between Bedroom 4 and the Family Room during Year 1 Benchmarking with doors closed
Experimental House - Family Room Experimental House - Bedroom 4
Figure 27 – Comparison of Experimental House Bedroom 4 and family room temperature
during Year 1 Benchmarking with doors closed Bedroom 4
temperature 2 to 3°C cooler than Family Room temperature during Benchmarking with doors closed
A small dip in temperature was seen in Bedroom 4 during fireplace operation in the evening (Figure 28). However, it was small compared to other rooms on the second floor – reaching a minimum of only 0.6°C below the lowest temperature measured at the same location in the Control House. However, the small dip coincided with peaks in family room temperature due to fireplace operation. At times the family room was up to ~7°C warmer than Bedroom 4 (Figure 29).
10 15 20 25 30 35 40 T e m p e ra tu re ( °C)
Date and Time
Air Temperature at Mid-Height in Bedroom 4 during a) Operation from 18:00 - 24:00 with continuous air circulation
Experimental House Experiment Control House Experiment
Figure 28 - Sample air temperatures in Bedroom 4, measured during fireplace condition (a)
Operation from 18:00 – 24:00 with continuous air circulation
10 15 20 25 30 35 40 T e m p e ra tu re ( °C)
Date and Time
Air Temperature comparison between Bedroom 4 and the Family Room during Year 1 Benchmarking with doors closed
Experimental House - Family Room Experimental House - Bedroom 4
Small daily dips caused by fireplace operation
Family room
temperature up to ~7°C warmer than Bedroom 2 during fireplace operation
Table 6. Average Second Floor Air Temperatures during Year 1 of the Fireplace Experiment
Bedroom 2 Average Air Temperature
°C
Bedroom 3 Average Air Temperature
°C
Bedroom 4 Average Air Temperature
°C
Mid-height Mid-height Mid-height
Exp. Control Difference Exp. Control Difference Exp. Control Difference Y1 Benchmark 21.2 21.6 -0.4 20.3 20.7 -0.4 20.1 20.4 -0.2 Y1 Benchmark – doors closed 24.1 24.6 -0.5 20.9 21.4 -0.5 18.7 18.9 -0.2 a) Continuous circulation 20.1 21.5 -1.3 20.2 20.7 -0.5 18.2 18.5 -0.2 b) No continuous circulation 23.5 24.7 -1.2 21.2 21.6 -0.5 18.7 18.9 -0.2 Bathroom
Average Air Temperature °C
Laundry Room Average Air Temperature
°C
Master Bedroom Average Air Temperature
°C
Mid-height Mid-height Mid-height
Exp. Control Difference Exp. Control Difference Exp. Control Difference Y1 Benchmark 20.8 20.9 0.0 21.2 21.5 -0.3 21.0 21.6 -0.7 Y1 Benchmark – doors closed 21.3 21.3 0.0 21.8 22.2 -0.4 21.8 22.5 -0.7 a) Continuous circulation 20.6 20.6 -0.1 21.0 21.6 -0.5 20.2 21.5 -1.2 b) No continuous circulation 21.5 21.5 0.0 22.0 22.5 -0.4 21.8 22.8 -1.1 Ensuite
Average Air Temperature °C
Mid-height
Exp. Control Difference Y1 Benchmark 21.0 21.5 -0.5 Y1 Benchmark – doors closed 22.0 22.5 -0.5 a) Continuous circulation 20.2 21.3 -1.1 b) No continuous circulation 21.8 22.8 -1.0
Table 7. Minimum Second Floor Air Temperatures During Year 1 of the Fireplace Experiment
Bedroom 2 Minimum Air Temperature
°C
Bedroom 3 Minimum Air Temperature
°C
Bedroom 4 Minimum Air Temperature
°C
Mid-height Mid-height Mid-height
Exp. Control Difference Exp. Control Difference Exp. Control Difference Y1 Benchmark 19.4 19.7 -0.4 19.2 19.5 -0.3 19.2 19.4 -0.2 Y1 Benchmark – doors closed 18.0 18.5 -0.5 19.4 19.8 -0.3 17.3 17.3 0.0 a) Continuous circulation 15.8 18.2 -2.4 18.7 19.6 -0.9 16.5 17.1 -0.6 b) No continuous circulation 17.7 19.0 -1.3 19.3 20.3 -1.1 16.6 17.1 -0.6 Bathroom
Minimum Air Temperature °C
Laundry Room Minimum Air Temperature
°C
Master Bedroom Minimum Air Temperature
°C
Mid-height Mid-height Mid-height
Exp. Control Difference Exp. Control Difference Exp. Control Difference Y1 Benchmark 19.9 19.8 0.1 20.3 20.5 -0.2 19.2 19.7 -0.5 Y1 Benchmark – doors closed 20.2 20.0 0.2 20.7 21.0 -0.3 19.4 20.1 -0.6 a) Continuous circulation 19.3 19.6 -0.3 19.8 20.8 -1.0 18.3 19.8 -1.5 b) No continuous circulation 19.8 20.4 -0.5 20.4 21.2 -0.8 19.2 20.5 -1.3 Ensuite
Minimum Air Temperature °C
Mid-height
Exp. Control Difference Y1 Benchmark 19.5 19.8 -0.3 Y1 Benchmark – doors closed 19.5 20.1 -0.6 a) Continuous circulation 18.1 19.8 -1.7 b) No continuous circulation 19.2 20.4 -1.2