The associations between QCT-based vertebral bone
measurements and prevalent vertebral fractures depend on
the spinal locations of both bone measurement and fracture
The MIT Faculty has made this article openly available.
Please share
how this access benefits you. Your story matters.
Citation
Anderson, D. E. et al. “The Associations between QCT-Based
Vertebral Bone Measurements and Prevalent Vertebral Fractures
Depend on the Spinal Locations of Both Bone Measurement and
Fracture.” Osteoporosis International 25.2 (2014): 559–566.
As Published
http://dx.doi.org/10.1007/s00198-013-2452-0
Publisher
Springer London
Version
Author's final manuscript
Citable link
http://hdl.handle.net/1721.1/104441
Terms of Use
Article is made available in accordance with the publisher's
policy and may be subject to US copyright law. Please refer to the
publisher's site for terms of use.
ORIGINAL ARTICLE
The associations between QCT-based vertebral bone
measurements and prevalent vertebral fractures depend
on the spinal locations of both bone measurement and fracture
D. E. Anderson&S. Demissie&B. T. Allaire&A. G. Bruno&
D. L. Kopperdahl&T. M. Keaveny&D. P. Kiel&M. L. Bouxsein
Received: 9 March 2013 / Accepted: 14 June 2013 / Published online: 8 August 2013 # International Osteoporosis Foundation and National Osteoporosis Foundation 2013
Abstract
Summary We examined how spinal location affects the rela-tionships between quantitative computed tomography (QCT)-based bone measurements and prevalent vertebral fractures. Upper spine (T4–T10) fractures appear to be more strongly related to bone measures than lower spine (T11–L4) fractures, while lower spine measurements are at least as strongly related to fractures as upper spine measurements.
Introduction Vertebral fracture (VF), a common injury in older adults, is most prevalent in the mid-thoracic (T7–T8) and thoracolumbar (T12–L1) areas of the spine. However, measurements of bone mineral density (BMD) are typically made in the lumbar spine. It is not clear how the associations between bone measurements and VFs are affected by the spinal locations of both bone measurements and VF. Methods A community-based case–control study includes 40 cases with moderate or severe prevalent VF and 80 age-and sex-matched controls. Measures of vertebral BMD, strength (estimated by finite element analysis), and factor of risk (load:strength ratio) were determined based on QCT scans at the L3 and T10 vertebrae. Associations were deter-mined between bone measures and prevalent VF occurring at any location, in the upper spine (T4–T10), or in the lower spine (T11–L4).
Results Prevalent VF at any location was significantly associ-ated with bone measures, with odds ratios (ORs) generally higher for measurements made at L3 (ORs=1.9–3.9) than at T10 (ORs=1.5–2.4). Upper spine fracture was associated with these measures at both T10 and L3 (ORs=1.9–8.2), while lower spine fracture was less strongly associated (ORs=1.0–2.4) and only reached significance for volumetric BMD measures at L3. Conclusions Closer proximity between the locations of bone measures and prevalent VF does not strengthen associations between bone measures and fracture. Furthermore, VF etiol-ogy may vary by region, with VFs in the upper spine more strongly related to skeletal fragility.
Keywords Biomechanics . Bone strength . Finite element analysis . Fracture prediction . Osteoporosis
Introduction
Vertebral fracture (VF) is the most common type of fracture in older adults, accounting for about 27 % of all osteoporotic
D. E. Anderson
:
B. T. Allaire:
A. G. Bruno:
M. L. Bouxsein (*) Center for Advanced Orthopaedic Studies, Beth Israel Deaconess Medical Center, 330 Brookline Avenue, RN115,Boston, MA 02215, USA
e-mail: mbouxsei@bidmc.harvard.edu D. E. Anderson
:
M. L. BouxseinDepartment of Orthopedic Surgery, Harvard Medical School, Boston, MA, USA
S. Demissie
Department of Biostatistics, Boston University School of Public Health, Boston, MA, USA
A. G. Bruno
Harvard-MIT Health Sciences and Technology Program, Cambridge, MA, USA
D. L. Kopperdahl
:
T. M. Keaveny ON Diagnostics, Berkeley, CA, USA T. M. KeavenyDepartments of Mechanical Engineering and Bioengineering, University of California, Berkeley, CA, USA
D. P. Kiel
Institute for Aging Research, Hebrew SeniorLife, Boston, MA, USA
D. P. Kiel
Department of Medicine, Harvard Medical School and Division of Gerontology, Beth Israel Deaconess Medical Center, Boston, MA, USA
fractures [1] and with a prevalence of 30–50 % among those over age 50 years [2,3]. VFs are associated with significant morbidity, including hyperkyphosis [4,5], reduced pulmo-nary function [5,6], back pain [7,8], functional limitations [8,9], and reduced quality of life [10], as well as increased mortality rates [7,11,12]. In spite of being an underdiagnosed condition [13], the direct financial burden of VFs exceeds $1 billion annually in the USA [1]. Furthermore, due to the aging of the population, annual VFs and associated costs are projected to increase by 50 % by the year 2025 [1].
Established risk factors for VF include advanced age [14–16], female sex [15], low areal bone mineral density (aBMD) [15,17], and prior fracture [15,16,18,19] among others. However, while aBMD measured by dual-energy X-ray absorptiometry (DXA) is currently the clinical gold standard for determining fracture risk, its limitations are increasingly recognized, as only about half of individuals with fractures have osteoporosis as defined by low aBMD [17,20,21]. Most spinal imaging for bone mineral density (BMD) measurement is done in the lumbar spine (i.e., L1 to L4 level), as the overlying ribcage prevents the use of DXA to determine aBMD in the thoracic spine. However, vertebral fractures are not restricted to this area. Furthermore, VF prevalence varies by vertebral level, with peaks in prevalence occurring in the mid-thoracic (T7–T8) and thoracolumbar junction (T12–L1) regions of the spine [14, 15, 22]. The reasons for this bimodal distribution of fractures regionally along the spine remain largely unknown. It has been suggested that“biomechanical factors,” such as thoracic kyphosis and the stiffness of the rib cage predispose these areas to fracture by increasing vertebral loading in these locations [14,23,24]. On the other hand, a previous study of older women found that incident fractures in the upper spine (T4–T10) were more strongly associated with both lumbar aBMD and the presence of prevalent VFs than were incident fractures in the lower spine (T12–L4) [22]. This suggests that skeletal fragility is a stronger risk factor for upper spine VFs than lower spine VFs. However, further biomechanical or epidemiological analyses investigating whether mid-thoracic and thoracolumbar VFs have similar or different etiologies are lacking. Furthermore, it remains unclear whether the associations of bone measure-ments with VF depend on the location of bone measurement in addition to the location of VF.
The purpose of this study was to determine whether the associations between prevalent VF and radiographically based bone measures, including BMD, vertebral strength estimated by finite element analysis (FEA), and factor of risk (load to strength ratio) vary with the spinal region of fracture and with the vertebral level of measurement. We hypothesized that bone measures at T10 would be more strongly associated with prevalent VF in the upper spine region (defined as T4–T10) than corresponding measures at L3. We further hypothesized that prevalent VF in the upper
spine region would be more strongly associated with bone measures at either T10 or L3 than prevalent VF in the lower spine region (defined as T11–L4).
Materials and methods Participants
We performed a case–control study using participants select-ed from 3,479 individuals who underwent a quantitative computed tomography (QCT) scan of the trunk as part of the Framingham Heart Study Offspring and Third Genera-tion Multidetector CT Study [25]. Prevalent VF was diag-nosed by radiologists from the QCT scan lateral scout views using the semiquantitative technique of Genant et al. [26]. This method was previously validated [27] and has excellent inter- and intra-reader agreement in evaluating moderate/ severe prevalent VF (semiquantitative grade≥2). Cases in-cluded 40 participants ages 50 and older (22 men, 18 women, mean age 68±9 years) with one or more moderate or severe prevalent VF, excluding individuals with fractures at L3. Prevalent VF in vertebral levels T4–T10 were classified as upper spine fractures, while prevalent VF in levels T11–L4 were classified as lower spine fractures, similar to the re-gional classification used for incident VF by Nevitt et al. [22]. Eighty age- and sex-matched (2:1 matching) controls were randomly selected from individuals with no prevalent VF. This study was approved by the Institutional Review Boards of Beth Israel Deaconess Medical Center, Hebrew SeniorLife, and Boston University.
Bone measurements from QCT
As previously reported [25,28], volumetric QCT scans were acquired using an eight slice multidetector CT machine (Lightspeed Ultra, General Electric, Milwaukee, WI) at a tube voltage of 120 kVp and tube current of 320 mA (400 mA for subjects with body weight >220 lb). Scans had an in-plane pixel size of 0.68 by 0.68 mm and slice thickness of 2.5 mm. Each subject underwent two scans at the same visit: a chest scan, which included approximately vertebral levels T7–T11 and an abdominal scan, which in-cluded approximately vertebral levels L2–L5. An external hydroxyapatite phantom (Image Analysis, Inc., Lexington, KY) was scanned with each subject to allow conversion of CT Hounsfield units to equivalent mineral density.
Integral (IntBMD), trabecular (TbBMD), and peripheral (PeBMD) volumetric BMD and cross-sectional area (CSA) at the midsection of the vertebral bodies, as well as simulated DXA measurements of posterior–anterior vertebral aBMD [29] were determined from QCT scans at vertebral levels T10 and L3. Trabecular BMD was calculated by virtually
removing the outer 2 mm of the vertebral body, which includes the cortical shell, and determining the average BMD of the remaining trabecular bone. Similarly, peripheral BMD was the average BMD of the outer 2 mm layer of bone. In subjects where the desired level had a prevalent VF, morphometric abnormality, or was missing from the scan, the measurements (including FEA) were made at T9 (15 subjects) or T11 (two subjects) instead of T10 and L4 (one subject) instead of L3.
QCT-based FEA to estimate vertebral strength
We employed QCT-based FEA to estimate vertebral com-pressive strength variables. These analyses were performed by ON Diagnostics (Berkeley, CA) using previously pub-lished methods [30,31]. All FEA analysts were blinded to subject fracture status (case or control). Briefly, each CT image was first density calibrated using the external phantom and the vertebra of interest was then segmented from the surrounding tissue using a constant threshold value. The vertebra image was spatially resampled to a voxel size of 1×1×1 mm3voxels, rotated into a standard coordinate sys-tem, and cropped to remove the posterior elements from the vertebral body. A voxel-based finite element mesh was cre-ated by converting each voxel into a 1×1×1 mm3eight-node cube-shaped element. Element-specific material properties were assigned based on the volumetric BMD within each element [32], and the resulting vertebral models were then virtually loaded to failure via uniform compressive loading applied to the endplates [31]. Compressive strength, defined as the total reaction force generated at an imposed overall deformation equivalent to 1.9 % strain [31], was calculated by nonlinear finite element analysis. Biomechanical testing of 52 elderly cadaveric vertebral bodies found this approach for estimating vertebral strength to be highly correlated (r2=0.85) with experimentally measured values [31]. Tra-becular strength (TbStrength) was the strength estimated with the outer 2 mm layer of the vertebral body removed, and peripheral strength (PeStrength) was the difference be-tween total strength and trabecular strength.
Factor of risk
The factor of risk,Φ, was calculated as the ratio of estimated compressive loading to the FEA-estimated vertebral com-pressive strength. In theory, a factor of risk greater than one would indicate that the applied force exceeds bone strength, implying a high risk of VF [33]. Vertebral compressive loading at T10 and L3 was estimated using a musculoskeletal model of the thoracolumbar spine [34]. Specifically, loading was estimated for two quasi-static loading conditions: (1) standing with 75° forward flexion while holding 20 kg in the hands (Φbend) and (2) standing with 30° forward flexion and
30° of axial rotation (twist) while holding 20 kg in the hands (Φtwist).
Data analysis
Standard descriptive statistics were computed and variable distributions checked. Conditional logistic regressions were performed to determine the association between prevalent VF and IntBMD, TbBMD, and PeBMD volumetric bone den-sity and simulated aBMD; vertebral body CSA, total (Strength), trabecular (TbStrength), and peripheral (PeStrength) strength estimated by QCT-FEA; and the factor of risk estimates. Odds ratios (and 95 % confidence intervals) for prevalent VF were calculated for bone measurements at T10 and L3 vertebrae, for all prevalent VF, upper spine (T4–T10) VF, and lower spine (T11–L4) VF. Statistical analyses were performed in SAS (SAS Institute Inc., Cary, NC, USA) with significance set atα =0.05.
Results
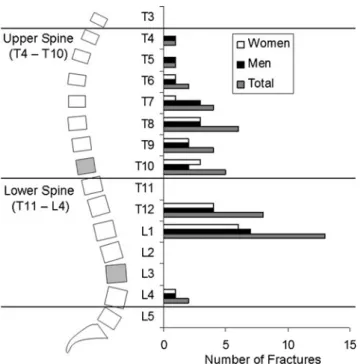
Cases did not differ from controls in terms of height, body mass, or BMI (Table1). Among the 40 cases, 17 had prev-alent VF in the upper spine region, 20 had prevprev-alent VF in the lower spine region, and 3 had prevalent VF in both regions. There were a total of 46 prevalent VF, 23 in the upper spine region, and 23 in the lower spine region, primar-ily at T12 and L1 (Fig. 1). Furthermore, the pattern of VF prevalence and proportion of fractures in each spinal region was similar in men and women and the sexes were combined in the analyses.
For measurements made at L3, cases had lower volumet-ric BMD and strength and higher factor of risk than controls (p <0.05, Table 2). Measurements made at T10 showed similar relationships between cases and controls, but the differences were only significant for IntBMD and TbBMD (p <0.05). Estimated aBMD was lower in cases, but did not reach significance at either T10 (p =0.15) or L3 (p =0.07). However, vertebral CSA was larger in cases than controls at T10 (p =0.03) and approached significance at L3 (p =0.07). When examining the association of any VF with bone measures, odds ratios (OR, per 1 SD decline) for L3 density,
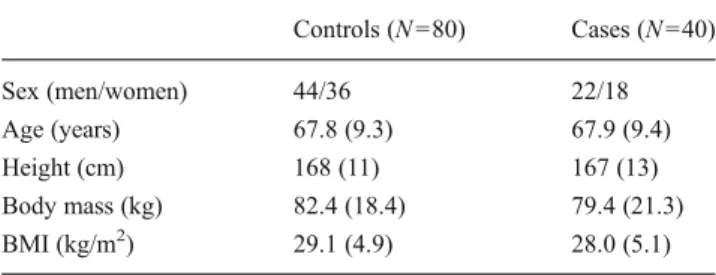
Table 1 Mean (SD) participant characteristics for cases and controls
Controls (N =80) Cases (N =40) Sex (men/women) 44/36 22/18 Age (years) 67.8 (9.3) 67.9 (9.4) Height (cm) 168 (11) 167 (13) Body mass (kg) 82.4 (18.4) 79.4 (21.3) BMI (kg/m2) 29.1 (4.9) 28.0 (5.1)
strength, and factor of risk measures ranged from 1.9–3.9 and were all significant, while ORs for T10 density, strength, and factor of risk measures ranged from 1.5–2.4 and did not all reach significance (Table3). When examining only upper spine VFs, density measures at L3 (ORs of 2.8–5.6) were all significant, while density measures at T10 had similar asso-ciations (ORs of 2.1–4.3) and all reached significance except
for PeBMD. However, associations for strength and factor of risk measures at T10 (ORs of 1.9–2.3) did not reach signif-icance, while associations for strength and factor of risk measures at L3 (ORs of 5.9–8.4) were larger in magnitude and all reached significance. When examining only lower spine VFs, density, strength, and factor of risk measures at T10 showed no significant associations (ORs of 1.0–1.7), and while ORs were of larger magnitude for measures at L3 (ORs of 1.5–2.4), only IntBMD, TbBMD, and PeBMD reached significance. Prevalent VF at any location was as-sociated with larger vertebral CSA at both T10 (OR=0.49) and L3 (OR=0.45). T10 CSA was significantly associated with upper spine fractures (OR=0.16), but not lower spine fractures (OR=0.99). L3 CSA did not reach significance when looking at only upper spine fractures (OR=0.45) or lower spine fractures (OR =0.49). The results and trends were largely the same when ORs were adjusted for height and body mass.
Discussion
In this study, we examined how the associations between prevalent VF and QCT-based bone measures (BMD, CSA, FEA-based vertebral strength, and factor of risk) vary with the vertebral level of measurement and with the spinal region of fracture. Contrary to our hypothesis, prevalent VFs throughout the spine appear to be at least as strongly associ-ated with bone density, strength, and factor of risk measures at L3 as with similar measures at T10. In fact, although density measures at T10 and L3 appear to have similar associations with prevalent upper spine fractures, strength and factor of risk measures at L3 appeared to be more strongly associated with prevalent upper spine fractures than similar measures at T10. In our sample, T10 was on average closer to the levels of fracture than L3 (2.5 levels vs. 4.7
Fig. 1 In this study, the upper spine region was defined as vertebral levels T4–T10 and the lower spine region as T11–L4. QCT-based bone measures were made at T10 and L3 (shaded vertebral levels). Prevalent moderate/severe vertebral fractures were classified based on the region in which they occurred. The distribution of 46 prevalent vertebral fractures in 40 cases in this study (right) was consistent with previous reports, with highest prevalence occurring around the mid-thoracic spine (T7–T8) and thoracolumbar junction (T12–L1). Men and women displayed similar prevalence patterns and were combined in the analyses
Table 2 Mean (SD) measures of bone density, CSA, strength, and factor of risk evaluated at levels T10 and L3 for controls (N =80) and cases (N =40)
*p <0.05 (significantly different than controls)
T10 L3
Measurement Controls Cases Controls Cases
IntBMD (mg/cm3) 210 (52) 187 (45)* 198 (51) 168 (38)* TbBMD (mg/cm3) 183 (51) 158 (43)* 172 (51) 142 (38)* PeBMD (mg/cm3) 262 (55) 242 (52) 260 (51 232 (40)* aBMD (g/cm2) 0.95 (0.25) 0.88 (0.28) 1.16 (0.29) 1.05 (0.27) CSA (cm2) 10.5 (1.9) 11.3 (2.1)* 13.3 (2.2) 14.3 (2.9) Strength (kN) 6.95 (3.02) 5.98 (2.63) 8.52 (3.83) 6.93 (2.86)* TbStrength (kN) 3.85 (1.82) 3.32 (1.62) 4.43 (2.24) 3.55 (1.89)* PeStrength (kN) 3.10 (1.27) 2.66 (1.09) 4.09 (1.72) 3.38 (1.08)* Φbend 0.14 (0.06) 0.15 (0.05) 0.40 (0.13) 0.49 (0.23)* Φtwist 0.16 (0.07) 0.18 (0.07) 0.26 (0.08) 0.32 (0.15)* 562 Osteoporos Int (2014) 25:559–566
levels away). Thus, an overall closer proximity of the mea-sured level to the fractured level does not equate to a stronger association with prevalent VF. Furthermore, the results indi-cate that current clinical measures of bone, which are gener-ally acquired in the lumbar vertebrae, are at least as strongly associated with prevalent VF as measures taken at other spinal levels. Thus, this does not suggest any need to alter current clinical practice in terms of the location used to measure vertebral bone density or strength. However, it is unclear why bone measures at L3 appear to have stronger associations with prevalent VF than measures at T10. One possibility is that the larger, stronger L3 level is more prone to age-related declines in strength and density or such de-clines are more easily detectable at L3 using current tech-niques. Further study is needed to explore these possibilities. Prevalent fractures in the upper spine region appear to be more strongly associated with QCT-based bone measure-ments than fractures in the lower spine region, similar to previous findings relating lumbar aBMD and incident frac-tures in older women [22]. This regional difference likely indicates that fractures in the two regions have some as yet undetermined differences in their etiology, which could help explain the phenomenon that vertebral fracture prevalence is not uniform across vertebral levels, but highest around T7– T8 and T12–L1. The apparently stronger associations of
bone measurements with prevalent and incident fractures in the upper spine suggest that upper spine fractures are more directly related to skeletal fragility than lower spine frac-tures, while some other factor or factors contribute to the risk of lower spine fractures. For example, impact from a back-wards fall could preferentially load the lower spine, account-ing for many vertebral fractures that occur in this region. Supporting this possibility, a retrospective analysis of 562 patients with traumatic VF (mean age 43.8 years, range 6– 100 years) found that 67.6 % of traumatic VF caused by falls occurred in vertebral levels T11–L2 [35]. Furthermore, low energy falls were the most common cause of traumatic VF in patients older than 60 and 65.8 % of traumatic VF caused by low energy falls occurred in vertebral levels T11–L2 [35]. About four out of five traumatic VF in older adults are due to falls [35,36], and about two out of five total incident VF in older adults are known to be caused by falls [37,38], the majority low energy falls from standing height or less. Thus, it seems likely that falls are a significant factor in causing lower spine VF in older adults, but there is a need for further study of how falling affects vertebral loading throughout the spine and whether falls are the primary cause of the T12–L1 peak in fracture prevalence and incidence in older adults.
In a somewhat counterintuitive outcome, smaller vertebral CSA was associated with decreased risk of prevalent vertebral
Table 3 Associations of bone measurements at T10 and L3 with prevalent moderate/severe vertebral fractures by fracture location. OR (95 % CI, per 1SD decrease) are shown for combined group (all fracture locations), upper spine fractures (T4–T10) and lower spine fractures (T11–L4). ORs in italics are significant (p <0.05)
a
Per 1 SD increase
All fractures Upper spine fractures Lower spine fractures
(40 cases, 80 controls) (17 cases, 34 controls) (20 cases, 40 controls) Measurements at T10 IntBMD 2.1 (1.2–3.7) 3.4 (1.2–9.7) 1.4 (0.7–2.9) TbBMD 2.4 (1.3–4.3) 4.3 (1.3–14.6) 1.6 (0.7–3.3) PeBMD 1.7 (1.0–2.8) 2.1 (0.9–4.6) 1.3 (0.6–2.5) aBMD 1.6 (0.9–2.8) 2.7 (1.0–7.1) 1.0 (0.5–2.1) CSA 0.49 (0.28–0.83) 0.16 (0.04–0.58) 0.99 (0.46– 2.11) Strength 1.9 (1.0– 3.3) 2.0 (0.8–4.9) 1.6 (0.7–3.5) TbStrength 1.7 (1.0–3.1) 1.9 (0.7–4.6) 1.5 (0.7–3.1) PeStrength 1.9 (1.1–3.3) 2.0 (0.8–4.8) 1.7 (0.8–3.6) Φbenda 1.5 (1.0–2.5) 2.1 (1.0–4.6) 1.2 (0.7–2.2) Φtwista 1.6 (1.0–2.6) 2.3 (1.0–5.3) 1.2 (0.7–2.3) Measurements at L3 IntBMD 3.4 (1.7–6.8) 5.3 (1.3–21.0) 2.3 (1.1–5.1) TbBMD 3.4 (1.7–6.9) 5.6 (1.3–23.4) 2.4 (1.1–5.2) PeBMD 3.2 (1.6–6.2) 3.7 (1.2–12.1) 2.4 (1.1–5.3) aBMD 1.9 (1.1–3.3) 2.8 (1.0–8.0) 1.5 (0.7–3.0) CSA 0.45 (0.25–0.83) 0.45 (0.20–1.03) 0.49 (0.20–1.18) Strength 3.0 (1.4–6.9) 8.2 (1.2–57.8) 1.9 (0.7–3.5) TbStrength 2.5 (1.2–5.3) 6.2 (1.2–32.9) 1.7 (0.7–3.9) PeStrength 3.9 (1.6–10.0) 8.4 (1.0–67.8) 2.2 (0.9–5.5) Φbenda 2.5 (1.4–4.7) 5.9 (1.5–23.3) 1.7 (0.9–3.5) Φtwista 2.5 (1.4–4.8) 6.0 (1.5–24.0) 1.8 (0.9–3.6)
fracture. However, vertebral CSA is positively associated with vertebral strength [39] and previous studies have reported that vertebral size was smaller in those with vertebral fractures than those without, although most were based on 2D methods rather than CT scans [40]. On the other hand, vertebral cross-sectional area is higher in older adults compared to young adults, presumably due to age-related periosteal apposition [41]. However, this increased vertebral size in older adults does not overcome profoundly decreased bone density, as BMD is more strongly correlated with vertebral strength than CSA [39] and older adults have markedly lower vertebral strength than young adults [30]. Perhaps among older adults, those with lower bone strength have greater stimulus for periosteal expansion than those with adequate bone strength, which may result in higher vertebral CSA despite lower bone strength. Another possibility is that vertebral CSA is associ-ated with VF in a way that is distinct from vertebral strength, such as by affecting vertebral loading. Clearly, additional study is needed to clarify the role of vertebral size in the risk of VF.
This study has several limitations, most notably its rela-tively small sample size and examination of prevalent VFs. While our results suggest a stronger association of bone measurements with upper spine VFs than lower spine VFs and a stronger association of VFs in any location with L3 bone measurements than T10 bone measurements, the con-fidence intervals of the ORs overlap and we cannot make meaningful statistical comparisons between them because of the small number of cases available. Only prevalent VF data were available in the study sample, limiting the conclusions that could be drawn with respect to estimating the risk of incident VF. Additionally, assessment of prevalent fracture using morphometric methods is subject to error, which may vary with spinal region. The reliability of fracture assessment is lower in the upper thoracic spine than in the lumbar spine, but is excellent when considering only moderate/severe frac-tures [27]. Thus, we chose to examine only moderate/severe prevalent fractures, reducing the effects of potential errors in fracture assessment and potentially increasing the relevance of the findings to fracture risk, as moderate/severe prevalent VF tend to be more strongly associated with future VF than mild prevalent VF [42,43]. The definitions of spinal regions used are somewhat arbitrary, but provide a logical separation between the two widely reported peaks in fracture preva-lence and are consistent with the primary groupings used by Nevitt et al. [22]. Similarly, our selection of T10 and L3 as the levels for bone analysis is somewhat arbitrary, but corre-sponds to a common location for clinical imaging (L3) and a level central to the most common locations of VFs and present in the QCT scans of most subjects in this study (T10). Furthermore, we selected the levels for bone analysis so they would not correspond to the peaks in fracture prev-alence reported in the literature (i.e., T7–T8 and T12–L1), as
valid analysis of the QCT-based bone measures used here cannot be performed on a vertebral body with a prevalent fracture. Finally, as only two measurement locations were examined, we cannot make any conclusions regarding pos-sible associations between VF and bone measures made elsewhere, such as higher in the thoracic spine.
This study provides a unique examination of the depen-dence of associations between vertebral bone measures and prevalent VF on the location of both measurement and frac-ture in a community-based population of men and women. The findings suggest that closer proximity between the level of bone measures and the level of fracture does not strengthen associations with prevalent fracture, and that bone measures in the lumbar spine, used clinically based on convenience of measurement, are as good as or better than measures taken elsewhere. Furthermore, this study supports the concept that VF in the lower spine and upper spine has significantly different etiologies. Altogether, these findings provide signif-icant motivation for further study of how well bone measures predict VF risk in different spinal regions and whether VF etiology varies by spinal region. Better understanding of these issues could lead to improved prediction and prevention of VF in older adults.
Acknowledgments This study was funded by grants from the National Institutes of Health (R01AR053986, R01AR/AG041398, T32AG023480, and F31AG041629) and by the National Heart, Lung, and Blood Institute (NHLBI) Framingham Heart Study (NIH/NHLBI Contract N01-HC-25195). The contents are solely the responsibility of the authors, and do not necessarily represent the views of the NIH.
Conflicts of interest DLK is an employee of and has equity interest in O.N. Diagnostics; TMK has equity interest in O.N. Diagnostics; DPK has served as a consultant for Amgen, Novartis, Eli Lilly and Merck, and has received grant funding from Amgen and Merck. All other authors state they have nothing to disclose.
Funding support NIH (R01AR053986, R01AR/AG041398, T32AG023480, and F31AG041629) and National Heart, Lung, and Blood Institute (NHLBI) Framingham Heart Study (NIH/NHLBI Contract N01-HC-25195).
References
1. Burge R, Dawson-Hughes B, Solomon DH, Wong JB, King A, Tosteson A (2007) Incidence and economic burden of osteoporosis-related fractures in the United States, 2005–2025. J Bone Miner Res 22(3):465–475. doi:10.1359/jbmr.061113
2. Melton LJ 3rd, Kan SH, Frye MA, Wahner HW, O’Fallon WM, Riggs BL (1989) Epidemiology of vertebral fractures in women. Am J Epidemiol 129(5):1000–1011
3. Melton LJ 3rd, Lane AW, Cooper C, Eastell R, O’Fallon WM, Riggs BL (1993) Prevalence and incidence of vertebral deformities. Osteoporos Int 3(3):113–119
4. Kado DM, Huang MH, Karlamangla AS, Cawthon P, Katzman W, Hillier TA, Ensrud K, Cummings SR (2013) Factors associated with kyphosis progression in older women: 15 years’ experience
in the study of osteoporotic fractures. J Bone Miner Res 28(1):179– 187. doi:10.1002/jbmr.1728
5. Lombardi I Jr, Oliveira LM, Mayer AF, Jardim JR, Natour J (2005) Evaluation of pulmonary function and quality of life in wom-en with osteoporosis. Osteoporos Int 16(10):1247–1253. doi:10. 1007/s00198-005-1834-3
6. Schlaich C, Minne HW, Bruckner T, Wagner G, Gebest HJ, Grunze M, Ziegler R, Leidig-Bruckner G (1998) Reduced pulmonary func-tion in patients with spinal osteoporotic fractures. Osteoporos Int 8(3):261–267
7. Hasserius R, Karlsson MK, Jonsson B, Redlund-Johnell I, Johnell O (2005) Long-term morbidity and mortality after a clinically diagnosed vertebral fracture in the elderly—a 12- and 22-year follow-up of 257 patients. Calcif Tissue Int 76:235–242
8. Nevitt MC, Ettinger B, Black DM, Stone K, Jamal SA, Ensrud K, Segal M, Genant HK, Cummings SR (1998) The association of radiographically detected vertebral fractures with back pain and function: a prospective study. Ann Intern Med 128(10):793–800 9. Pluijm SM, Tromp AM, Smit JH, Deeg DJ, Lips P (2000)
Consequences of vertebral deformities in older men and women. J Bone Miner Res 15(8):1564–1572. doi:10.1359/jbmr.2000.15.8. 1564
10. Salaffi F, Cimmino MA, Malavolta N, Carotti M, Di Matteo L, Scendoni P, Grassi W (2007) The burden of prevalent fractures on health-related quality of life in postmenopausal women with oste-oporosis: the IMOF study. J Rheumatol 34(7):1551–1560 11. Hasserius R, Karlsson MK, Nilsson BE, Redlund-Johnell I, Johnell
O (2003) Prevalent vertebral deformities predict increased mortality and increased fracture rate in both men and women: a 10-year population-based study of 598 individuals from the Swedish cohort in the European Vertebral Osteoporosis Study. Osteoporos Int 14(1):61–68
12. Kado DM, Duong T, Stone KL, Ensrud KE, Nevitt MC, Greendale GA, Cummings SR (2003) Incident vertebral fractures and mortality in older women: a prospective study. Osteoporos Int 14:589–594 13. Delmas PD, van de Langerijt L, Watts NB, Eastell R, Genant H,
Grauer A, Cahall DL (2005) Underdiagnosis of vertebral fractures is a worldwide problem: the IMPACT study. J Bone Miner Res 20(4):557–563. doi:10.1359/JBMR.041214
14. Ismail AA, Cooper C, Felsenberg D, Varlow J, Kanis JA, Silman AJ, O’Neill TW (1999) Number and type of vertebral deformities: epidemiological characteristics and relation to back pain and height loss. European Vertebral Osteoporosis Study Group. Osteoporos Int 9(3):206–213
15. Van der Klift M, De Laet CE, McCloskey EV, Hofman A, Pols HA (2002) The incidence of vertebral fractures in men and women: the Rotterdam Study. J Bone Miner Res 17(6):1051–1056. doi:10. 1359/jbmr.2002.17.6.1051
16. Nevitt MC, Cummings SR, Stone KL, Palermo L, Black DM, Bauer DC, Genant HK, Hochberg MC, Ensrud KE, Hillier TA, Cauley JA (2005) Risk factors for a first-incident radiographic vertebral fracture in women>or=65 years of age: the study of osteoporotic fractures. J Bone Miner Res 20(1):131–140
17. Stone KL, Seeley DG, Lui LY, Cauley JA, Ensrud K, Browner WS, Nevitt MC, Cummings SR (2003) BMD at multiple sites and risk of fracture of multiple types: long-term results from the Study of Osteoporotic Fractures. J Bone Miner Res 18(11):1947–1954. doi:10.1359/jbmr.2003.18.11.1947
18. Klotzbuecher CM, Ross PD, Landsman PB, Abbott TA 3rd, Berger M (2000) Patients with prior fractures have an increased risk of future fractures: a summary of the literature and statistical synthe-sis. J Bone Miner Res 15(4):721–739
19. Lindsay R, Silverman SL, Cooper C, Hanley DA, Barton I, Broy SB, Licata A, Benhamou L, Geusens P, Flowers K, Stracke H, Seeman E (2001) Risk of new vertebral fracture in the year follow-ing a fracture. JAMA 285(3):320–323
20. Schuit SC, van der Klift M, Weel AE, de Laet CE, Burger H, Seeman E, Hofman A, Uitterlinden AG, van Leeuwen JP, Pols HA (2004) Fracture incidence and association with bone mineral density in elderly men and women: the Rotterdam Study. Bone 34(1):195–202
21. Schuit S, van der Klift M, Weel A, De Laet C, Burger H, Seeman E, Hofman A, Uitterlinden AG, van Leeuwen J, Pols H (2006) Corridendum to "Fracture incidence and association with bone min-eral density in elderly men and women: the Rotterdam Study". Bone 38:603
22. Nevitt MC, Ross PD, Palermo L, Musliner T, Genant HK, Thompson DE (1999) Association of prevalent vertebral fractures, bone density, and alendronate treatment with incident vertebral fractures: effect of number and spinal location of fractures. The Fracture Intervention Trial Research Group. Bone 25(5):613– 619
23. Melton LJ 3rd, Chao EYS, Lane JM (1988) Biomechanical aspects of fractures. In: Riggs BL, Melton LJ 3rd (eds) Osteoporosis: etiology, diagnosis and management. Raven, New York, pp 111–132 24. Cooper C, O’Neill T, Silman A (1993) The epidemiology of
verte-bral fractures. European Verteverte-bral Osteoporosis Study Group. Bone 14(Suppl 1):S89–97
25. Hoffmann U, Massaro JM, Fox CS, Manders E, O’Donnell CJ (2008) Defining normal distributions of coronary artery calcium in women and men (from the Framingham Heart Study). Am J Cardiol 102(9):1136–1141. doi:10.1016/j.amjcard.2008.06.038
26. Genant HK, Wu CY, van Kuijk C, Nevitt MC (1993) Vertebral fracture assessment using a semiquantitative technique. J Bone Miner Res 8(9):1137–1148. doi:10.1002/jbmr.5650080915
27. Samelson EJ, Christiansen BA, Demissie S, Broe KE, Zhou Y, Meng CA, Yu W, Cheng X, O’Donnell CJ, Hoffmann U, Genant HK, Kiel DP, Bouxsein ML (2011) Reliability of vertebral fracture assessment using multidetector CT lateral scout views: the Framingham Osteoporosis Study. Osteoporos Int 22(4):1123–1131. doi:10.1007/s00198-010-1290-6
28. Samelson EJ, Christiansen BA, Demissie S, Broe KE, Louie-Gao Q, Cupples LA, Roberts BJ, Manoharam R, D’Agostino J, Lang T, Kiel DP, Bouxsein ML (2012) QCT measures of bone strength at the thoracic and lumbar spine: the Framingham Study. J Bone Miner Res 27(3):654–663. doi:10.1002/jbmr.1482
29. Lang TF, Li J, Harris ST, Genant HK (1999) Assessment of vertebral bone mineral density using volumetric quantitative CT. J Comput Assist Tomogr 23(1):130–137
30. Christiansen BA, Kopperdahl DL, Kiel DP, Keaveny TM, Bouxsein ML (2011) Mechanical contributions of the cortical and trabecular compartments contribute to differences in age-related changes in vertebral body strength in men and women assessed by QCT-based finite element analysis. J Bone Miner Res 26(5):974– 983. doi:10.1002/jbmr.287
31. Wang X, Sanyal A, Cawthon PM, Palermo L, Jekir M, Christensen J, Ensrud KE, Cummings SR, Orwoll E, Black DM, Keaveny TM (2012) Prediction of new clinical vertebral fractures in elderly men using finite element analysis of CT scans. J Bone Miner Res 27(4):808–816. doi:10.1002/jbmr.1539
32. Crawford RP, Cann CE, Keaveny TM (2003) Finite element models predict in vitro vertebral body compressive strength better than quantitative computed tomography. Bone 33(4):744–750 33. Bouxsein ML, Melton LJ 3rd, Riggs BL, Muller J, Atkinson EJ,
Oberg AL, Robb RA, Camp JJ, Rouleau PA, McCollough CH, Khosla S (2006) Age- and sex-specific differences in the factor of risk for vertebral fracture: a population-based study using QCT. J Bone Miner Res 21(9):1475–1482
34. Iyer S, Christiansen BA, Roberts BJ, Valentine MJ, Manoharan RK, Bouxsein ML (2010) A biomechanical model for estimating loads on thoracic and lumbar vertebrae. Clin Biomech (Bristol, Avon) 25(9):853–858. doi:10.1016/j.clinbiomech.2010.06.010
35. Leucht P, Fischer K, Muhr G, Mueller EJ (2009) Epidemiology of traumatic spine fractures. Injury 40(2):166–172. doi:10.1016/j.injury. 2008.06.040
36. Oudshoorn C, Hartholt KA, Zillikens MC, Panneman MJ, van der Velde N, Colin EM, Patka P, van der Cammen TJ (2012) Emergency department visits due to vertebral fractures in the Netherlands, 1986–2008: steep increase in the oldest old, strong association with falls. Injury 43(4):458–461. doi:10.1016/j.injury. 2011.09.014
37. Cooper C, Atkinson EJ, O’Fallon WM, Melton LJ 3rd (1992) Incidence of clinically diagnosed vertebral fractures: a population-based study in Rochester, Minnesota, 1985–1989. J Bone Miner Res 7(2):221–227
38. Freitas SS, Barrett-Connor E, Ensrud KE, Fink HA, Bauer DC, Cawthon PM, Lambert LC, Orwoll ES (2008) Rate and circum-stances of clinical vertebral fractures in older men. Osteoporos Int 19(5):615–623. doi:10.1007/s00198-007-0510-1
39. Edmondston SJ, Singer KP, Day RE, Price RI, Breidahl PD (1997) Ex vivo estimation of thoracolumbar vertebral body compressive
strength: the relative contributions of bone densitometry and verte-bral morphometry. Osteoporos Int 7(2):142–148
40. Ruyssen-Witrand A, Gossec L, Kolta S, Dougados M, Roux C (2007) Vertebral dimensions as risk factor of vertebral fracture in osteoporotic patients: a systematic literature review. Osteoporos Int 18(9):1271–1278. doi:10.1007/s00198-007-0356-6
41. Riggs BL, Melton LJ 3rd, Robb RA, Camp JJ, Atkinson EJ, Peterson JM, Rouleau PA, McCollough CH, Bouxsein ML, Khosla S (2004) Population-based study of age and sex differences in bone volumetric density, size, geometry, and structure at different skeletal sites. J Bone Miner Res 19(12):1945–1954. doi:10.1359/JBMR.040916
42. Delmas PD, Genant HK, Crans GG, Stock JL, Wong M, Siris E, Adachi JD (2003) Severity of prevalent vertebral fractures and the risk of subsequent vertebral and nonvertebral fractures: results from the MORE trial. Bone 33(4):522–532
43. Roux C, Fechtenbaum J, Kolta S, Briot K, Girard M (2007) Mild prevalent and incident vertebral fractures are risk factors for new fractures. Osteoporos Int 18(12):1617–1624. doi: 10.1007/s00198-007-0413-1