ORIGINAL ARTICLE
Interactive Visual Media for Geomorphological Heritage
Interpretation. Theoretical Approach and Examples
Simon MartinReceived: 12 June 2012 / Accepted: 28 February 2014 / Published online: 26 March 2014 # The European Association for Conservation of the Geological Heritage 2014
Abstract Based on the argument that understanding is a key for raising awareness about geoheritage among non-specialists, this paper presents specific techniques for the interpretation of geomorphological features through the use of interactive visual media. It focuses on the use of interactive functions to go beyond the design or cartographic limits of classic visual media with the aid of interactivity, multimedia, and animation. The effects of these numerical technologies on learning are also discussed following results in media and cognitive psychology. To exemplify how technologies like interactivity or multimedia extend the possible uses of schemes and maps for geo-interpretation, three original web applications are presented. They are mash-ups (web applica-tion hybrid) of several tools such as web mapping, interactive vector drawing, animated schemes, pictures, etc. Each appli-cation also has a different level of interactivity and follows a specific educative approach, namely explanation, experimen-tation or exploration. This paper focuses only on the media part of interpretation. In order to follow a global approach of interpretation (presented in this paper), other aspects should be taken into account, in particular audience and message issues. In the second stage of the research, the use and appreciation of the web application will be tested by different audiences. For this purpose, a user tracking system has been implemented in the applications that will supplement the data obtained by questionnaires.
Keywords Interpretation . Learning . Visual media . Interactivity . Multimedia . Web mapping . Web application
Introduction
Site Interpretation as a Key for Geoheritage Promotion Geoheritage does not exist per se, but is to be considered as a cultural construct. Sites, landforms or outcrops become part of geoheritage because values are assigned to them and a need of conservation is expressed. Di Méo (2008) describes the pro-cess of heritage construction in the following five (not neces-sarily chronologic) stages: (1) realisation, (2) discussion and decision, (3) inventory and selection, (4) protection, and (5) exhibition and promotion. Progress and duration of this pro-cess vary strongly according to the people involved (Portal 2010). Geoheritage is mostly recognised by geoscientists, but is less considered by the public and the political authorities.
To ensure a wider recognition of geological and geomor-phological features as heritage, all stages of heritage construc-tion should be supported by a specific communicaconstruc-tion be-tween specialists and non-specialists (Fig.1). The first step in this process is to raise the people’s understanding of natural features. The concept of geo-interpretation, related to classic interpretation (Tilden and Craig1977), has been defined as “the art or science of determining and then communicating the meaning or significance of a geological or geomorphological phenomenon, event or location” (Hose2012).
An increasing number of interpretive and tourist products is now developed by geoscientists in an attempt to communi-cate with non-specialists. However, specific research on methods for geo-interpretation and on the impact of geotourist products (interpretive trails and signs, guided tours) is still not widespread (for example Cayla et al. 2010; Megerle 2003, 2008; Sellier2009) and should be encouraged.
Unfortunately, as stated by Migoń (2009), “geomorpholo-gy is in too many instances not properly explained”. In fact, interpretation should help change people’s conceptions on natural processes and landforms, in order to “engender
S. Martin (*)
Institute of Geography and Sustainability, University of Lausanne, Bâtiment Géopolis, 1015 Lausanne, Switzerland
e-mail: [email protected] URL:http://mesoscaphe.unil.ch/smartin/
concern for a geosite and empathy for geoconservation” (Hose 2012). This goal can only be achieved if the interpretive content and design match the interests, conceptions and ques-tions of the audience, in a constructivist approach, as teaching with methods related to empirism or behaviourism exclusively does not produce good results in natural sciences education (Giordan and de Vecchi2010). The approach has to be more interactive than transferral, and the audience should be given a leading role.
Several educational projects have been carried out, using fieldwork (for example Bollati et al.2011; Boyle et al.2007), laboratory workshops (Haigh and Kilmartin1987) or digital tools (Allen2008) to teach some geomorphological concepts to children at school. In countries where geomorphology is not a subject taught in school, and in order to reach the adult audience, informal education—like on the field of geo-interpretation— is of greatest importance.
Aims and Methods
This paper presents several theoretical issues concerning the use of interactive visual media in the frame of geo-interpretation for an adult audience. Geomorphology has a long history of explaining processes and concepts with the aid of visual media: schemes, maps, block diagrams… Nevertheless, there is a po-tential for developing more effective media both in terms of interaction with users and semiology and design. How do nu-merical technologies like interactivity, animation and 3D now extend the abilities of those media as communication and edu-cational tools in geomorphology? These technical extensions and their impact on learning processes are discussed on the basis of studies in geovisualisation and cognitive psychology.
In order to improve their efficiency, we suggest that all educative media developed by specialists should also be tested in their specific context, like on-site geotourism, and not only on children in school. Theoretical research on the use of interactive visual media in an informal learning context, but also on epistemology, in order to propose a didactic of geo-morphology (Martin2013) has led to the development of web applications combining different kinds of media, technologies and educative approaches. In a second phase, these interactive
applications will be tested by various audiences: specialists (geoscientists, teachers) and non-specialists (young and old). Along with classic survey methods, like interviews and ques-tionnaires, data will be collected automatically within the website: time spent on each element, pathway through the applications, etc.
The general framework (website) and three applications are described here to indicate how numerical technologies like interactivity or multimedia extend the possible uses of schemes and maps for geo-interpretation.
Through the web applications, three different approaches of educative communication were applied: explanation, ex-ploration and experimentation. Explanation is the most clas-sical approach in education, but we have tried here to present information in unusual ways: simultaneous multimedia com-bination (text, map, 3D view and scheme) or with animated schemes and maps. For comparison purposes in the testing phase, one of the applications (not presented here) is only an explanatory text. Experimentation is the most involving and interactive approach. Users have to interact with data or rep-resentation. For example, erosion concept can be experimented with the help of a game, which is a classical tool of behaviourist pedagogy. In contrast, the reconstruction of glacial stages is approached in a rather constructivist way: use of expert tools like geomorphological mapping and visual validation of hypotheses. Exploration should offer an emo-tional experience, which has become a major dimension of tourist offers today (Pralong 2006; Origet du Cluzeau and Vicériat2009). The media used and the degree of liberty vary between the three explorative applications.
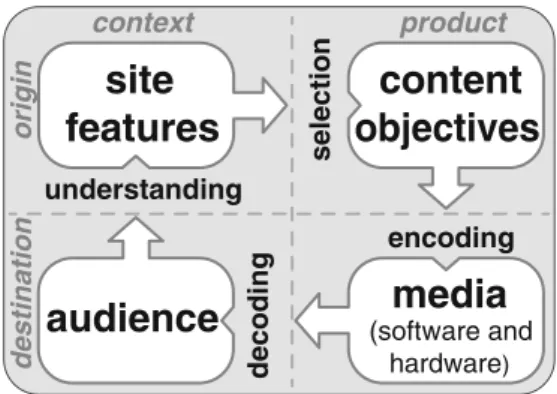
The development of the web applications followed the framework for indirect and site-related interpretation proposed by Martin et al. (2010). This model integrates four different— and sometimes concurrent—parameters: the site, the content or message (including communication objectives), the media and the audience (Fig. 2). During the development of an interpretive product, the site can seldom be changed and the audience is normally predetermined (target group). The prod-uct is adapted to those constraints (1) by selecting the site’s aspects that fit to defined objectives and (2) by encoding (designing) the media so that it can be properly decoded by the intended audience. The model stresses the interdepen-dence and the need of consistency in all interpretation aspects. Mainly encoding (visual semiotics) and decoding (media psy-chology) phases will be treated in this paper.
Visual Media for Geomorphology Interpretation Some Classic Media and Their Modern Extensions
Visual media correspond to the functional picture category from Cossette (1983) and more specifically to schemes,
specialist field non-specialist field
communication
site (landform, process)
define, locate
describe, explain
assess
know (be informed)
understand
protect
site (area of land)
geomorphosite (site + values) geomorphosite (site + values) educational educational and informative argumentative interpretation GEOHERITAGE GEOHERITAGE
Fig. 1 Geoheritage construction process for specialists and non-specialists and corresponding communication types
diagrams and photographs. According to Weidenmann (2001), a medium possesses four qualities, namely (1) hardware (physical part; sheet of paper, computer, projector), (2) software (stricto sensu medium; movie, scheme, text), (3) code (semiology; icons, text character, map symbol) and (4) mode (used sense; sight, hearing, touch). We concentrate here on software and code issues, and especially on schemes lato sensu.
Sometimes very abstract and sometimes realistic, schemes are intermediate ways to picture the world, between text and images (photography, painting, etc.). They stress the thematic, causal or spatial interrelations between the elements (Cossette 1983). Since the beginnings of geomorphology as a science, various kinds of schemes have been used for the depiction of relief and landforms. In fact, Davis (1908,1912), sometimes called the“father of geomorphology,” extensively developed block diagrams for explanations, which are still commonly found in teaching materials. Cartography is also widely used for analysis, synthesis and communication. Both media, how-ever, have some limits: they only give a static view of the reality (even if a series of maps can depict several stages of an evolution), the scale is fixed and the number of shown ele-ments or attributes is limited.
Numerical technologies allow to extend the possibilities of classic schemes. For example, multimedia and interactive maps have become geovisualisation tools for data exploration (Theus2005) or for collaborative work (MacEachren2001), organisers and containers of multimedia elements, interfaces to geodatabases (Ormeling1999), etc. They can be referred to as hypermaps (Kraak and Van Driel 1997; Laurini and Milleret-Raffort1990). Interactivity, which is defined as “a measure of a media’s potential ability to let the user exert an influence on the content and/or the form of a mediated com-munication” (Jensen1998), is one of the key concepts of this evolution. Interactive media go beyond some of the limits of static media (e.g. scale and amount of information) and po-tentially adapt to user’s needs.
Another extension of schemes is animation. Traditionally, the evolution of relief is depicted with a string of static pictures, but the number of stages is limited by place and readability issues. Animation is“a dynamic visual statement that evolves through movement or change in the display” (Peterson1996). Temporal animation (Dransch1995) modifies the shape of the represented objects to show a real evolution. In contrast, non-temporal ani-mation changes the viewpoint, zoom level, data classification, etc. to attract attention or to show different aspects of a phenom-enon. As geomorphology is highly concerned with the dynamic processes and landscape changes, animation seems to be a well-tailored tool for interpretive communication.
The hardware and software parts of media constantly evolve. All extensions cannot be detailed here. In particular, 3D models and virtual reality is a field in constant evolution. Probably because these technologies are complex and still require important resources, they are still underused for public communication and interpretation. However, they can be of great interest for interpreters and teachers in showing a realis-tic reconstruction of landscapes or inaccessible sites like caves, underwater forms, high mountain areas, etc. (see for example Jaillet et al.2011).
Learning by Media
The question of the influence of media on learning has long been controversial (see Carter1996for a review). Psycholo-gists faced considerable theoretical and methodological is-sues. It is now established that media indirectly influence learning: “media afford attributes, which afford cognitive learning activities, which afford thinking, which affords learn-ing” (Jonassen et al.1994). But media should be“designed according to their actual functions” in order to “support hu-man information processing in a satisfactory way” (Dransch 2000). In effect, media can alternatively support perception (or exploration), communication or knowledge acquisition.
Some results from cognitive psychology help to better under-stand the learning process. This underunder-standing provides guidance to the kind of medium and design choices. First, presenting text and an illustration together (one mode, two codes) seems to affect learning positively (Mayer and Sims1994), which is in compli-ance with the dual-coding theory (Clark and Paivio1991; Paivio 1986). Furthermore, the simultaneous use of two modes (picture and narration) shows a similar influence; we could then speak of a multimedia effect (Mayer and Moreno2002).
The degree of realism is also a major issue. Virtual reality is used to produce a similar reaction as in the real world. A virtual environment can be seen as realistic (Lange 2001; Shin 2003), but can sometimes be totally misinterpreted (Bleisch and Dykes2006). Design and interaction have to be carefully planned and tested. On the other hand, abstract schemes are the most effective for explanations. They are of better help than text or photography for memorisation and
site
features
audience
content
objectives
media
(software and hardware) decoding selection encoding understandingFig. 2 Model for a global approach of indirect and site-related interpre-tation developed by Martin et al. (2010) and modified by Martin (2013). It stresses the four parameters that should be taken into account when developing interpretation products, especially in geotourism
problem solving, especially among non-specialists (Mayer and Gallini1990). Explanatory schemes should be kept sim-ple and without unrelated details.
Efficiency of animation for learning is still debated. Its attractiveness and look of simplicity are well established, but can also have a negative effect on learning (Hoermann2007; Schnotz2001). Animations only affect learning positively if they make sense according to what is told or asked (Hasebrook and Gremm 1999). Perception problems have also been identified (Harrower 2003; MacEachren 1995), but they can be overcome with interactive control on anima-tion (with speed, zoom and step transianima-tions funcanima-tions).
Research on perception, functions of media, user interface design is very active and follows technical developments with some delay. It also focuses on the user and the learning context, what has not been treated here. When developing interpretive media, geoscientists should also take into account the educative and cognitive dimension of the communication process.
Development of Interpretive Web Applications Concept and Structure
Interpretive web applications were developed on selected geomorphological features from three sites in the Swiss Hautes Alpes Calcaires in the Helvetic domain (Morcles and Wildhorn nappes): Vallon de Nant, Derborence and Tsanfleuron (Fig.3). These sites are officially classified as
landscapes of national significance and as geosites of regional or national significance. They have been selected because they are well known as specific places by many visitors, with general similarities (same area, preserved mountain land-scapes, wilderness) but notable differences—level of difficul-ty to access the site, principal geomorphological features. However, the sites themselves are not of prior importance here. They are used as a basis to build on the media and give coherence to the whole so that the testers are not lost, but motivated to explore the different applications.
Nine interactive applications for the interpretation of geo-morphological features were implemented together in a website (Fig.4). Each application was connected to the fun-damentals of geomorphology: (1) causality and landform/ process relations, (2) erosional/depositional processes and (3) evolution of landscape (in this case, especially related to glaciers). Those themes are linked to the two main messages:
g yy 1 Vallon de Nant 2 Derborence 3 Tsanfleuron
1
2
3
G. G. G. G. GGGGGG. G.G. G. G.G.G. Fa v Fa v Fa v Fa v Fa v Fa v Fa v Fa v FFa v Fa v FFa v Fa v FFa v FFaFFa v Fa v F avavaav re re rrere re rere rererere rre rre re rrere e eeeeee (G((G(G é (G é (G é (G é (G é ((((G é (G((G é ((G((G é (G (G é GéGéGéGGGGGGGéGé éééé oloolooloolooloolooooloolooloololoolo olo oloolooolo lo oooooooo oo oooooooo gosgosgosgosgosgosgosgogosgosgosgosgosgosgosgosgosgosgoggogosggos osososoososos ssssssss )))))))))))))))Fig. 3 Localisation of Vallon de Nant, Derborence and Tsanfleuron in the South-Western Swiss Alps (Hautes Alpes Calcaires)
explanation Derborence Nant Tsanfleuron experimen -tation exploration lake evolution and formation (multimedia) erosion concept (game) rockfalls (movie) moraines formation (schemes) glacial stages reconstruction (drawing) deposit and erosion forms (guided tour) karstic dissolution (text) glacial retreat (2.5D view) glacial, karstic land forms (map)
Fig. 4 Homepage snapshot. Nine applications are proposed, sorted by site (rows) and approach (column). When the user picks one application, he gets information about the addressed question and the media used
(1) natural processes and shapes are very diverse and (2) landforms are witnesses of environmental changes. This kind of message could contribute to raising the awareness about the value of geomorphological features. Each application also tries to answer one question such as“How was this lake formed?” or “What is the future of this glacier?” On the home page, it is considered that the user is able to clearly choose what he wants—theme (question), site and type of media. Examples of Applications
Three applications have been selected here, one of each site and approach of educative communication (explanation, ex-perimentation, exploration) to exemplify some of the above presented concepts such as interactivity, multimedia effect, abstraction or hypermap. They show various levels of inter-activity and different media.
Explanation Approach: How Was the Derborence Lake Formed?
Derborence (Fig.3) is an important natural and cultural site. The site is in part a natural reserve since 1959, a landscape of national significance since 1977 and a geosite of national interest since 1996 because of the high limestone cliffs offer-ing a complete natural cross section of the Les Diablerets nappe and the two huge rockfalls of 1714 and 1749 that
deeply changed the landscape and resulted in the formation of small lakes.
As a result of a collective mapping workshop, an interpre-tive map was produced, presenting the various processes in a static way (Regolini-Bissig et al.2009). The web application presented here (Fig.5) shows the same data, but breaks down the evolution in four stages. Simultaneously, each stage is explained by a text and a scheme, the main features are drawn on a map and a 3D view shows the corre-sponding palaeo-landscape (Fig. 5). Typical of geovisualisation tools, this simultaneous multimedia pre-sentation is a mash-up of Google Maps API, Google Earth API and a standard Javascript-HTML slide show; each media can be extended full-screen.
Experimentation Approach: How Can Glacier Evolution Be Reconstructed?
The Vallon de Nant is a typical middle mountain valley. The glacier that remains in the upper is now very small. However, the whole valley has been shaped by glacier processes during Quaternary glaciations and Lateglacial and Holocene glacier retreat. It is a natural reserve since 1969 and a geosite of regional significance (Canton of Vaud) since 2008. Upstream in the valley, Martinets Glacier has left numerous moraines. The unusual behaviour of the glacier, due to its position alongside a high rock wall, causes the moraine ridges to have
Fig. 5 Snapshot of the application about Derborence Lake evolution with three different media: schemes (top left), map (bottom left) and 3D model with landscape reconstruction (right). A box (centre) displays a corresponding text and allows the navigation through the steps of relief evolution
different orientations and often cut each other, a configuration that makes glacier stage reconstruction difficult.
The proposed application (Fig.6) lets the user deal with specialist methods, mainly based on cartography. The user can draw hypothetical limits of different extents of the glacier f r om t h e o b s e r v at i on o f m o r ai n e s o n a ma p , a n orthophotography or a precise hillshade support (from a 2-m resolution DEM). Based on these limits, corresponding glaci-ated areas are automatically built and then animglaci-ated (transition from one stage to the other). This is meant to offer a visual validation of the hypothesis made by the user.
Exploration Approach: Which Different Landforms Can Be Found in the Karrenfield?
Tsanfleuron karrenfield (Fig.3) is an alpine limestone area partially covered by a plateau glacier. The scientific value of the site has been recognised for a long time (see Reynard2008 for a review), and the area is recognised as a geosite of national significance since 1996 by the working group on Swiss geosites; although now classified in the national inven-tory of geosites, it is not legally protected, and during the last years, it has suffered several impacts due to tourist
development. In order to improve recognition by a larger public, several attempts at geo-interpretation have been made during the last decade (Martin2010).
In a recent article (Martin and Ghiraldi2011), we proposed developing and testing dynamic maps for all kinds of geoheritage mapping. The application shows an interactive geoscientific tourist map, according to the classification of Regolini (2012). It presents geological and geomorphological features, and comparisons can be made with the printed ver-sion of the geotourist map (Martin 2010). In particular, the interactive structure allows us to integrate a much larger amount of information on the same map, without visual over-load. A zoom function also helps to deal with features of different scales, from geological units to the details of karstic forms. Finally, the map is used here as an interface to access multimedia content, especially text, picture slideshows, inter-active panoramas, explicative schemes and manipulatable 3D models (Fig.7).
Discussion
The development of interactive visual media pursued research objectives both on technical (media) and user (public) issues. Only media issues are discussed here, as the applications have not yet been tested. The three examples show the diverse ways multimedia techniques can renew and extend the uses of visual media in interpretive communication.
The synchronous combination of different media (explica-tive text, map, scheme, 3D) in the first application (Fig. 5) exemplify how the multimedia effect can be supported in a chronological explanation with linked interactive tools. The simultaneous presentation of the same information on a very abstract support (scheme) and on a semi-realistic one (3D landscape reconstruction) is intended to help to contextualise the schematic explanation.
The interactive drawing and vector animation for glacier extension mapping (Fig.6) present a high level of interactivity as it allows the users to add their own data. This can be seen as a “conversation,” but does not inform the user when the drawings are correct or realistic. Nevertheless, these kinds of interactive experimentation interfaces are of greatest interest in interpretation, because they can help non-specialists under-stand how the scientific results are obtained, using the same tools and methods.
The geotourist map with a scale-dependent content shown (Fig.7) is an example of a hypermap (Kraak and Van Driel 1997; Laurini and Milleret-Raffort 1990), an interface to access a large amount of data and other multimedia content. This shows how the limits of standard cartography can be extended by interactivity—scale, range of drawn information, etc. The interactivity is used here only for consultation (Jensen 1998).
A
B C
Fig. 6 Snapshots of the application for glacial stage reconstruction by the users. As a first step (a), the user draws supposed limits of the glacier (at least twice), and then validates the drawing. Second step (b), drawn points are connected and form a polygon corresponding to the glacier extension corresponding to the drawn moraines. Third step (c), the transition between the different stages is animated. The basemap style can be changed; moraine ridges can be shown on demand
The free web technologies now allow usable interactive media to be produced independently from specific programmes. Therefore, the design and content of interpretive media can be entirely subjected to an educational and scien-tific message, geoheritage management objectives and public needs.
Perspectives
Many issues concerning the effective use of media in geomor-phology and geology interpretation are still to be explored.
For example, the objective to raise geoheritage consciousness among non-specialist people certainly requires repeated and coherent educational, interpretive and emotional experiences, supporter by specific content and design. Web applications and other interactive media are an opportunity to reach differ-ent audiences than with books, panels and other mainly textual and informative media.
The next stage of this research will consist of a survey of the reception and use of interactive media by non-specialists. For this purpose, a user-tracker system has been implemented in the website in order to record the pathway through the applications—time spent in each media, tools used, etc. This
Fig. 7 Snapshots of the cartographic application about landforms of the Tsanfleuron karrenfield. Above zoom level set on“relief”. Below zoom level set on“landforms”. At each level, different information is drawn on the map and documented
data will be compared with interests, preferences or dislikes expressed by the users in questionnaires, their familiarity with the themes, with the mountain environment, age and educa-tion level.
The anticipated results could help in designing interpretive tools that adapt to users’ interests and questions and allow the users to manipulate objects and to interact with information. Such media are meant to be simultaneously effective in edu-cational communication and attractive for people in a leisure context (not at school) like geotourism.
New media offer very interesting and challenging oppor-tunities for science popularisation and environmental educa-tion. In particular, their content can be adapted to various audiences and interests (interactivity); they can depict com-plex and dynamic processes differently (hyperlinks, anima-tion, 3D). Interactive visual media also help attract and engage new audiences. But at the same time, they imply dealing with still poorly documented issues, like for example 3D or ani-mated semiology, user-centred design and Earth sciences di-dactic. In that context, a global approach to site interpretation should be favoured.
The proposed global approach to interpretation (Fig.2) on the one hand aims to support the development of sound and potentially efficient interpretation products and on the other hand, it can be used as a guide for further research on geoheritage promotion. Consistent with current theories in education, this approach stresses the importance of taking into account the needs and interests of the target audience. More-over, communication objectives are not to be neglected. Mak-ing non-specialist people aware of the existence and the value of geoheritage requests a structured, attractive and goal-oriented educational communication process.
References
Allen TR (2008) Digital terrain visualization and virtual globes for teaching geomorphology. J Geogr 106(6):253–266. doi:10.1080/ 00221340701863766
Bleisch S, Dykes J (2006) Using web-based 3D visualization for planning hikes virtually. An evaluation. In: Mount NJ, Harvey GL, Aplin P, Priestnall G (eds) Representing, modeling and visualizing the natu-ral environment, innovations in GIS. CRC Press, Boca Raton, pp 353–365
Bollati I, Pelfini M, Pellegrini L, Bazzi A, Duci G (2011) Active geomorphosites and educational application: an itinerary along Trebbia River (Northern Apennines, Italy). In: Reynard E, Laigre L, Kramar N (eds) Les géosciences au service de la société. Actes du colloque en l’honneur du Professeur Michel Marthaler, 24–26 juin 2010. Géovisions 37. Université de Lausanne, Institut de Géographie, pp 229–233
Boyle A, Maguire S, Martin A, Milsom C, Nashe R, Rawlinson S, Turner A, Wurthmann S, Conchie S (2007) Fieldwork is good: the student perception and the affective domain. J Geogr High Educ 31(2):299– 317. doi:10.1080/03098260601063628
Carter V (1996) Do media influence learning? Revisiting the debate in the context of distance education. Open Learn J Open Dist Learn 11(1): 31–40
Cayla N, Hobléa F, Gasquet D (2010) Guide des bonnes pratiques de médiation des géosciences sur le terrain. Géol Fr 1:47–55 Clark JM, Paivio A (1991) Dual coding theory and education. Educ
Psychol Rev 3(3):149–210
Cossette C (1983) Les images démaquillées. Approche scientifique de la communication par l’image. Riguil, Montréal
Davis WM (1908) Practical exercises in physical geography. Ginn & Co, Boston
Davis WM (1912) Die erklärende Beschreibung der Landformen. BG Teubner, Leipzig
Di Méo G (2008) Processus de patrimonialisation et construction des territoires. Regards sur le patrimoine industriel. Actes du colloque Patrimoine et industrie en Poitou-Charentes: connaître pour valoriser. ADES, Pessac
Dransch D (1995) Temporale und nontemporale Computer-Animation in der Kartographie. Selbstverlag Fachbereich Geowissenschaften, Berlin
Dransch D (2000) The use of different media in visualizing spatial data. Comput Geosci 26:5–9
Giordan A, de Vecchi G (2010) Aux origines du Savoir. La méthode pour apprendre. Au delà des apparences. Ovadia, Nice
Haigh M, Kilmartin MP (1987) Teaching soil conservation in the labo-ratory using the‘bank erosion channel’ flume. J Geogr High Educ 11(2):161–167
Harrower MA (2003) Tips for designing effective animated maps. Cartogr Perspect 44:63–65
Hasebrook JP, Gremm M (1999) Multimedia for vocational guidance. Effects of individualized testing, videos, and photography on accep-tance and recall. J Educ Multimedia Hypermedia 8:217–240 Hoermann F (2007) Abbilder und Animationen in Lernmedien.
Universität, Ulm
Hose TA (2012) 3G’s for modern geotourism. Geoheritage 4:7–24. doi:
10.1007/s12371-011-0052-y
Jaillet S, Ployon E, Villemin T (eds) (2011) Images et modèles 3D en milieux naturels. Collection EDYTEM 12. Université de Savoie, Laboratoire EDYTEM
Jensen JF (1998) Interactivity. Tracking a new concept in media and communication studies. Nordicom Rev Nordic Res Media Commun Rev 19(2):185–204
Jonassen DH, Campbell JP, Davidson ME (1994) Learning with media. Restructuring the debate. Educ Technol Res Dev 42(2):31–39 Kraak M-J, Van Driel R (1997) Principles of hypermaps. Comput Geosci
23(4):457–464
Lange E (2001) The limits of realism. Perceptions of virtual landscapes. Landsc Urban Plan 54:163–182
Laurini R, Milleret-Raffort F (1990) Principles of geomatic hypermaps. Proceedings of the 4th international symposium on spatial data handling, vol 2. Zürich, pp 642–655
MacEachren AM (1995) How maps work. Representation, visualization, and design. Guilford Press, New York
MacEachren AM (2001) Cartography and GIS. Extending collaborative tools to support virtual teams. Prog Hum Geogr 25:431–444 Martin S (2010) Geoheritage popularisation and cartographic
visualisa-tion in the Tsanfleuron-Sanetsch area (Valais, Switzerland). In: Regolini-Bissig G, Reynard E (eds) Mapping Geoheritage. Géovisions 35. Université de Lausanne, Institut de Géographie, pp 15–30
Martin S (2013) Valoriser le géopatrimoine par la médiation indirecte et la visualisation des objets géomorphologiques. Géovisions 41, PhD Thesis. Université de Lausanne, Institut de Géographie et Durabilité Martin S, Ghiraldi L (2011) Internet au service du patrimoine. Cartographie dynamique de l’inventaire des géotopes d’importance nationale. In: Reynard E, Laigre L, Kramar N (eds) Les géosciences
au service de la société. Actes du colloque en l’honneur du Professeur Michel Marthaler. Géovisions 37. Université de Lausanne, Institut de Géographie, pp 105–117
Martin S, Regolini-Bissig G, Perret A, Kozlik L (2010) Élaboration et é v a l u a t i o n de p r od u i t s g é ot o u r i s t i q u e s . P r o p os i t i o ns méthodologiques. Téoros 29(2):55–66
Mayer RE, Gallini JK (1990) When is an illustration worth ten thousand words? J Educ Psychol 82(4):715–726
Mayer RE, Moreno R (2002) Aids to computer-based multimedia learn-ing. Learn Instr 12(1):107–119
Mayer RE, Sims VK (1994) For whom is a picture worth a thousand words? Extensions of a dual-coding theory of multimedia learning. J Educ Psychol 86:389–401
Megerle H (2003) Naturelebnispfade—neue Medien der Umweltbildung und des landschaftsbezogenen Tourismus? Bestandsanalyse, Evaluation und Entwicklung von Qualitätsstandards. Tübinger geographische Studien. Universität Tübingen, Geographisches Institut
Megerle H (2008) Geotourismus. Innovative Ansätze zur touristischen Inwertsetzung und nachhaltigen Regionalentwicklung. Kerrsting, Nürnberg
Migoń P (2009) Promoting geomorphological heritage. State of the art, problems and challenges. In: Lin J-C (ed) East Asian Geoparks. Vision, problems and prospects. The Geographical Society of China, Taipei, pp 101–118
Origet du Cluzeau C, Vicériat P (2009) Le tourisme des années 2020. Des clés pour agir. La Documentation française, Paris
Ormeling F (1999) Map concepts in multimedia products. In: Cartwright WE, Peterson MP, Gartner G (eds) Multimedia cartography. Springer, Berlin, pp 105–115
Paivio A (1986) Mental representations. A dual coding approach. University Press, Oxford
Peterson MP (1996) Between reality and abstraction. Non-temporal ap-plications of cartographic animation.http://maps.unomaha.edu/ AnimArt/article.html
Portal C (2010) Reliefs et patrimoine géomorphologique. Applications aux parcs naturels de la façade atlantique européenne. PhD Thesis. Université de Nantes
Pralong JP (2006) Geotourism: a new form of tourism utilising natural landscapes and based on imagination and emotion. Tour Rev 61:20– 25
Regolini G (2012) Cartographier les géomorphosites. Objectifs, publics et propositions méthodologiques. Géovisions 38, PhD Thesis. Université de Lausanne, Institut de Géographie
Regolini-Bissig G, Alves A, Brandolini P et al (2009) How was Lake Derborence (VS, Switzerland) formed? Popularisastion of geosciences by means of a geotourist map. In: Bayerisches Landesamt für Umwelt (ed) 6th European Congress on Regional Geoscientific Cartography and Information Systems. Earth and man, 2nd edn. Landesamt für Vermessung und Geoinformation, München, pp 290–293
Reynard E (2008) Le lapiaz de Tsanfleuron. Un paysage glacio-karstique à protéger et à valoriser. In: Hobléa F, Reynard E, Delannoy J-J (eds) Karsts de montagne. Géomorphologie, patrimoine et ressource. Actes du colloque organisé dans le cadre des journées de l’Assocation française de Karstologie. Sion, 15 Septembre 2006. Collection EDYTEM 7. Université de Savoie, Laboratoire EDYTEM, pp 157-168
Schnotz W (2001) Sign systems, technologies, and the acquisition of knowledge. In: Rouet J-F, Levonen JJ, Biardeau A (eds) Multimedia learning. Cognitive and instructional issues. Elsevier Science, London, pp 9–29
Sellier D (2009) La vulgarisation du patrimoine géomorphologique. Objets, moyens et perspectives. Bull de l’Association des Géographes Français 1:67–135
Shin YS (2003) Virtual experiment environments design for science education. In: Proceedings of the international conference on Cyberworlds 2003. IEEE Computer Society, Singapore, pp 388–395 Theus M (2005) Statistical data exploration and geographical information visualization. In: Dykes J, MacEachren AM, Kraak M-J (eds) Exploring geovisualization. Elsevier, Amsterdam, pp 127–142 Tilden F, Craig RB (1977) Interpreting our heritage. University of North
Carolina Press, Chapel Hill
Weidenmann B (2001) Lernen mit Medien. In: Krapp A, Weidenmann B (eds) Pädagogische Psychologie. Ein Lehrbuch. Psychologie Verlagsunion, Weinheim, pp 415–465