Publisher’s version / Version de l'éditeur:
Environmental Microbiology Reports, 4, 3, pp. 350-359, 2012-06-01
READ THESE TERMS AND CONDITIONS CAREFULLY BEFORE USING THIS WEBSITE. https://nrc-publications.canada.ca/eng/copyright
Vous avez des questions? Nous pouvons vous aider. Pour communiquer directement avec un auteur, consultez la
première page de la revue dans laquelle son article a été publié afin de trouver ses coordonnées. Si vous n’arrivez
Questions? Contact the NRC Publications Archive team at
PublicationsArchive-ArchivesPublications@nrc-cnrc.gc.ca. If you wish to email the authors directly, please see the first page of the publication for their contact information.
Archives des publications du CNRC
This publication could be one of several versions: author’s original, accepted manuscript or the publisher’s version. / La version de cette publication peut être l’une des suivantes : la version prépublication de l’auteur, la version acceptée du manuscrit ou la version de l’éditeur.
For the publisher’s version, please access the DOI link below./ Pour consulter la version de l’éditeur, utilisez le lien DOI ci-dessous.
https://doi.org/10.1111/j.1758-2229.2012.00341.x
Access and use of this website and the material on it are subject to the Terms and Conditions set forth at
Sub-inhibitory concentrations of different pharmaceutical products
affect the meta-transcriptome of river biofilm communities cultivated in
rotating annular reactors
Yergeau, Étienne; Sanschagrin, Sylvie; Waiser, Marley J.; Lawrence, John
R; Greer, Charles W.
https://publications-cnrc.canada.ca/fra/droits
L’accès à ce site Web et l’utilisation de son contenu sont assujettis aux conditions présentées dans le site LISEZ CES CONDITIONS ATTENTIVEMENT AVANT D’UTILISER CE SITE WEB.
NRC Publications Record / Notice d'Archives des publications de CNRC:
https://nrc-publications.canada.ca/eng/view/object/?id=9c10e26c-8c49-48d8-84a3-dbc4c2d484dd https://publications-cnrc.canada.ca/fra/voir/objet/?id=9c10e26c-8c49-48d8-84a3-dbc4c2d484dd
For Peer Review Only
! " #
$ "! % " & ' & (
) ! * ' & + # , - & # & ,
$ & # , $ - . & ) ) % , ! " # / , - ! ) % , * 0 , & - ! ) % , 1 , )& - . & ) ) % , ! " # 2 0 % ! ! , 3$ .' # , & ! % , " ! , 4 #
For Peer Review Only
Sub inhibitory concentrations of different pharmaceutical products affect the
1
meta transcriptome of river biofilm communities cultivated in rotating
2
annular reactors
3
4
5
Etienne Yergeau
1, Sylvie Sanschagrin
1, Marley J. Waiser
2, John R. Lawrence
2and
6
Charles W. Greer
1*
7
8
1
National Research Council of Canada, Montreal, Biotechnology Research Institute,
9
Quebec, Canada.
10
2
Environment Canada, Saskatoon, Saskatchewan, Canada.
11
12
13
Running head: Pharmaceutical products effects on river biofilms
14
Keywords: meta transcriptomics, 16S rRNA gene, pharmaceutical products, river
15
biofilms, pyrosequencing
16
17
*Corresponding author:
charles.greer@cnrc nrc.gc.ca
18
19
For Peer Review Only
20
21
22
23
24
25
!
"
#$
26
%&$
!#'
27
(
)*!
+,
!#'
-.-28
(
29
+,
!#'
30
/
31
32
!#'
(
*
(
33
# )
*
34
35
0
36
/
37
38
0
39
40
41
For Peer Review Only
/
42
Surface waters worldwide are contaminated by pharmaceutical and personal care
43
products (PPCP) at very low concentrations (Daughton and Ternes, 1999; Kolpin
,
44
2002; Metcalfe
, 2003). These products typically contaminate surface waters through
45
effluent water release from wastewater treatment plants (Jones
, 2004). Since many
46
PPCP’s are often specifically designed to resist degradation, it is not surprising that they
47
are relatively unaffected by the wastewater treatment process (Kolpin
, 2002;
48
Metcalfe
, 2003). Furthermore, the typically low concentrations in wastewater make
49
PPCP’s difficult to remove by any means (Daughton and Ternes, 1999). Although present
50
at low concentrations, PPCP’s are considered pseudo persistent in that they are constantly
51
being added to receiving waters (Daughton and Ternes, 1999). Of great concern is their
52
role, not only in endocrine disruption (Kidd
, 2007), but in the potential development
53
of antibiotic resistant bacteria (Costanzo
, 2005). One of the more subtle but equally
54
important effects, however, is the likelihood of PPCP’s having an effect on bacterial
55
processes that are crucial for the health and integrity of aquatic ecosystems. Several
56
pharmaceutical products, like antibiotics, may act as signaling molecules in addition to
57
their role as inhibitors of microbial processes (Fajardo and Martínez, 2008). Lending
58
support to this hypothesis is the fact that the same antibiotic can trigger different
59
responses in different bacteria (Goh
, 2002). Different antibiotics are also known to
60
elicit different responses in the same organism (Lin
, 2005; Ng
, 2003). Because
61
pharmaceutical products have the ability to act as bacterial community functional
62
regulators, chronic bacterial exposure may disrupt the functioning of complex microbial
63
For Peer Review Only
assemblages, and thereby alter ecosystem dynamics (Lawrence
, 2005; Lawrence
64
, 2009; Lawrence
, 2011).
65
Low pharmaceutical product concentrations have been shown to affect
66
transcription in isolated bacterial strains (reviewed in Davies
, 2006). While useful,
67
these studies did not establish if low concentrations of pharmaceutical products in aquatic
68
environments might lead to changes in ecosystem level relevant bacterial processes (such
69
as nutrient (N, P, C) cycling). We previously assessed the meta transcriptomic responses
70
of reactor grown biofilms to various pharmaceutical products using a novel anonymous
71
microarray approach (Yergeau
, 2010). Although this approach highlighted several
72
dominant genes, whose expression was significantly affected by pharmaceutical products,
73
it could not yield information about the changes in abundance of the less numerous
74
transcripts and in the active community composition. This information is crucial in view
75
of the potential impact on ecosystem processes or what are referred to as ecosystem
76
services in terms of maintenance of water quality. We therefore decided to take a
77
complementary ecological approach and sequenced the meta transcriptome and 16S
78
rRNA gene amplicons from nutrient rich river biofilms to search for indications of shifts
79
in ecosystem related processes (nutrient cycles, photosynthesis and carbon utilization), at
80
the level of both community composition and gene expression.
81
In this study, microbial biofilms grown in water from Wascana Creek,
82
Saskatchewan, Canada, were subjected to low concentrations of erythromycin,
83
sulfamethoxazole and sulfamethazine (three antibiotics) as well as gemfibrozil (a lipid
84
regulator). Sequencing of 16S rRNA gene amplicons was used to determine if these
85
pharmaceutical products caused any shifts in bacterial community composition. In
86
For Peer Review Only
addition, mRNA sequencing was used to determine the potential of these pharmaceutical
87
products to change active bacterial community composition and gene expression. Our
88
results suggested that in the short term, pharmaceutical products cause relatively minor
89
changes in bacterial community composition, but large shifts in gene expression in the
90
active community. Furthermore, several gene categories (photosynthesis, carbon
91
utilization and N and P metabolism), crucial for ecosystem processes, showed shifts in
92
their relative expression following exposure to pharmaceutical products. Overall, the
93
results suggested that chronic exposure of aquatic ecosystems to pharmaceutical products
94
could seriously alter ecosystem processes and lead to shifts in microbial community
95
composition.
96
For Peer Review Only
!
98
In this study, a metagenomic and metatranscriptomic approach (Table 1) was used to test
99
the hypothesis that exposing complex microbial biofilm communities to pharmaceutical
100
products causes changes in the community composition and in the expression of genes
101
related to important ecosystem processes. For biofilm development, we used rotating
102
annular reactors (Lawrence
, 2000; Lawrence
, 2004) inoculated with water
103
from Wascana Creek (WC), upstream from the city of Regina, SK, Canada, sewage
104
treatment plant (50°24’587.42” N, 104°32’56.95”W). Treatments included: 1 Hg L
1105
erythromycin (ER), 1 Hg L
1gemfibrozil (GM), 0.5 Hg L
1sulfamethazine (SN), and 0.5
106
Hg L
1sulfamethoxazole (SL). Nothing was added to the control reactors (CO). All
107
treatments were replicated independently three times and the experiment was run for 8
108
weeks. The rotating annular reactor approach was used to mimic the environmental
109
conditions under which river biofilms grow, but without fluctuating water levels,
110
temperature and nutrient inputs that are normally observed in the field. In view of the
111
already high variability observed between replicated reactors, this approach had the major
112
advantage of enabling us to identify significant trends in gene expression. Most of the
113
previous literature related to the effects of pharmaceutical products on microbial
114
communities used a similar experimental design.
115
116
117
These treatments did not result in large changes to the biofilm microbial community
118
composition at the DNA level (based on 16S rRNA gene amplicon sequencing) (Fig. 1a).
119
The large variability between replicated reactors, as previously reported (Yergeau
,
120
For Peer Review Only
2010), probably prevented the detection of significant trends in this dataset. This lack of
121
large shifts at the phylum/class level (Fig. 1a) could also be related to the fact that
122
pharmaceutical products were added at low, environmentally relevant concentrations and
123
the incubation time was relatively short. Results presented here contrast with other
124
studies that used the same rotating annular reactor approach and demonstrated that
125
biofilm architecture (thickness) and community composition at the major functional
126
group level are highly sensitive to environmental stress (Lawrence
, 2004; Lawrence
127
, 2005). The antiseptic chlorhexidine and antimicrobial triclosan, for instance, were
128
shown to significantly alter the microbial community composition of biofilms grown in
129
rotating annular reactors at concentrations of 10 100Hg/L (Lawrence
, 2008;
130
Lawrence
, 2009). In another study, exposure of rotating annular biofilms to four
131
different PPCPs resulted in a significant increase in
(nutrient effect),
132
and a concomitant decrease in
(toxic effect) (Lawrence
,
133
2005). Such shifts, which have also been observed in response to the addition of carbon,
134
nitrogen and phosphorus (CNP), are thought to be indicative of nutrient enrichment or
135
pollution (Brümmer
, 2000; Neu
, 2005). One reason for the lack of nutrient
136
response of the bacterial community in our study may have been the low pharmaceutical
137
product concentration used (0.5 to 1 Kg/L). Such concentrations were probably too low to
138
significantly increase Wascana Creek nutrients, which are already significantly elevated
139
(Waiser
, 2011a) with dissolved organic carbon levels of 15 mg/L and total
140
dissolved N of 3 mg/L versus an addition of < 1 Kg/L C and < 0.1 Kg/L N by the
141
antibiotic treatments. Another reason for the differing results obtained is that two
142
different molecular methods were used. In the Lawrence and colleagues (2005) study
143
For Peer Review Only
hybridization or PCR DGGE was utilized, while in the present study,
144
pyrosequencing of the 16S rRNA gene was used. That being said, there were some
145
genera in the Wascana study, which were particularly sensitive to low exposure levels of
146
pharmaceutical products (Table 2). Several genera were affected either positively or
147
negatively by the treatments, and these almost exclusively belonged to the
148
,
, and
phyla. The impact at the genus level,
149
however, was not enough to significantly change the bacterial community composition at
150
higher taxonomic levels.
151
In contrast to the small differences observed at the DNA level (16S rRNA gene
152
amplicon sequencing), the active community composition at the RNA level (taxonomic
153
affiliation of the mRNA sequences) was strongly affected by exposure to low
154
concentrations of pharmaceutical products, even at the phylum level (Fig. 1b). At the
155
phylum level, the largest changes occurred in the
and the
156
for ER and SL treatments. This result suggests that some phyla members modify their
157
general activity when exposed to pharmaceutical products.
, for instance,
158
exhibited a strong decrease in activity in response to both ER and SL (Fig. 1b).
159
Interestingly, even though the general activity of
decreased, significant
160
increases in the relative abundance of some genera (based on 16S rRNA gene amplicon
161
sequencing) were also noted (Table 2). This observation is in line with previous work
162
showing differential sensitivity of isolated
to antibiotics (Lawrence
,
163
2009). Similarly direct biofilm imaging in another study demonstrated that exposure to
164
four different pharmaceutical products reduced
biomass (Lawrence
,
165
2005). Results presented here suggest that
could be used as a bioindicator
166
For Peer Review Only
phylum for ecosystem pollution by pharmaceutical products. Of concern is that this
167
phylum is one of the most important ones in aquatic ecosystems, being involved in both
168
carbon and nitrogen cycling. Any decrease in the activity of this group, therefore, has the
169
potential to disrupt aquatic nutrient cycling.
170
Treatments also significantly influenced the activity of the biofilm community at
171
the organism level (Table 3). Most of the significant changes were found in the ER and
172
the SL treatments, and organisms most significantly affected belonged to the
173
, the
or the
(Table 3). ER caused a significant
174
increase in the relative activity for most organisms, with the exception of two
175
species that exhibited decreased activity (Table 3). Similarly, the only
176
organism showing a significant decrease in activity following the SL treatment was the
177
,
(Table 3). In contrast, the two organisms that were
178
significantly affected by the GM treatments showed significant decreases in their activity.
179
No significant effect of SN on any organism was observed at P<0.05. Even though each
180
treatment affected specific organisms, most of the active microorganisms were shared
181
between the treatments (Fig. 2a). Some organisms were more or less active in the
182
different treatments, but the majority of the organisms detected in the mRNA dataset
183
showed some activity in all treatments. This indicates that the pharmaceutical products
184
used elicited some common microbial responses.
185
186
187
Large shifts in the relative abundance of different transcript categories were
188
observed based on the functional classification of the mRNA reads (Fig. 3). These
189
For Peer Review Only
changes were highly variable and pharmaceutical product specific with the ER and SL
190
treatments having the strongest effect (Fig. 3). However, as for the active
191
microorganisms, most of the actively expressed functions were common to all treatments
192
(Fig. 2b), suggesting that most of the differences observed between treatments were
193
related to shifts in the relative expression of different gene categories and not to shifts in
194
the gene categories being expressed. However, when compared to the control, several
195
genes were uniquely expressed under specific treatments, especially the SL and ER
196
treatments (Table 4), which led to a large difference in metabolic networks (Fig. 4). The
197
most striking feature of this metabolic network analysis is the large number of genes
198
uniquely expressed in the ER and SL treatments as compared to the controls, which lends
199
support to the idea that at low concentrations, antibiotics might act as signaling molecules
200
triggering the expression of specific genes (Fajardo and Martínez, 2008).
201
Because CO
2and N
2fixation are major ecophysiological processes that allow
202
biofilms to be self sufficient (Van Gemerden, 1993), our analyses also focused on C and
203
N cycle related gene categories. In control biofilms, photosynthesis related transcripts
204
were the most abundant category (Fig. 3). In sulfamethoxazole (SL) exposed biofilms,
205
however, this category decreased dramatically, to the point where it was no longer the
206
most dominant ecosystem process (Fig. 3). Photosynthesis inhibition could have major
207
consequences on ecosystem processes, as photosynthesis is the major source of fixed
208
carbon in aquatic ecosystems. A recent laboratory study reported that the antibiotics
209
triclosan and triclocarban, at concentrations of 10 Hg/L, shifted river biofilms from an
210
autotrophic dominated community to one controlled by heterotrophs (Lawrence
,
211
2009). A similar observation was recently made in a field based study on Wascana
212
For Peer Review Only
Creek (Waiser
, 2011a). Here the planktonic microbial community shifted from net
213
autotrophy at a site above the Regina sewage treatment plant to net heterotrophy 0.4 km
214
below it, based on primary production to bacterial production ratios (Waiser
,
215
2011a). A suite of pharmaceutical products, including the ones in this study, are
216
regularly found at this particular creek site (Waiser
, 2011b).
217
We also observed shifts in transcripts related to carbohydrate metabolism (Fig. 3
218
and Table 4). Using BIOLOG plates, shifts in carbon utilization patterns were previously
219
reported as a typical effect of pharmaceutical products on river biofilm communities
220
growing in rotating annular reactors (Lawrence
, 2005; Lawrence
, 2008;
221
Lawrence
, 2009). In our dataset, carbohydrate related genes were mostly positively
222
affected by exposure to pharmaceutical products (Fig. 3 and Table 4). Four different
223
pharmaceutical products were previously observed to have significant positive effects on
224
the utilization of carbohydrates, while most of these pharmaceutical products had
225
negative effects on the utilization of carboxylic acids and phosphorylated compounds and
226
no effects were observed on the utilization of polymers, esters and amino acids
227
(Lawrence
, 2005). In contrast, general negative effects of exposure to
228
pharmaceutical product on carbon utilization have been reported in other studies
229
(Lawrence
, 2008; Lawrence
, 2009).
230
In addition to the shifts observed in carbohydrate and photosynthesis related
231
genes, we also observed changes in genes related to N and P metabolism (Fig. 3 and
232
Table 4). Based on previous reports (Dokianakis
, 2004; Lawrence
, 2004),
233
Lawrence and colleagues (2009) proposed that the antibiotics triclosan and triclocarban
234
might act on microbial communities by disrupting critical biogeochemical processes such
235
For Peer Review Only
as the nitrogen cycle. Accordingly, most of the pharmaceutical products tested in the
236
present study reduced the relative abundance of transcripts related to nitrite reductase and
237
ammonia assimilation (Fig .3). In other studies, sulfamethoxazole (SL) significantly
238
inhibited nitrite oxidation in isolated strains (Dokianakis
, 2004). Some effects on
239
gene categories related to this process were also observed in our dataset. The observed
240
shifts in the expression of N cycle related genes could influence the ability of aquatic
241
ecosystems to deal with excess nitrate and nitrate originating from sewage treatment
242
plants. In Wascana Creek, for example, although some nitrification is occurring, the
243
persistence of high concentrations of nitrate and nitrite for many kilometers downstream
244
of the STP would suggest some inhibition of denitrification (Waiser
, 2011a).
245
Whether or not this inhibition is occurring in response to chronic pharmaceutical product
246
exposure remains to be determined.
247
We previously assessed the metatranscriptomic response of the current samples to
248
pharmaceutical products using an anonymous microarray approach (Yergeau
,
249
2010). Although the two methods (pyrosequencing and microarrays) are highly
250
complementary, each gave a different view of the shifts occurring following exposure of
251
river biofilms to pharmaceutical products. Anonymous microarrays were highly effective
252
in detecting shifts in dominant genes, but could not give a complete overview of the
253
community. Shifts in ecosystem related processes reported here, for instance, were
254
missed by the anonymous microarray approach because these genes comprise only a
255
small part of the total expressed gene pool (less than 2% for N and P metabolism and less
256
than 5% for carbohydrates). Furthermore, classification of mRNA in the subsystem
257
hierarchy of the MG RAST server allowed us to sum several individual genes and carry
258
For Peer Review Only
out tests on these sums, something not possible using anonymous microarrays. In
259
contrast, the large amount of data involved in metatranscriptomic sequencing makes it
260
difficult to identify particular genes that are strongly affected by pharmaceutical products
261
as was possible with the anonymous microarray approach. Using the two approaches, we
262
were able to highlight both shifts in ecosystem processes and large changes in the
263
expression of individual genes. We believe that using the two approaches on a common
264
set of samples resulted in very useful information that would not have been revealed by
265
using either method alone.
266
267
268
In contrast to previous reports, we did not observe short term effects of pharmaceutical
269
products on bacterial community composition, probably because of the lower
270
concentrations of pharmaceutical products used. Based on RNA analysis, however, a
271
range of significant shifts in the active community composition and in the relative
272
abundance of a range of transcript categories were observed. The data presented here
273
demonstrates the usefulness of RNA based studies. They appear to be especially useful,
274
as demonstrated in this study, in detecting subtle changes in microbial communities after
275
short term exposure to low pharmaceutical product concentrations. The shifts observed
276
were in line with previous reports, and suggest that low concentrations of pharmaceutical
277
products may potentially affect critical biofilm functions in river ecosystems. One of the
278
most significant changes observed was a decrease in
activity and in the
279
expression of photosynthesis related genes after exposure to erythromycin and
280
sulfamethoxazole. Longer term studies are needed to understand how the pharmaceutical
281
For Peer Review Only
product induced shifts at the RNA level observed in this study translate into effects on
282
important aquatic ecosystem process rates.
283
284
' 0
285
Environment Canada and Health Canada provided financial support for this research.
286
Vijay Tumber and George Swerhone of Environment Canada are thanked for their
287
excellent technical support.
288
For Peer Review Only
!
290
Bell, T.H., Yergeau, E., Martineau, C., Juck, D., Whyte, L.G., and Greer, C.W. (2011)
291
Identification of nitrogen incorporating bacteria in petroleum contaminated Arctic
292
soils by using [
15N] DNA based stable isotope probing and pyrosequencing.
293
11: 4163 4171.
294
Brümmer, I.H.M., Fehr, W., and Wagner Döbler, I. (2000) Biofilm community structure
295
in polluted rivers: Abundance of dominant phylogenetic groups over a complete
296
annual cycle.
,,: 3078–3082.
297
Costanzo, S.D., Murby, J., and Bates, J. (2005) Ecosystem response to antibiotics
298
entering the aquatic environment.
.+: 218 223.
299
Daughton, C.G., and Ternes, T.A. (1999) Pharmaceuticals and personal care products in
300
the environment: Agents of subtle change?
+21: 907
301
938.
302
Davies, J., Spiegelman, G.B., and Yim, G. (2006) The world of subinhibitory antibiotic
303
concentrations.
3: 445 453.
304
Dokianakis, S.N., Kornaros, M.E., and Lyberatos, G. (2004) On the effect of
305
pharmaceuticals on bacterial nitrite oxidation. !
"
.2: 341 346.
306
Fajardo, A., and Martínez, J.L. (2008) Antibiotics as signals that trigger specific bacterial
307
responses.
++: 161 167.
308
Goh, E. B., Yim, G., Tsui, W., McClure, J., Surette, M.G., and Davies, J. (2002)
309
Transcriptional modulation of bacterial gene expression by subinhibitory
310
concentrations of antibiotics.
#
$
33: 17025 17030.
311
Jones, O.A.H., Voulvoulis, N., and Lester, J.N. (2004) Potential ecological and human
312
health risks associated with the presence of pharmaceutically active compounds in
313
the aquatic environment.
%
" &
4-: 335 350.
314
Kidd, K.A., Blanchfield, P.J., Mills, K.H., Palace, V.P., Evans, R.E., Lazorchak, J.M.,
315
and Flick, R.W. (2007) Collapse of a fish population after exposure to a synthetic
316
estrogen.
#
$
+2-: 8897 8901.
317
Kolpin, D.W., Furlong, E.T., Meyer, M.T., Thurman, E.M., Zaugg, S.D., Barber, L.B.,
318
and Buxton, H.T. (2002) Pharmaceuticals, hormones, and other organic
319
wastewater contaminants in U.S. streams, 1999 2000: A national reconnaissance.
320
"
4,: 1202 1211.
321
Lawrence, J.R., Swerhone, G.D.W., and Neu, T.R. (2000) A simple rotating annular
322
reactor for replicated biofilm studies. '
-5: 215–224.
323
Lawrence, J.R., Chenier, M.R., Roy, R., Beaumier, D., Fortin, N., Swerhone, G.D.W. et
324
al. (2004) Microscale and molecular assessment of impacts of nickel, nutrients,
325
and oxygen level on structure and function of river biofilm communities.
326
12: 4326–4339.
327
Lawrence, J.R., Swerhone, G.D.W., Wassenaar, L.I., and Neu, T.R. (2005) Effects of
328
selected pharmaceuticals on riverine biofilm communities.
'
.+:
329
655–669.
330
Lawrence, J.R., Zhu, B., Swerhone, G.D.W., Topp, E., Roy, J., Wassenaar, L.I. et al.
331
(2008) Community level assessment of the effects of the broad spectrum
332
antimicrobial chlorhexidine on the outcome of river microbial biofilm
333
development.
1-: 3541–3550.
For Peer Review Only
Lawrence, J.R., Zhu, B., Swerhone, G.D.W., Roy, J., Wassenaar, L.I., Topp, E., and
335
Korber, D.R. (2009) Comparative microscale analysis of the effects of triclosan
336
and triclocarban on the structure and function of river biofilm communities.
337
"
-21: 3307 3316.
338
Lawrence, J.R., Zhu, B., Swerhone, G.D.W., Roy, J., Tumber, V., Waiser, M.J. et al.
339
(2011) Molecular and microscopic assessment of the effects of caffeine,
340
acetaminophen, diclofenac and their mixtures on river biofilm communities.
341
" &
/
.
342
Lin, J.T., Connelly, M.B., Amolo, C., Otani, S., and Yaver, D.S. (2005) Global
343
transcriptional response of
to treatment with subinhibitory
344
concentrations of antibiotics that inhibit protein synthesis.
(
345
-3: 1915 1926.
346
Metcalfe, C.D., Koenig, B.G., Bennie, D.T., Servos, M., Ternes, T.A., and Hirsch, R.
347
(2003) Occurrence of neutral and acidic drugs in the effluents of canadian sewage
348
treatment plants.
" &
55: 2872 2880.
349
Meyer, F., Paarmann, D., D'Souza, M., Olson, R., Glass, E.M., Kubal, M. et al. (2008)
350
The metagenomics RAST server a public resource for the automatic
351
phylogenetic and functional analysis of metagenomes.
3:
352
386.
353
Neu, T.R., Swerhone, G.D.W., Bockelmann, U., and Lawrence, J.R. (2005) Effect of
354
CNP on composition and structure of lotic biofilms as detected with lectin
355
specific glycoconjugates. )
46: 283–294.
356
Ng, W. L., Kazmierczak, K.M., Robertson, G.T., Gilmour, R., and Winkler, M.E. (2003)
357
Transcriptional regulation and signature patterns revealed by microarray analyses
358
of
R6 challenged with sublethal concentrations of
359
translation inhibitors. '
+6.: 359 370.
360
Van Gemerden, H. (1993) Microbial mats: a joint venture.
( ++4: 3–25.
361
Waiser, M.J., Tumber, V., and Holm, J. (2011a) Effluent dominated streams Part I:
362
Presence and effects of excess nitrogen and phosphorus in Wascana Creek, SK.
363
" &
42: 496 507.
364
Waiser, M.J., Tumber, V., and Holm, J. (2011b) Effluent dominated streams Part II:
365
Presence and possible effects of pharmaceuticals and personal care products in
366
Wascana Creek, SK.
" &
42: 508 519.
367
Yergeau, E., Bokhorst, S., Huiskes, A.H.L., Boschker, H.T.S., Aerts, R., and Kowalchuk,
368
G.A. (2007) Size and structure of bacterial, fungal and nematode communities
369
along an Antarctic environmental gradient.
.3: 436–451.
370
Yergeau, E., and Kowalchuk, G.A. (2008) Responses of Antarctic soil microbial
371
communities and associated functions to temperature and freeze thaw cycle
372
frequency.
+2: 2223–2235.
373
Yergeau, E., Lawrence, J.R., Korber, D.R., Waiser, M.J., and Greer, C.W. (2010) Meta
374
transcriptomic analysis of the response of river biofilms to pharmaceutical
375
products using anonymous DNA microarrays.
1,: 5432
376
5439.
377
Yergeau, E., Bokhorst, S., Kang, S., Zhou, J.Z., Greer, C.W., Aerts, R., and Kowalchuk,
378
G.A. (2012) Shifts in soil microorganisms in response to warming are consistent
379
across a range of Antarctic environments. *
' ,: 692 702.
380
381
For Peer Review Only
+: Sequencing statistics (average per sample). Total DNA and RNA were
382
simultaneously extracted from 500 mg biofilm subsamples (Yergeau
, 2007;
383
Yergeau and Kowalchuk, 2008). Pyrosequencing of 16S rRNA gene amplicons was
384
performed as previously described (Bell
, 2011). mRNA was enriched using the
385
MicrobExpress kit (Ambion, Austin, TX). mRNA was then sent for cDNA generation,
386
library construction and Roche 454 GS FLX Titanium sequencing at The Centre for
387
Applied Genomics, The Hospital for Sick Children, Toronto, ON, Canada. Sequence data
388
produced in the current study were deposited in the GenBank database under accession
389
numbers XX000000 to XX000000 (16S rRNA gene amplicons) and XX000000 to
390
XX000000 (RNA).
391
Raw After rRNA removal nb reads bp nb reads bp +, %# ) ( CO 37,979 7,675,660 ER 19,789 4,051,123 GM 21,959 4,527,673 SL 26,723 5,466,712 SN 33,300 7,088,289 %# ) ( CO 73,762 13,846,719 16,718 1,543,302 ER 76,223 18,191,920 20,619 3,080,393 GM 58,574 12,205,107 12,499 1,197,220 SL 91,372 18,655,602 34,077 4,149,027 SN 63,410 15,806,579 12,183 1,431,968392
393
394
395
For Peer Review Only
5: Bacterial genera that showed significant differences between treatments and
396
controls for their relative abundance based on 16S rRNA gene amplicons. Significance
397
was measured using a t test carried out with the R package. Fold change was calculated
398
as the average for the treatment divided by the average for the control. If the fold change
399
was lower than 1, it was reversed (1/x) and made negative. If one of the two averages
400
used for fold change calculation was equal to zero, it was replaced by the minimal value
401
(1 sequence detected among all replicates) and values are given as “greater than” or
402
“lower than” the value obtained. See legend to Figure 1 for more details about 16S rRNA
403
gene amplicon analysis.
404
avg. CO avg. treat. Fold change
P value Phylum/Class Genus/Group
ER 0.00774 0.01248 1.61 0.023 GpIV 0.00003 0.00000 < 4.76 0.036 0.00004 0.00000 < 6.97 0.048 0.00002 0.00008 4.60 0.049 - & GM 0.00774 0.01281 1.65 0.035 GpIV 0.00002 0.00008 3.55 0.044 . / SL 0.00007 0.00000 < 15.11 0.013 0.00066 0.00034 1.97 0.032 0.00022 0.00040 1.87 0.038 0.00006 0.00000 < 13.60 0.040 % 0.00008 0.00003 3.30 0.040 0.00004 0.00000 < 9.91 0.048 SN 0.00022 0.00051 2.36 0.013 0.00001 0.00018 13.21 0.019 # / 0.00093 0.00194 2.08 0.022 -+ OD1_genera_incertae_sedis 0.00007 0.00003 2.11 0.043 0.00032 0.00081 2.51 0.044 *
405
406
For Peer Review Only
4: Bacterial species that showed significant differences between treatments and
407
controls for their relative abundance based on classified mRNA sequences in MG RAST
408
v. 2.0. Significance was measured using a t test carried out with the R package. See
409
legend to Table 2 for details about fold change calculation. See legend to Figure 3 for
410
more details about mRNA sequence analysis.
411
avg. CO avg. treat. Fold change
P value Phylum/Class Species ER 0.00 0.14 >8.05 0.001 0.00 0.14 >8.05 0.001 0.00 0.14 >8.05 0.001 0.32 0.03 10.62 0.023 0.04 0.22 5.95 0.027 bacterium 0.00 0.15 >8.63 0.043 0 0.00 0.07 >4.31 0.043 0.00 0.07 >4.31 0.043 0.00 0.06 >3.74 0.048 & -0.00 0.06 >3.74 0.048 0 5.23 2.35 2.23 0.049 GM 0.43 0.06 6.66 0.022 0.32 0.04 8.19 0.019 1 SL 0.05 0.51 11.06 0.004 0.09 0.98 10.55 0.004 - -0.00 0.04 >2.44 0.004 0.00 0.04 >2.44 0.004 ( 0.00 0.04 >2.44 0.004 ! 0.00 0.04 >2.44 0.004 2 0.00 0.04 >2.44 0.004 0.00 0.04 >2.44 0.004 3 0.00 0.13 >7.32 0.004 " ( ( 0.00 0.08 >4.88 0.004 bacterium 0.00 0.08 >4.88 0.004 2 0.00 0.08 >4.88 0.004 - ( 1.01 4.16 4.11 0.009 0.41 1.11 2.73 0.010 -0.00 0.16 >9.45 0.016 0.04 0.26 7.01 0.019 0.00 0.43 >25.01 0.020 4 0.04 0.42 11.36 0.022 -0.08 0.32 3.81 0.023 marine actinobacterium 0.00 0.12 >7.01 0.023 5 0.00 0.12 >7.01 0.023 " 0.00 0.24 >14.03 0.023 1 0.05 0.30 6.55 0.025 & 0.00 0.13 >7.63 0.030 ( 0.35 0.53 1.50 0.032 & % &
For Peer Review Only
0.04 0.29 7.86 0.034 0.04 0.39 10.38 0.037 0.00 0.08 >4.57 0.038 ( 0 0.08 0.29 3.50 0.039 0.05 0.29 6.20 0.040 ( 0.00 0.09 >5.19 0.042 - & 0.00 0.18 >10.37 0.042 1 0.43 0.10 4.08 0.042 0.07 0.40 5.32 0.043 & 0.04 0.21 5.61 0.044 0.04 0.18 4.91 0.045 % 0.00 0.19 >11.28 0.047 4 0.00 0.23 >13.12 0.049412
413
414
For Peer Review Only
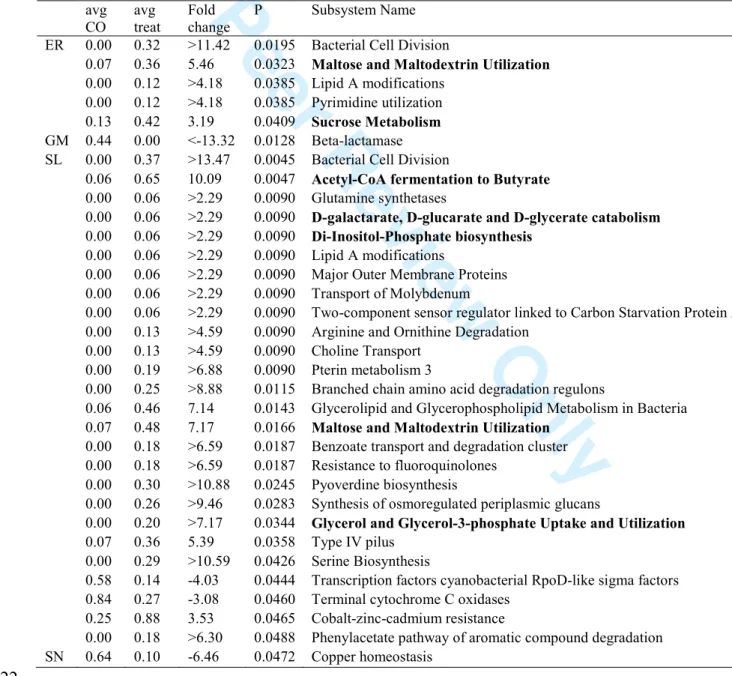
-: Subsystems that showed significant differences between treatments and controls
415
for their relative abundance based on classified mRNA sequences in MG RAST v. 2.0.
416
Significance was measured using a t test carried out with the R package. Subsystems
417
related to carbohydrate metabolism are in boldface. Details about the individual reads
418
classified in each subsystem are available in supplementary Table S1. See legend to
419
Table 2 for details about fold change calculation. See legend to Figure 3 for more details
420
about mRNA sequence analysis.
421
avg CO avg treat Fold change P Subsystem Name ER 0.00 0.32 >11.42 0.0195 Bacterial Cell Division0.07 0.36 5.46 0.0323 & & 7
0.00 0.12 >4.18 0.0385 Lipid A modifications 0.00 0.12 >4.18 0.0385 Pyrimidine utilization 0.13 0.42 3.19 0.0409 &
GM 0.44 0.00 < 13.32 0.0128 Beta lactamase SL 0.00 0.37 >13.47 0.0045 Bacterial Cell Division
0.06 0.65 10.09 0.0047 ' 8* ' 9
0.00 0.06 >2.29 0.0090 Glutamine synthetases
0.00 0.06 >2.29 0.0090 :8 :8 :8
0.00 0.06 >2.29 0.0090 : 8/ 8)
0.00 0.06 >2.29 0.0090 Lipid A modifications
0.00 0.06 >2.29 0.0090 Major Outer Membrane Proteins 0.00 0.06 >2.29 0.0090 Transport of Molybdenum
0.00 0.06 >2.29 0.0090 Two component sensor regulator linked to Carbon Starvation Protein A 0.00 0.13 >4.59 0.0090 Arginine and Ornithine Degradation
0.00 0.13 >4.59 0.0090 Choline Transport 0.00 0.19 >6.88 0.0090 Pterin metabolism 3
0.00 0.25 >8.88 0.0115 Branched chain amino acid degradation regulons
0.06 0.46 7.14 0.0143 Glycerolipid and Glycerophospholipid Metabolism in Bacteria
0.07 0.48 7.17 0.0166 & & 7
0.00 0.18 >6.59 0.0187 Benzoate transport and degradation cluster 0.00 0.18 >6.59 0.0187 Resistance to fluoroquinolones
0.00 0.30 >10.88 0.0245 Pyoverdine biosynthesis
0.00 0.26 >9.46 0.0283 Synthesis of osmoregulated periplasmic glucans
0.00 0.20 >7.17 0.0344 % % 848 7 0 7
0.07 0.36 5.39 0.0358 Type IV pilus 0.00 0.29 >10.59 0.0426 Serine Biosynthesis
0.58 0.14 4.03 0.0444 Transcription factors cyanobacterial RpoD like sigma factors 0.84 0.27 3.08 0.0460 Terminal cytochrome C oxidases
0.25 0.88 3.53 0.0465 Cobalt zinc cadmium resistance
0.00 0.18 >6.30 0.0488 Phenylacetate pathway of aromatic compound degradation SN 0.64 0.10 6.46 0.0472 Copper homeostasis
For Peer Review Only
;
423
;
+: Bacterial community composition for the controls (CO) and the erythromycin
424
(ER), gemfibrozil (GM), sulfamethoxazole (SL) and sulfamethazine (SN) treatments.
425
Community composition was calculated based on the relative abundance of phylum
426
classified 16S rRNA genes sequences (a) or the relative abundance of the phylum
427
classified mRNA sequences (b). Analysis of the 16S rRNA gene amplicons was carried
428
out essentially as previously described (Bell
, 2011; Yergeau
, 2012). Sequence
429
data were analyzed mainly by using the RDP pyrosequencing pipeline
430
(http://pyro.cme.msu.edu/). The sequences were then deconvoluted and binned according
431
to their multiplex tags, and the tag was trimmed by using the Pipeline Initial Process tool.
432
Datasets were individually classified using the RDP Classifier tool with a 50% bootstrap
433
cutoff.
434
;
5: Venn diagram showing the overlap in the detection of organisms (a) and
435
subsystems (b) in the erythromycin (ER), gemfibrozil (GM), sulfamethoxazole (SL) and
436
sulfamethazine (SN) treatments. Diagrams were drawn using VENNY
437
(
http://bioinfogp.cnb.csic.es/tools/venny/index.html
) based on presence absence of the
438
subsystems or the organisms in the datasets pooled for each treatment following analysis
439
in MG RAST v. 2.0. See legend of Figure 3 for more details about mRNA sequences
440
analysis.
441
;
4: Functional microbial community composition for the controls (CO) and the
442
erythromycin (ER), gemfibrozil (GM), sulfamethoxazole (SL) and sulfamethazine (SN)
443
treatments. The sequences were deconvoluted and binned according to their MID tags,
444
and the MID was trimmed using custom made Perl scripts. Sequences from each sample
445
For Peer Review Only
were then compared against a database containing representative bacterial and archaeal
446
16S and 23S and fungal and algal 18S and 28S sequences using the local NCBI blastall
447
program (blastn option). All sequences having significant hits to the database (e value of
448
10
5or less) were removed from the dataset, leaving mostly mRNA sequences. The
449
sequences were then annotated using the MG RAST server version 2.0 (Meyer
,
450
2008). The maximum e value for a significant match was set to 10
5and the minimum
451
alignment length was set to 50 bp.
452
;
-: Metabolic network analysis for (a) controls, (b) erythromycin and (c)
453
sulfamethoxazole. The pathways detected are highlighted in blue. The metabolic network
454
analyses were carried out in MG RAST v 3.0 using the KEGG mapper tool. The
455
maximum e value for a significant match was set to 10
5and the minimum alignment
456
length was set to 50 bp. See legend to Figure 3 for more details about mRNA sequence
457
analysis.
458
For Peer Review Only
460
Supplementary Table S1: Subsystems that showed significant differences between
461
treatments and controls for their relative abundance based on classified mRNA sequences
462
in MG RAST v. 2.0. Significance was measured using a t test carried out with the R
463
package. Details about the individual reads classified in each subsystem are given.
464
For Peer Review Only
!" !# $ % & ' ()! #* + & ' #* + $ * ()! #* % & $ ,-((. / $ ,-(, $ ! + % 01 + 233 $ $ $ 3 $ 4 + % & % 1 5 1 $ 0 % & 01 % 6-7 $ (89 ,,8 )-- )-- 015
For Peer Review Only
!" !# $ % ##& '(( $ $ $ ( ( ( $ ) ) *!+ $ ,$-$ ! . / #* 0 $ 12 343 /-- /-- %56For Peer Review Only
!" !# $ % & ' ( )* )* ' + $ ! & ' ( ,-! ./! ,0! .0! & # 1) $ 2 & ( 3( ,435 ' ( ( #2 & $ % & ' 3 2!% ( ( .$4 $ .440 $ % 3( ' ,435 ' 54 $ ,., 0/ /44 /44 *+)
For Peer Review Only
!"# $ % &
'( $ )& *
*& # + % !,"
For Peer Review Only
Treatment P-value Subsystem Hierarchy 1
ER 0.0195 Cell Division and Cell Cycle
ER 0.0323 Carbohydrates
ER 0.0385 Cell Wall and Capsule
For Peer Review Only
GM 0.0128 Virulence
For Peer Review Only
For Peer Review Only
SL 0.0048 Clustering-based subsystems
SL 0.0090 Amino Acids and Derivatives
SL 0.0090 Carbohydrates
SL 0.0090 Carbohydrates
SL 0.0090 Cell Wall and Capsule
SL 0.0090 Cell Wall and Capsule
SL 0.0090 Clustering-based subsystems
SL 0.0090 Membrane Transport
SL 0.0090 Unclassified
For Peer Review Only
SL 0.0090 Membrane Transport
SL 0.0090 Cofactors, Vitamins, Prosthetic Groups, Pigments
For Peer Review Only
For Peer Review Only
SL 0.0166 Carbohydrates
SL 0.0187 Metabolism of Aromatic Compounds
For Peer Review Only
SL 0.0231 Clustering-based subsystems SL 0.0245 Virulence SL 0.0283 Stress Response SL 0.0296 Clustering-based subsystems SL 0.0309 Clustering-based subsystemsFor Peer Review Only
SL 0.0344 Carbohydrates
For Peer Review Only
SL 0.0426 Amino Acids and Derivatives
For Peer Review Only
SL 0.0460 Respiration
For Peer Review Only
SL 0.0465 Protein Metabolism
SL 0.0488 Metabolism of Aromatic Compounds
For Peer Review Only
Subsystem Hierarchy 2Cell cycle in Prokaryota
Di- and oligosaccharides
Capsular and extracellular polysacchrides
For Peer Review Only
Di- and oligosaccharidesResistance to antibiotics and toxic compounds Cell cycle in Prokaryota
For Peer Review Only
FermentationFor Peer Review Only
Fatty acid metabolic clusterGlutamine, glutamate, aspartate, asparagine; ammonia assimilation
Monosaccharides
Sugar alcohols
Capsular and extracellular polysacchrides Gram-Negative cell wall components
Sarcosine oxidase Unclassified
Unclassified
For Peer Review Only
UnclassifiedFolate and pterines
For Peer Review Only
PhospholipidsFor Peer Review Only
Di- and oligosaccharidesUnclassified
For Peer Review Only
Cytochrome biogenesisIron Scavenging Mechanisms Osmotic stress
Putative asociate of RNA polymerase sigma-54 factor rpoN
For Peer Review Only
Sugar alcoholsFor Peer Review Only
Alanine, serine, and glycineFor Peer Review Only
Electron accepting reactionsFor Peer Review Only
Protein biosynthesisMetabolism of central aromatic intermediates Unclassified
For Peer Review Only
CONTROLSubsystem Name Relative abundance
Bacterial Cell Division 0.00
Maltose and Maltodextrin Utilization 0.07
Lipid A modifications 0.00
For Peer Review Only
Beta-lactamase 0.44
For Peer Review Only
For Peer Review Only
CBSS-218491.3.peg.427 0.06
Glutamine synthetases 0.00
D-galactarate, D-glucarate and D-glycerate catabolism 0.00
Di-Inositol-Phosphate biosynthesis 0.00
Lipid A modifications 0.00
Major Outer Membrane Proteins 0.00
CBSS-188.1.peg.6170 0.00
Transport of Molybdenum 0.00
Two-component sensor regulator linked to Carbon Starvation Protein A 0.00
For Peer Review Only
Choline Transport 0.00
Pterin metabolism 3 0.00
For Peer Review Only
For Peer Review Only
Maltose and Maltodextrin Utilization 0.07
Benzoate transport and degradation cluster 0.00
For Peer Review Only
CBSS-196164.1.peg.1690 0.13
Pyoverdine biosynthesis new 0.00
Synthesis of osmoregulated periplasmic glucans 0.00
CBSS-316057.3.peg.1308 0.13
For Peer Review Only
Glycerol and Glycerol-3-phosphate Uptake and Utilization 0.00
For Peer Review Only
Serine Biosynthesis 0.00
For Peer Review Only
Terminal cytochrome C oxidases 0.84
For Peer Review Only
Ribosome SSU bacterial 2.06
Phenylacetate pathway of aromatic compound degradation 0.00
For Peer Review Only
fragment organism None NA None NoneFor Peer Review Only
NANA None
For Peer Review Only
NAFor Peer Review Only
NA None None None None None None None None NoneFor Peer Review Only
NoneNone
For Peer Review Only
4451548.3 GLP7T0L01AO7AP Clostridium botulinum (strain Alaska E43 / Type E3)For Peer Review Only
NANone
For Peer Review Only
NA None None None NoneFor Peer Review Only
None4451547.3 GLP7T0L01C2E4W Anabaena variabilis ATCC 29413
4451547.3 GLP7T0L01BC61H Trichodesmium erythraeum IMS101
4451547.3 GLP7T0L01CW8DA Cyanothece sp. PCC 8801
4451547.3 GLP7T0L01CW8DA Cyanothece sp. PCC 8801
4451547.3 GLP7T0L01BI96X Thermosynechococcus elongatus BP-1
4451548.3 GLP7T0L01C7MDW Nostoc punctiforme PCC 73102
4451548.3 GLP7T0L01C4CO9 Anabaena variabilis ATCC 29413
4451548.3 GLP7T0L01DO9Z9 Trichodesmium erythraeum IMS101
For Peer Review Only
None4451546.3 GLP7T0L01DGH06 Crocosphaera watsonii WH 8501
4451547.3 GLP7T0L01A1CAI Thermosynechococcus elongatus BP-1
4451547.3 GLP7T0L01EYMX8 Trichodesmium erythraeum IMS101
For Peer Review Only
4451548.3 GLP7T0L01AL1I2 Synechococcus elongatus PCC 7942
4451548.3 GLP7T0L01D1I7N Cyanothece sp. PCC 7424
4451547.3 GLP7T0L01A1CAI Cyanothece sp. PCC 7424
4451547.3 GLP7T0L01C3Q0E Microcystis aeruginosa NIES-843
4451547.3 GLP7T0L01EQFSU Chitinophaga pinensis DSM 2588
4451548.3 GLP7T0L01DPFP4 Geobacter metallireducens (strain GS-15 / ATCC 53774 / DSM 7210)
For Peer Review Only
4451547.3 GLP7T0L01C0P3T Thermosynechococcus elongatus BP-1
4451547.3 GLP7T0L01CM0UL Mycoplasma bovis PG45
4451547.3 GLP7T0L01BLIF5 Syntrophobacter fumaroxidans MPOB
4451547.3 GLP7T0L01B162W Polaromonas sp. JS666
4451547.3 GLP7T0L01AWTD0 Anabaena variabilis ATCC 29413
4451547.3 GLP7T0L01BQXAI Anabaena variabilis ATCC 29413
4451547.3 GLP7T0L01BQXAI Anabaena variabilis ATCC 29413
4451547.3 GLP7T0L01CQS56 Flavobacterium psychrophilum JIP02/86
4451548.3 GLP7T0L01D58NM Bacteroides thetaiotaomicron VPI-5482
4451548.3 GLP7T0L01D7IDN Odontella sinensis (Marine centric diatom) (Biddulphia sinensis)
4451548.3 GLP7T0L01CLEFI Moorella thermoacetica ATCC 39073
4451548.3 GLP7T0L01A4P52 Idiomarina loihiensis L2TR
4451548.3 GLP7T0L01DKEK6 Cyanothece sp. PCC 7425
4451548.3 GLP7T0L01EOQB4 Synechocystis sp. PCC 6803
4451548.3 GLP7T0L01E4M7U Cyanothece sp. PCC 8801
4451546.3 GLP7T0L01DXVN9 Anabaena variabilis ATCC 29413
4451546.3 GLP7T0L01CNFZ2 Streptococcus pyogenes MGAS9429 (serotype M12)
None
4451547.3 GLP7T0L01BB1GN Methylobacillus flagellatus KT
For Peer Review Only
SEED IDFor Peer Review Only
fig|508767.4.peg.1922For Peer Review Only
fig|240292.3.peg.1529 fig|203124.1.peg.4584 fig|41431.3.peg.337 fig|41431.3.peg.337 fig|197221.1.peg.122 fig|63737.4.peg.707 fig|240292.3.peg.883 fig|203124.1.peg.4675 fig|240292.3.peg.883For Peer Review Only
fig|165597.1.peg.4227 fig|197221.1.peg.264 fig|203124.1.peg.5211 fig|313603.3.peg.757
For Peer Review Only
fig|65393.5.peg.2897 fig|65393.5.peg.2897 fig|449447.3.peg.2110 fig|485918.5.peg.3066 fig|269799.3.peg.279For Peer Review Only
fig|197221.1.peg.94 fig|347257.4.peg.550 fig|335543.6.peg.2185 fig|296591.1.peg.2817 fig|240292.3.peg.2134 fig|240292.3.peg.2134 fig|240292.3.peg.2134 fig|402612.4.peg.449 fig|226186.1.peg.2785 fig|2839.1.peg.138 fig|264732.9.peg.2496 fig|283942.3.peg.432 fig|395961.4.peg.1270 fig|1148.1.peg.747 fig|41431.3.peg.1896 fig|240292.3.peg.1205 fig|370553.3.peg.46 fig|265072.7.peg.638 fig|324831.10.peg.1704For Peer Review Only
functionFor Peer Review Only
Alcohol dehydrogenase (EC 1.1.1.1); Acetaldehyde dehydrogenase (EC 1.2.1.10)For Peer Review Only
Multimodular transpeptidase-transglycosylase (EC 2.4.1.129) (EC 3.4.-.-) Multimodular transpeptidase-transglycosylase (EC 2.4.1.129) (EC 3.4.-.-) Multimodular transpeptidase-transglycosylase (EC 2.4.1.129) (EC 3.4.-.-) Multimodular transpeptidase-transglycosylase (EC 2.4.1.129) (EC 3.4.-.-) Type IV fimbrial assembly, ATPase PilB
Type IV pilin PilA
Type IV pilus biogenesis protein PilE Type IV pilin PilA
For Peer Review Only
Cyanobacteria-specific RpoD-like sigma factor, type-7
Cyanobacteria-specific RpoD-like sigma factor, type-2 @ Group 2 RNA polymerase sigma factor Cyanobacteria-specific RpoD-like sigma factor, type-2 @ Group 2 RNA polymerase sigma factor RNA polymerase sigma factor RpoD
For Peer Review Only
Group 2 RNA polymerase sigma factor @ Cyanobacteria-specific RpoD-like sigma factor, type-7 Cyanobacteria-specific RpoD-like sigma factor, type-3 @ Group 2 RNA polymerase sigma factor Cyanobacteria-specific RpoD-like sigma factor, type-3 @ Group 2 RNA polymerase sigma factorCytochrome c oxidase polypeptide II (EC 1.9.3.1)
Alternative cytochrome c oxidase polypeptide CoxP (EC 1.9.3.1) Cytochrome c oxidase polypeptide I (EC 1.9.3.1)
For Peer Review Only
SSU ribosomal protein S8p (S15Ae)SSU ribosomal protein S13p (S18e) SSU ribosomal protein S1p
SSU ribosomal protein S1p SSU ribosomal protein S7p (S5e) SSU ribosomal protein S7p (S5e) SSU ribosomal protein S7p (S5e) SSU ribosomal protein S2p (SAe) SSU ribosomal protein S15p (S13e)
SSU ribosomal protein S2p (SAe), chloroplast SSU ribosomal protein S7p (S5e)
SSU ribosomal protein S7p (S5e) SSU ribosomal protein S3p (S3e) SSU ribosomal protein S11p (S14e) SSU ribosomal protein S20p SSU ribosomal protein S11p (S14e) SSU ribosomal protein S10p (S20e)
Type cbb3 cytochrome oxidase biogenesis protein CcoI; Copper-translocating P-type ATPase (EC 3.6.3.4)