Atomistic Calculations of Rate of Long-timescale
Microstructural Evolution
by MASSACHUSETTS INSTITUTE
OF TECHNOLOGY
Timothy Tin-Ming Lau JUL 2 8 2009
B.S. Materials Science and Engineering
LIBRARIES
Cornell University, 2005ARCHIVES
SUBMITTED TOTHE DEPARTMENT OF MATERIALS SCIENCE AND ENGINEERING IN PARTIAL FULFILLMENT OF THE REQUIREMENTS FOR THE DEGREE OF
DOCTOR OF SCIENCE IN
MATERIALS SCIENCE AND ENGINEERING AT THE
MASSACHUSETTS INSTITUTE OF TECHNOLOGY
JUNE 2009
© 2009 Massachusetts Institute of Technology. All rights reserved.
Signature of Author:
--
Department of Materials Science and Engineering May 1, 2009Certified by:
SiIney Yip Professor of Nuclear Science and Engineering P ss of Materials Since and Engineering
Accepted by:
Christine Ortiz Professor of Materials Science and Engineering Chair, Departmental Committee on Graduate Students
Atomistic Calculations of Rate of Long-timescale
Microstructural Evolution
by
Timothy Tin-Ming Lau
Submitted to the Department of Materials Science and Engineering on May 1, 2009, in partial fulfillment of the
requirements for the degree of
Doctor of Science in Materials Science and Engineering
Abstract
The ability to investigate materials systems at the resolution of individual atoms makes computational simulations a powerful tool for the study of materials phenomena. However, microstructural evolution in complex materials is only meaningfully characterized in laboratory or industry applications by deformation rate and relevant rate coefficients, quantities that require sampling over a timescale too large for traditional atomistic methods to probe. New methods and techniques have to be developed in order to obtain useful information of rate from atomistic simulations. In this thesis, we explore a set of four problems, related to two long-timescale microstructual phenomena, creep and oxidation, and use a variety of atomistic methods appropriate to each problem to demonstrate the techniques of obtaining rate information.
Creep due to vacancy-driven dislocation climb critically depends on the movement of the vacancies in the bulk towards dislocation cores, and for the first contribution of the thesis we investigate the influence of carbon solute atoms on vacancy diffusion pathways in bulk BCC Fe. Using these results, we draw explanations of the trends of the experimentally-observed rate of creep.
It is well-known that vacancy energetics vary with distance from dislocation cores due to the dislocation strain field, but the effect this has on creep by the dislocation climb mechanism is not well understood. In the second contribution of the thesis, we present an investigation of the vacancy-dislocation interaction of BCC Fe. By obtaining the details of the unit processes of vacancy migration around a dislocation core and formulating this information appropriately for numerical techniques based on transition-state theory, we enable the calculation of the dislocation climb rate with full atomistic detail.
In the oxidation of metals, the transport of cations through the surface oxide film governs the overall material degradation. In the third contribution of the thesis, we present calculations of the energetics of defect formation and migration in nonstoichiometric Fe3-604spinel, which is closely related to the oxide film on Fe. We
provide an explanation of experimental integral measurements of diffusion rate in a mechanistic, unit-process way.
Creep of nanocrystalline materials is a new area of interest as fabrication techniques begin to impinge on this lengthscale; nonetheless, this phenomenon is not well understood and existing computational studies all involve unrealistic thermal or mechanical loading conditions. In the last contribution of the thesis, we present an investigation of the creep of Fe nanocrystals, employing a novel method of activating states to directly calculate a rate. We reach a rate regime that is inaccessible by traditional methods as well as identify some of the relevant unit processes in this type of creep.
The rates of these slow dynamics phenomena are all investigated on the basis of their atomistic unit processes. However, there are differences in how information of the unit processes is obtained from atomistic calculations and in how the properties of these unit processes are subsequently used to understand the overall rate. That different investigation approaches are needed is a direct result of the variation in the complexity of the microstructures, the number and predictability of atomic transition mechanisms, and the depth of existing experimental knowledge. These four studies therefore represent distinct, but complementary, challenges within the common theme of rate calculation. We conclude the thesis with an appraisal of the types of challenges encountered and with an evaluation of the approaches we took to the problems.
Thesis Supervisor: Sidney Yip
Titles: Professor of Nuclear Science and Engineering, Professor of Materials Science and Engineering
Acknowledgements
The success of the studies outlined within this thesis would not have been possible without the help of my scientific collaborators. I would like to thank these individuals:
* Dr. Clemens F6rst, for helping me understand how to perform ab initio calculations and learn the basic ideas of atomistic simulations
* Professor Julian Gale of the Curtin University of Technology, for modifying his GULP code [1] to enable me to use it to fit the potential described in Chapter 3 * Dr. Mukul Kabir, for performing the energy barrier calculations described in
Chapter 3, and for implementing the kinetic Monte Carlo scheme described in the end of Chapter 4
* Mr. Paul Monastario, for pushing the study in H effect on the Fe-C system far beyond where I left it off
* Professor Xi Lin of Boston University, for helping me understand some of the subtle physics involved in periodic systems and in extended defects
* Professor Rtidiger Dieckmann of Cornell University, for the extremely helpful discussions on the subtleties of the highly complex magnetite oxide
* Dr. Akihiro Kushima, the developer of the autonomous basin climbing method, for his help in adapting his original code to study Fe nanocrystals and for helpful discussions on calculating rate
* Professor Krystyn Van Vliet, for helpful discussions on the studies outlined in Chapters 3 and 4
My thesis committee members, Professor Bernhardt Wuensch and Professor Samuel Allen, for their valuable comments on this thesis text and for encouraging me to seek the connections between the four contributions in this thesis
Most of all, I cannot overstate the importance of my advisor Professor Sidney Yip to the success of this thesis. He has played a role in everything big and small, from the minor grammatical corrections to the concept of calculating rate from atomistic methods itself. I do not think it is possible to separate out and identify his contributions to the thesis, as his influence is evident on every single page. The very existence of the thesis document itself is testament to the assistance he has rendered me and my intellectual development and growth under his guidance over the last four years.
Research cannot be conducted without resources, and to that end I am grateful for support from the U.S. National Defense Science and Engineering Graduate Fellowship program and SKF Global. I have also benefitted from computational resources funded by
US National Science Foundation grant IMR-0414849.
I would be remiss if I did not acknowledge the indirect contribution made by my family. To them, eternal thanks for being my greatest and most persistent supporters.
MIT has been my home for the last 4 years. The experience arguably began with my application essay, which I started off with the words of Vergil, "felix qui potuit rerum cognoscere causas" (Georgics, 2.490). (The alert reader can recall this line inscribed over the east entrance of Building 6.) As I complete the journey by writing these last words of my thesis, it is only appropriate, for the sake of symmetry, that I conclude with another
immortal line of the master,
Contents
S Introduction ... . . ... 17
1.1 Slow Dynamics ... 17
1.2 Scope of Thesis ... 21
2 Coarse-Graining the Energy Landscape ... 23
2.1 The Energy Landscape Concept ... 23
2.2 Ab Initio and Empirical Energy Models ... 25
2.3 Energy Landscape Exploration ... 27
2.3.1 Energy Minima ... 27
2.3.2 Energy Saddle Points ... 28
3 Vacancy and Solute Interaction in Fe Supersaturated with Carbon Solute... 34
3.1 Experimental Background ... 34
3.2 Developing an Appropriate Energy Landscape ... 36
3.2.1 Potential Criteria and Benchmarking of Existing Potentials ... 36
3.2.2 Fitting Strategy...38
3.2.3 R esults... ... . . ... 39
3.3 Defect Population Spectrum ... 41
3.4 Defect Migration Energetics ... 44
3.5 Diffusion Rate and Comparison with Experimental Creep Rate ... 46
3.6 Extension to Hydrogen-Containing Iron Alloys ... 50
4 Vacancy-Dislocation Interaction in BCC Fe ... 51
4.1 Past Work ... 51
4.2 M odel System ... 52
4.3 Unit Processes of Dislocation Climb ... 55
4.3.1 Vacancy-Core Binding and Evolution of Dislocation Structure ... 55
4.3.2 Vacancy Away from the Core... 57
5 Cation Diffusion in Nonstoichiometric Fe3_6O4 Spinel ... 64
5.1 P ast Studies ... ... 64
5.1.1 Oxide Layer on Fe Structure and Its Relation to the Fe3-_04 Spinel ... 64
5.1.2 Previous Experimental Studies of Diffusion in Fe3-04... 65
5.1.3 Previous Computational Studies of Diffusion in Fe3-604 ... . . ... 67
5.2 Calculations of Defect Formation and Migration Energetics ... 68
5.2.1 Defect Formation ... 71
5.2.2 Diffusion Mechanisms ... 73
5.3 Diffusivity in Fe3-504: Experiments and Atomistic Calculations ... 75
6 Creep in N anocrystalline Fe ... 79
6.1 State of Understanding and of Computer Simulations ... 79
6.2 An Alternate Approach to Creep ... ... 82
6 .3 F ind in g s... ... 84
6.3.1 Energy Evolution ... 84
6.3.2 Grain-boundary Creep Mechanisms ... 86
6.3.3 Direct Rate Calculation... ... 88
6.4 Sum m ary ... ... 9 1 7 Retrospect and Prospect - Obtaining Rate from Computation Studies...92
B ibliography ... ... 99
List of Figures
Figure 2-1: A schematic of the energy landscape for a vacancy diffusion problem in a one dim ensional atom ic lattice ... 23 Figure 2-2: The autonomous basin climbing (ABC) technique. (a) A schematic
representation of the method - an energy minimized initial structure is activated by imposing on the energy landscape D a Gaussian energy penalty ' (centered at the original configuration), which causes the system to climb up the basin into a higher energy configuration. Repeated application of the energy penalties will eventually cause the system to move to another energy minimum. (b) An illustration of the results obtained
from ABC, where a series of interconnected energy minima and saddle point transitions between them is obtained. Activation barrier between two minima i andj, AUG, is
defined by the saddle energy between the two as shown in the inset ... 31 Figure 2-3: The viscosity of supercooled liquids as calculated using the ABC method (solid and dashed curves) [37] in comparison with experimental measurements (symbols [40]). I and II denote amorphous SiO2 [38] and binary Lennard-Jones model [39], respectively. The inset shows the extracted activation barriers as a function of
temperature. Tg is the glass transition temperature where the viscosity is 1013 poise ... 33 Figure 3-1: Experimental creep strain rates in high-carbon steel. (a) Normalized strain rates d6/dt increase strongly with increasing normalized stress a, where D, is Fe self-diffusivity and E is elastic modulus. Experiments were conducted at TIT - 0.45, where the creep strain rates were readily measurable. The power-law stress dependence n of 5-8 is a signature of creep by the vacancy-driven dislocation climb mechanism [9]. (b) At a given stress magnitude, creep strain rates decrease with increasing carbon content. Data from [42, 43, 9]... 35 Figure 3-2: Concentrations of various defect species. Calculations were performed at fixed [Va,o ] of 0.005 (an arbitrary value) at varying [Cro,] for 450 K, as discussed in
Section 3.3. Only the most numerically prevalent defect clusters are shown on the plot. The trends, general across any temperature and at any other total vacancy content, are a consequence of the large driving force for defect clusters formation... 43
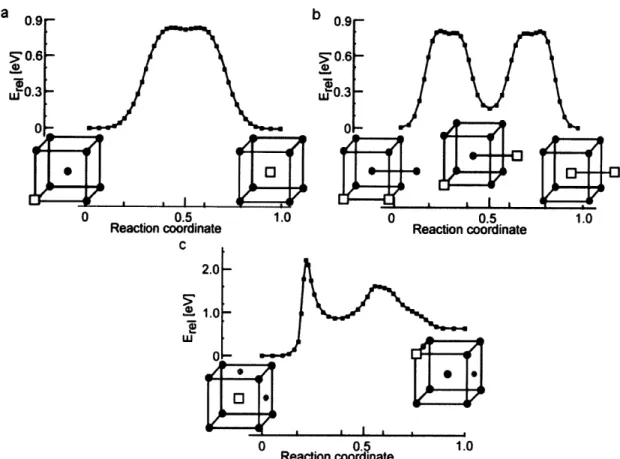
Figure 3-3: Migration energy barriers of the most statistically abundant point defect clusters in BCC Fe-C. (a) Monovacancy; (b) divacancy; and (c) carbon-vacancy cluster in BCC iron-carbon alloy. Relative energy-reaction coordinate pathways are obtained using NEB sampling of minimum energy pathways. Fe atoms are denoted by black circles, Fe vacancies by squares, and C solute by gray circles. ... ... 45 Figure 3-4: Fe self-diffusion coefficient D* as a function of carbon concentration. For 0.5 at. % vacancies at three operating temperatures (T = 300, 450 and 600 K), diffusivity decreases with increasing carbon content and becomes negligible when carbon
concentration exceeds twice the assumed local vacancy concentration ... 49 Figure 4-1: Quadrupolar system containing two different dislocation core configurations. (a) An atom-centered core. (The Greek letters define planes referred to in subsequent
discussions.) (b) A bond-centered core. (c) Various positions around the core as referred to in Table 4.2. (d) Five (A, B, C, D, and E) possible pathways of vacancy movement towards the core referred to in the text. Figure generated with Atomeye [78]... 54 Figure 4-2: Atomistic schematic of climb. (a) The initiation of a jog by the binding of a vacancy to the dislocation line. (b) The expansion of the jog by binding of a vacancy to the end of a line of vacancies in the core. (c) The coalescence of two discrete jogs. The line direction of the dislocation system in this work is [11 ... 56 Figure 4-3: Vacancy and dislocation core interaction energy as a function of the number of nearest neighbor jumps of the vacancy away from an otherwise "pure" dislocation core in Path A, relative to a vacancy in a pure bulk. Values at whole numbers of jumps
represent the energies of vacancies at an atomic site obtained by conjugate gradients minimization. These are to be compared with the predictions of elasticity theory and with the findings of Clouet [70]. We further include the energy barriers that arise from
movement of the vacancy between discrete lattice points, where the points between whole numbers jumps represent the minimum energy path for the jump obtained by the NEB method and the peaks correspond to the migration barriers. For reference, the
migration of the vacancy in bulk is 0.84 eV (see Figure 3-3(a)) ... 59 Figure 4-4: (a) Interaction energy of a pure dislocation and a single vacancy as a function of the number of nearest neighbor jumps of the vacancy away from the otherwise
unjogged dislocation core for paths specified in Figure 4-1(a), relative to a vacancy in a pure bulk. The points between whole numbers of jumps mark the vacancy migration energies. Note that Paths A, B, and C are on the compressive side of the dislocation core, while Paths D and E are on the tensile side of the dislocation core. The difference
between the compressive and tensile nature gives rise to two distinct values for E"" at the 0th nearest neighbor from the core. For reference, the vacancy migration barrier from
the core position on the compressive side to the core position on the tensile side (i.e. from position I to II in Figure 4-1) is 1.73 eV. (b) Interaction energy between an unjogged dislocation segment and a single vacancy versus the number of nearest neighbor jumps of the vacancy away from an otherwise unjogged dislocation core in paths specified in (c), relative to a vacancy in the pure bulk. For Paths AI and Paths AII, the vacancy joins another vacancy in the core to form a line of two vacancies at the core. For Path AIII, the vacancy joins two separate lines of 2 vacancies each to form a continuous jog of 5 vacancies in the core. The energetics of the single vacancy traveling on Path A is included as well for comparison. (c) Paths AI, AII, and AIII referred to in (b). Refer to Figure 4-1 for definitions of paths and planes. ... 60 Figure 4-5: The scheme to represent an edge-type dislocation in a regular lattice for kMC simulations. (a) The edge dislocation to be simulated. (b) The regular lattice, with the plane outlined in gray which must be removed to simulate the edge dislocation in (a). (c) The conceptual removal of this additional plane by creating the nearest neighbor
relationships signified by the arrows. ... 63 Figure 5-1: The primitive cell for the Fe3-504 spinel. The black and gray atoms represent Fe atoms in octahedral and tetrahedral positions respectively and the white atoms
represent O atoms. Following the standard notation [86], the gray atom with the vertical cross will be referred to as a type B tetrahedral interstitial while the gray atom with the diagonal cross will be referred to as a type C tetrahedral interstitial. The black atom with the cross refers to an octahedral interstitial... ... 65
Figure 5-2: Experimentally measured deviation from stoichiometry 6 in Fe3-504 at 1473 K as a function of oxygen activity. The free energy of formation of defects could be inferred from such data. (Figure 10 of [89].) ... ... ... 66 Figure 5-3: Experimentally measured cation diffusivity in Fe3-0 4 at 1473 K as a function of oxygen activity. (Figure 10 of [89].) ... ... 67 Figure 5-4: The octahedral-octehedral-tetrahedral vacancy (OOTV) interstitial defect configuration is formed around a tetrahedral vacancy (square) adjacent to two octahedral interstitials (black with diagonal cross). A dark gray line marks the "axis" of the defect. The OOTV configuration could be thought of as the midpoint of interstitialcy diffusion mechanism 2 (following the standard notation [86], see Figure 5-5) ... 72
Figure 5-5: Various interstitialcy diffusion pathways in Fe3_604. The component moves of each jump are designated by the numbers it is designated in [86]... 74 Figure 6-1: The model systems of spherical and columnar grains. (a) Snapshot of the atoms within the simulation cell, which contains 2 spherical grains of BCC Fe, randomly oriented versus each other. The grains themselves are positioned in a BCC array within the simulation cell. (b) The simulation cell of the spherical grains in the context of the periodic boundary condition. (c) Snapshot of the atoms within the simulation cell, which contains 4 columnar grains arranged in a close packed 2D lattice. (d) The simulation cell of the columnar grains in the context of the periodic boundary condition. The atomic configurations are colored by coordination, where darker atoms indicate imperfect coordination and could be used as a rough guide for visualizing the grain boundaries. Figure generated with Atomeye [78] ... ... 83
Figure 6-2: (a) Results of the energy evolution of the simulated creep trajectories for the spherical grains, at 0.2 GPa and 0.7 GPa. (b) Schematic of the energy evolution during the creep of nanograins, illustrating the key features. We find that the trajectory follows through a series of energy saw-tooth oscillations in between sharp energy relaxations. These features are general for both the spherical and columnar grains ... 85 Figure 6-3: Atomic displacements during creep for the spherical grain at 0.2 GPa. The features are general for both spherical and columnar grains. (a) Localized grain-boundary response, obtained from a comparison of 2 atomic configurations separated by an energy saw-tooth. (b) Injection of an interstitial atom into the grain boundary by the collective displacements of atoms along (111) direction which is the nearest neighbour direction in the BCC lattice, obtained from a comparison of 2 atomic configurations at the end of two successive energy drops (i.e. separated by a series of saw-tooth oscillations and one energy drop). Atoms that have displaced more than 0.1 A or more are marked in red/dark shade. The arrows mark the direction and relative magnitude of atomic displacements. Each inset shows the enlarged area (small rectangle) relative to the bulk (spherical grain) and surrounding boundary in each case. Thus displacements in (a) occur entirely in the boundary, whereas displacements in (b) start in the grain (bulk) and end up in the
boundary region. Figure generated with XCrysDen [108]. ... ... 86 Figure 6-4: A comparison of the extent of atomic movement in the spherical grains. (a) The atomic movements at 0.2 GPa, obtained from a comparison of 2 atomic
configurations between two successive energy relaxations. (b) The same for 0.7 GPa. Bulk atoms are colored yellow, atoms near the grain boundary are colored blue, and atoms that have displaced more than 0.1 A or more are marked in red. Figure generated w ith X C rysD en [108]... ... 87 Figure 6-5: The strain rate of the columnar grain system at 0.2 GPa and 300 K. (a) We begin with the energy of transition between the energy minima as we sample the energy landscape. (b) Using the rate equation and an assumed frequency factor v of 10 THz, we are able to obtain the time of transition between each minimum. (c) The strain calculated from the cell dimension of the atomic configuration for each energy minimum. (d)
Combining the time information (b) with the cell dimensions of the atomic configurations at the different minima (c), we obtain a plot of the strain as a function of time. Fitting a
line to (d) yields the strain rate of 0.52 x 10 s-1 ... 89
Figure 6-6: The strain as a function of time for the spherical grain stressed at 0.2 GPa and 0.7 GPa at 300K. These curves correspond to the energy trajectories seen in Figure 6-2. From fits to the plots we obtain estimates of strain rate of 1 x 10⁴ s-1 at 0.2 GPa and 7 x
104
List of Tables
Table 3.1: Fitted parameters of the Fe-C potential, assuming units of length in A and units of energy in eV, where AFe = 1.828905 eV and Ac = 2.958787 eV... 39
Table 3.2: Formation energies corresponding to the deepest energy minima of different C-Va defect clusters calculated from DFT as described in [25] and obtained from the potential, relative to free vacancies and octahedral C interstitials. A negative energy reported indicates binding. Subscripts on point defect cluster types indicate the sublattice on which the defect species is located. To our knowledge, the only experimental
measurements available for comparison are for Ctet (0.81 eV [54]) and for IVa-lC (0.44 eV [55] or 0.85 eV [56]) ... .40 Table 3.3: Comparison of calculated energetic barriers for stepwise migration of I Va- 1 C point defect cluster. Literature results are found in [61]. See text for discussion. Fe atoms are denoted by black circles, Fe vacancies by squares, and C solute by gray circles. The 1
4 jump with a maximum barrier height of 1.23 eV in comparison to the deepest energy minimum can be used as an underestimate of the dissociation energy of the cluster, which is experimentally estimated as 1.6-1.7 eV [54]... ... 46 Table 3.4. Diffusion parameters utilized in calculation of DFe. The subscripts referring to the 2 different divacancy moves are described in the text ... . 47 Table 4.1: Interaction energy of dislocation core with N vacancies already bound to the core with a single free vacancy in bulk. As there are 10 lattice layers along the dislocation line direction of [11
T]
in our supercell, there are 10 values in the table... 57 Table 4.2: The migration energy of vacancies parallel to the dislocation line direction of[T1 1] at various positions around the core as defined in Figure 4-1(c). These values also show the convergence seen for the migration towards the core towards the bulk migration
energy of 0.84 eV (see Figure 3-3(a)) within four Burgers vector distances from the core.
... ... ... ... 5 9
Table 5.1: Gibbs free energy of defect formation reactions at the reference pressure of 02 at 1 bar calculated with and without the +U formalism. A is the 0 K formation energy and B is the formation entropy obtained by fitting the calculated Gibbs free energy to the form AG = A + BT. Formation energies calculated with +U for the octahedral dumbbell and with regular DFT for the OOTV configuration are not given, as both configurations relaxed into the Type B tetrahedral during energy minimization. The structure is defined in Figure 5-1. A schematic of the OOTV configuration could be seen in Figure 5-4... 71 Table 5.2: Activation energies for defect migration and transitions calculated with and without the +U formalism. Numbers are provided for pathways that are found in the standard catalogue [86]; the interstitialcy pathways are depicted in Figure 5-5. No
comparison is provided with pathways 7 and 8 as they do not contribute to diffusion. The OOTV - Tet. B migration pathway can be compared to pathway 2. This is because the OOTV configuration (Figure 5-4) can be thought of as the midpoint of pathway 2... 73
Table 7. 1: Summary of details and approach taken towards the four investigations in this thesis. ... 95
1
Introduction
1.1 Slow Dynamics
In a 2002 review paper on creep at very low rates [2], F.R.N. Nabarro summarizes the challenge to, as well as the possible contribution of, the atomistic computational modeler in the understanding of long-timescale evolution of microstructure in materials with industrial relevance,
A land-based turbine may have a life of 40 years. If a total creep strain of 1 pct is permissible, the creep rate is about 10-11 s'. Extrapolation to this rate from rates measureable in the laboratory is perilous, and we need to understand the physical processes involved .... The present state of knowledge reveals specific questions that call for experimental investigation. Theory will contribute, but atomistic computation, with a time scale of 10-11 s, will not handle processes that take 101 s.
Computation on the dislocation scale may perhaps become helpful in a few years time.
In terms of the traditional atomistic method of molecular dynamics [3], it is easy to understand the pessimism of Nabarro. Even with all sorts of creativity in getting the best out of the method, like those implemented in state-of-the-art multimillion-atom simulations (see [4] for an example), molecular dynamics (MD) itself is still fundamentally constrained by the need of accurate numerical integration of the equations of motion in computational timesteps of 1 fs to 10 fs. Even if humanity ever develops the necessary computer machinery for the task, it will never be practical, from the point of
view of analyzing data and obtaining understanding, to meet Nabarro's challenge of simulating 1011 s phenomena by breaking the simulated time into 1026 discrete units.
Thus these problems of slow dynamics in complex materials, which could not be directly simulated using MD, require an alternate approach. The key to doing this is to first understand why these problems are long timescale in nature. Transition-state theory
[5] informs us that the rate of an atomistic transition has an exp(-AE/kT) dependence on the activation barrier AE. As such, in the presence of a significant energy barrier to kinetic transitions (on the order of 1 eV), real material systems (and MD model systems) spend the bulk of the time trapped in deep energy minima, with transitions between energy minima over energy saddle points being rare events. Microstructural evolution is simply the aggregate result of many such rare transitions and MD cannot be used to sample enough of these transitions to simulate the general phenomenon. However, rather than directly tracking the exact trajectory of the atomic system, as is done in MD, the long-timescale microstructure evolution can be modeled by abstraction into unit processes of transitions between minimum energy states, each with an associated deformation unit and time unit. Such a concept is not new and has been used with success in analytical treatment of simple vacancy and interstitial diffusion problems [6]. The challenge lies in directing the computation effort to investigate the transitions and in incorporating the atomistic details within the basic framework to extend its use into more complicated materials problems. In this thesis, we will use this type of approach to investigate topics relevant to the slow dynamics phenomena of creep* and of oxidationt.
* Creep is the inelastic deformation of materials that occurs, due to microstructural processes,
over time as the material is subjected to continuous applied mechanical loading.
t The equilibrium state of the typical metal (in its pure, elemental form) in contact with oxygen is some form of oxide. The process of metal oxidation is the growth of the oxide film on the surface of the metal.
The first of such problems that we investigate is the point defect population and interactions in high carbon ferritic steels*. These metastable materials are supersaturated with both extrinsic (carbon, - 4 at. %) and intrinsic (vacancy, - 0.5 at. %) defects in the body-centered cubic (BCC) Fe matrix. The tendencies of point defects to form complex point defect clusters in this material [8] can have important consequences on the diffusive behavior and in turn have an effect on the material deformation, as the alloy is known to creep by vacancy-driven dislocation climb [9]. In this creep mechanism [10], sustained deformation requires a steady transport of vacancies to the dislocation cores in order to permit dislocations trapped at obstacles on their glide planes to climb onto another plane for continual movement. We can therefore build up an understanding of the creep deformation rate of the material by studying the formation of the point defect clusters and their effect on diffusion rates.
We also consider how vacancies behave in the stress fields of the dislocation, how they bind with the dislocation itself, and how they contribute to the dynamic structure of the dislocation. Even though some account of these vacancy properties is necessary in any treatment of the dislocation climb rate, the study of these atomistic details is neglected, due in no small part to the great complexity in making use of the results in analytical equations, the traditional choice of theoretical approach to dislocation climb [11, 12]. However, with the availability of numerical methods now capable of handling these details, such as atomistic techniques based on transition-state theory like kinetic Monte Carlo (kMC) or continuum transport equation-solving methods like the finite-element method (FEM), investigating the properties of the vacancy in relation to a * Iron in its low-temperature, ferromagnetic, body-centered cubic (BCC) form is known
interchangeably as ferrite or a-Fe. This is the stable form of pure Fe below 1184 K and has a solubility limit with relation to the carbon content of about 0.1 at. %. Details of the Fe-C binary system can be found in [7]. It must be noted that the word "ferrite" can also refer to the general class of spinel oxides of the form AB204. To avoid confusion, within this thesis the noun "ferrite" and the adjective "ferritic" will only be used to refer to BCC Fe.
dislocation can greatly benefit the modeling of the dislocation climb and understanding of this important creep mechanism.
For the third component study of the thesis, we examine the cation diffusion in magnetite Fe304, which is closely related to the oxide layer on Fe [13]. The transport of cations through the oxide layer on a metal is necessary to continue the reaction of the metal atoms with oxygen molecules from the environment to form oxide [14]. Our study into the diffusion properties in the oxide can therefore help build the understanding of the rate of metal oxidation.
Finally, we investigate the atomic motion at and near the highly irregular grain boundaries of nanocrystalline materials and correlate them to the rate of deformation which we directly calculate. Understanding the relationship of such processes to the rate of creep deformation is of great importance. The grain boundaries are the dominant component of the microstructure in the length scale of these materials. The creep mechanisms responsible for the deformation of materials with larger grains that involve dislocations are thus suppressed [15]. Existing atomistic work in this area conducted with MD have all utilized either extreme stress [16] or extreme temperatures [17] in order to overcome the limitation of the method in dealing with slow deformation. While these studies yield reasonable trends and some useful conclusions, they all provide unrealistic strain rates and fail to produce convincing unit mechanisms responsible for the deformation. We aim to provide this missing understanding of the creep phenomenon by using a new approach to simultaneously obtain realistic strain rates and atomic unit processes.
1.2 Scope of Thesis
In this thesis, we explore four problems relevant to the long-timescale phenomena of creep and metal oxidation. In Chapter 3, we examine the point defect interactions and their contribution to diffusivity in BCC iron supersaturated with carbon and vacancies. We begin with the construction of an empirical energy model relevant to the system. We use the formation energetics of the various defect types to obtain the defect population and we investigate the activation energies of the defect migration mechanisms. We combine these results to analytically obtain the diffusive behavior in the material, with which we obtain possible explanations for the experimentally-observed rate of creep in the material that arises from dislocation climb [9].
In Chapter 4, we discuss another aspect of dislocation climb, namely, the behavior of vacancy diffusion near the core. We show how vacancy-dislocation interaction energetics at the core deviate from elasticity predictions [18] and how the vacancy diffusion barriers vary with distance from the core. We also demonstrate that the vacancy interaction with the dislocation core can be compared to a particle adsorption problem. We illustrate how these vacancy properties, when formulated as deviations from the bulk crystal behavior, can be tractably transferred into numerical simulations of climb. We close with a description of a kMC scheme to numerically calculate the dislocation climb rate and material creep rate using our calculated atomistic details.
In Chapter 5, we present a study, associated with the problem of oxidation, of the cation diffusion in nonstoichiometric magnetite Fe3-_04, a related structure of the spinel oxide film on Fe metal surface [13]. We calculate the defect energetics as well as the activation energies of the defect transport mechanisms. We use our results to interpret experimental measurements of the integral properties of nonstoichiometry and
diffusivities [19, 20] in a mechanism-specific way, and create a combined experimental and computational understanding of the defect population and transport rate in the spinel. In Chapter 6, we present an investigation on creep in nanocrystalline Fe. We employ a novel method of activated kinetics, successful in explaining shear relaxation over a wide range of temperatures in supercooled liquids, to directly calculate a strain rate of solid-state deformation under stress. We identify the relevant grain-boundary unit processes and explain their contribution to the overall material deformation.
As discussed in Section 1.1, we attack the general issue of slow dynamics with the general scheme of breaking down the investigated phenomena of microstructural evolution into its component transitions and obtaining the rate from the properties of these unit processes. However, the four problems investigated differ in the chemistry, in the levels of system symmetry, and in the state of experimental knowledge, and so require different approaches to calculate and understand rate. They are therefore
complementary in that they highlight the wide range of challenges in the calculation of rate. In Chapter 7, we discuss these issues, along with possible future developments in the area.
2
Coarse-Graining the Energy Landscape
2.1 The Energy Landscape Concept
Using the Born-Oppenheimer approximation, the energy of an atomic system could be approximated as a function strictly of the atomic coordinates R of the N atoms in the system. This energy function (R) is a complicated hypersurface, or landscape, of 3N dimensions, as there are 3 degrees of freedom for the position of each atom. As an atomic system evolves and runs through different possible atomic configurations, it traces a line through the energy landscape.
E
"
minima
barrier
D--)
vacancy movement
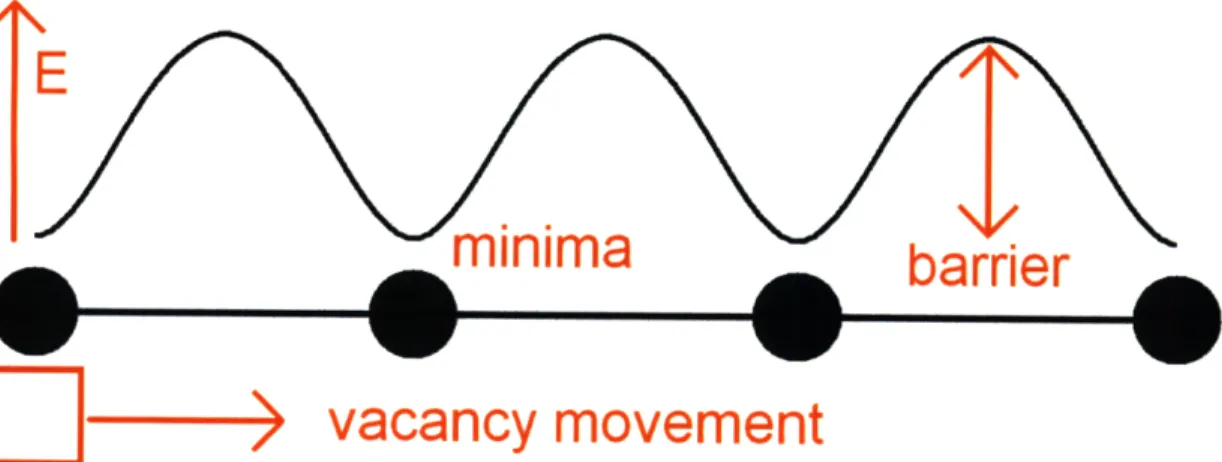
Figure 2-1: A schematic of the energy landscape for a vacancy diffusion problem in a one dimensional atomic lattice.
There are 2 particularly important topological features on the energy landscape. Figure 2-1 illustrates the principle for the simple case of a vacancy moving in a 1 dimensional lattice. The energy minima correspond to stable or metastable states, which are typically given qualitative labels (in Figure 2-1, a vacancy at "rest" at some arbitrary lattice position). The saddle points correspond to the transitions between minima [5] (in Figure 2-1, the jump of a vacancy from an arbitrary lattice position to a nearest neighbor
position). The height of the saddle point AE corresponds to the kinetic barrier and governs the rate of the corresponding transition
F = v expr_ 1,
A theoretical derivation of this so-called Arrhenius dependence as well as the meaning of the prefactor v. could be found in [5]. By nature of the exponential dependence, transitions are fundamentally rare events if the barrier heights are significant (i.e. on the order of 1 eV), as is in the cases of creep and oxidation. As a result, materials systems spend the bulk of the time trapped in deep energy minima and microstructural evolution is therefore long timescale in nature.
In the thesis, we coarse-grain the energy landscape out to only the energy minima and saddle points, in accordance with the principles of transition-state theory [21]. We associate each minimum with an average time the system spends within it between transitions, and by comparing the extent of deformation between each minimum we can obtain a rate of deformation. While we give up tracking explicitly the evolution of atomic positions as is done in traditional molecular dynamics, we can direct the computation effort specifically at searching for transitions and calculating rate and avoid spending the resources calculating the trajectory of the atoms as the system hovers around deep energy minima.
2.2 Ab Initio and Empirical Energy Models
The choice of the energy landscape in an atomistic simulation is of crucial importance. Care must be taken to weigh accuracy (in terms of simulating well the properties of the material) versus computational expense. In this thesis, we use two types of energy model: density functional theory (DFT), a type of ab initio energy model, and Finnis-Sinclair (FS), a type of empirical multibody potential.
Density functional theory (DFT) belongs to the class of electronic structure methods, where energies are obtained from solving Schrodinger's equation for atomic systems. While DFT is a relatively recent development, it is by now a well-established formulation. Details about the method can be found in texts [22]. It is a very versatile and powerful tool that can deliver reliable results, and as an ab initio model it requires no input save the atomic configuration. Its main disadvantage is that it is extremely expensive to use computationally', and, with the current equipment of research-group scale, calculations could not be done on systems of more than 500 atoms. In terms of this thesis, this limitation means that the method is suitable only for the investigations involving lattice point defects detailed in Chapter 3 and Chapter 5, and even then restricted to energy minimization or selected nudged elastic band (NEB) problems. Whenever mentioned in this thesis, it is always used as implemented in the VASP package [24]. Further details about the calculation methodology can be found in [25].
The Finnis-Sinclair (FS) model [26] is a variant of the embedded-atom model [27] type of empirical potential. Potentials of this type have been particularly successful in
* DFT is a method whose demand on computational resources (e.g. memory, computational time)
scales to N3
, where N is the number of electrons in the system. Each of the N electron
wavefuntions must be kept orthogonal to obey the Fermion statistics. Because of the delocalized nature of electron wavefuntions, these N2 integration must be conducted over the entire
simulation cell, which scales with N [23]. This nonlinear scaling makes calculations involving many electrons impractical to perform.
modeling transition-metals and alloys. In the FS model*, the energy of each atom in the system is written as
where j refers to the nearest neighbors within a cutoff distance, a is the element type of atom i, p is the element type of atomj, Aa is a positive coefficient specific to element a, r, refers to the interatomic distance between atoms i andj, pp (r) refers to the density contributiont ofj to atom i, and b,8, (r,,) refers to the pair interaction between atoms i and
j. An attempt at justifying the form of the potential can be found in [29]. This type of
energy model is significantly cheaper computationally than DFT* to use in atomistic simulations and could be used for exploring large systems or for sampling large numbers of transitions. In this thesis, the construction of a potential of this form for the Fe-C alloy system is discussed in Chapter 3, and the use of the potential can be seen in the investigations detailed in Chapters 3, 4, and 6.
* The original Finnis-Sinclair model [26] does not provide for a multi-element formulation. The
extension of the basic form for use in duplicating alloy energetics is a later development; a discussion can be found in [28].
t The sum of the density contributions is essentially a measure of coordination.
$ Empirical potentials generally treat atomic interactions in a highly localized manner. For instance, in the Fe-C potential discussed in Chapter 3, the Fe-Fe interaction is limited to the interactions between 1s and 2rd nearest neighbors. As a result, the computational intensity scales
2.3 Energy Landscape Exploration
Our approach to calculating rate lies in coarse-graining the energy landscape into the most essential features of the energy minima and energy saddle points. How we search for these topological features is thus extremely important. We will here briefly describe the techniques for doing so.
2.3.1 Energy Minima
As mentioned in Section 2.1, the energy minima of a system are typically of great importance to the atomistic modeler. However, due to the complexity and the large dimensionality of the energy landscapes, one typically cannot locate minima by analytically solving for zeroes in the derivatives of the energies (with respect to atomic positions). Well-established mathematical techniques have been developed, however, to overcome this difficulty by tracing a downward path along the energy landscape surface to a local minimum from an initial starting guess. A class of methods involves finding the path using the local gradient*. Such methods include quenched molecular dynamics and conjugate gradients [30]. More refined methods include using the local Hessian of second derivativest, such as the rational function optimization [31] method, or an estimate of the local Hessian, such as the Broyden, Fletcher, Goldfarb, and Shanno (BFGS) method [32], to assist in the search.
* The gradient of a function marks the direction in which the function changes most rapidly. The
methods described all use the general principle, with adjustments for computational efficiency, of following the direction of the negative gradient to reach local minima.
t The Hessian of a function describes its local curvature. As the Hessian contains more local information of the function than the gradient, it is used in cases where more refined minima searches are needed. It should be noted that the gradient of a N dimensional function has N components, while the Hessian matrix has N2 components. The computational demand (e.g.
In this thesis, all of the above mentioned methods have been used for energy minima search when and where appropriate. As these techniques do not yield different results, we will typically not specify the algorithm used. A general discussion of this subject area can be found in [33].
2.3.2 Energy Saddle Points
There exists a variety of search methods for energy saddle points; in this section we will describe the two techniques that are used in this thesis.
The nudged elastic band (NEB) method is a relatively recent development that has become quite well established within the atomistic simulations community. The details of the method can be found elsewhere [34] and we will here summarize only the most
essential ideas.
The general class of "chain-of-states" methods has at its core the concept of representing a transition by certain discrete, but sequential, images of the atomic positions interconnected via fictional springs along its path on the energy landscape. NEB is a numerical variant that quite efficiently converges upon the minimum energy path, which then yields the energy saddle point through the energy value that represent the local maximum along the path.
In the NEB method, one starts with an initial guess of images along a path between two minima, typically by linearly interpolating at regular intervals between the minima. During each calculation cycle, each image i is permitted to evolve with the force
The first term in the sum is the component of the Newtonian force '
(',)
on the image that is perpendicular to the path, obtained from the energy landscape (A-i). The Newtonian force drives the image towards energy minimization, and using strictly the component of that force that is perpendicular to the path allows the energy to minimize towards the path and not slide down to the minimum. The second term in the sum is the force of the springs connecting an image with its preceding and following imagesprojected along the unit tangent to the path ll. The spring force guarantees that each of the images during the calculation cycle remains connected with one other, in order, by shortening the distance between images. Utilizing only the component of this force in the direction of the path removes the shortening tendency of the spring force to pull images off curvilinear minimum energy paths. This process is iterated until convergence is reached.
There are many improvements to the method, such as manipulating the image with the highest energy to converge onto the saddle point [35] or better estimates of the unit tangent to the path z i [36], but all stay within the basic framework.
The method is the primary tool in the investigations detailed in Chapters 3, 4, and 5, as the atomistic transitions in these problems have relatively identifiable initial and final states.
The other method of saddle point search that we utilize is the autonomous basin climbing (ABC) method [37]. The method operates by a series of elementary steps of alternating activation and relaxation, which allows a system to climb up an arbitrary energy potential well. On the energy landscape where there are many local minima and
saddle points, having the ability to climb out of any potential well means that one can then sample the topography by generating an explicit trajectory for the transition-state pathway. The system evolution, on an energy scale, is therefore described by this trajectory. As the method is very recent, we will here detail its basic operation as well as provide an example of its use.
Figure 2-2(a) shows the two elementary steps of activation and relaxation that move the system up a particular potential well. The procedure begins with an energy minimized configuration, where an activation step is created by adding a 3N dimensional Gaussian penalty function (N is the number of atoms in the system) to the initial coordinates Ro
(
0) = W exp
20
where W (with units of energy) and a (with units of distance) determine the strength and spatial extent of the penalty respectively. These parameters must be determined for the specific situation for which the method is used. The penalty is added to the local energy to obtain a total system energy O'
The added penalty has the effect that, upon minimization of the combined energy (sum of the penalty and the original potential energy of the system) with relation to the atomic coordinates, the system is pushed away from the initial minimized configuration into a higher energy state. A new penalty is then added and the cycle of minimization and penalty addition is begun anew. With sufficient energy penalties accumulated after a series of such steps, the system will cross an energy saddle point during a relaxation step and enter into an adjacent well. Starting at the bottom of this well the activation-relaxation series is repeated until the system is able to escape from the second well.
Notice that the energy penalty functions imposed in the previous activation steps are not removed during the entire sampling, so that the system is always discouraged from returning to previously visited potential minima. Thus with this method one is not sampling a fixed energy landscape, rather one that evolves along with the sampling such that the system is always encouraged to sample new regions. This method, in contrast to saddle point sampling techniques such as NEB, does not require a priori knowledge of the final state. This is particularly useful for the system where the structure is too complex to generate such an input.
a
b
-2o2 TStep 1: Activation
+ OP E
+~
-20.4-Original Energy Landscape Pena y
Step 2: Relaxation ,~ -20.6
4)
OdnaI Energy WP W
Cumuladive Penaties
Repeat Steps 1 and 2 to Explore Energy Landscape
0 500 1000 1500 2000 2500 3000
7-21
''Local
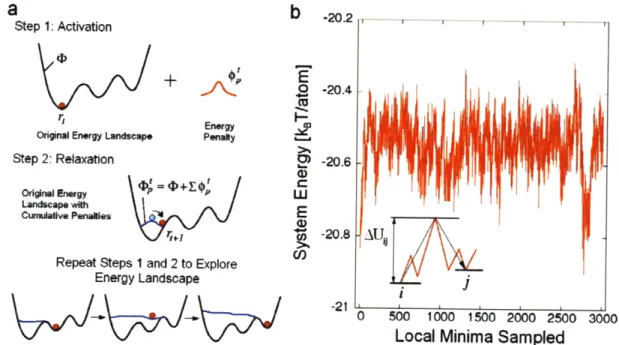
Minima SampledFigure 2-2: The autonomous basin climbing (ABC) technique. (a) A schematic representation of the method - an energy minimized initial structure is activated by
imposing on the energy landscape D a Gaussian energy penalty b' (centered at the original configuration), which causes the system to climb up the basin into a higher energy configuration. Repeated application of the energy penalties will eventually cause the system to move to another energy minimum. (b) An illustration of the results obtained from ABC, where a series of interconnected energy minima and saddle point transitions between them is obtained. Activation barrier between two minima i and j,
This method has been used to obtain transition-state pathway trajectories in supercooled liquids. An example is shown in Figure 2-2(b). The trajectory is an alternating sequence of energy minima and saddle points that allow the system to evolve along a particular energy pathway. From such data we can extract an effective temperature-dependent activation barrier, shown in the inset in Figure 2-3, which in turn determines the temperature variation of the shear viscosity through the application of transition-state theory [37]. Figure 2-3 shows that the atomistic results for amorphous SiO2 [38] and a model of binary Lennard-Jones interaction [39] have the same behavior as existing experimental viscosity data [40]. We regard this agreement as a sign of promise that the method is capable of probing the rate of microstructural evolution of
materials over a wide temperature and temporal range.
The method is the primary tool in the investigation of creep in nanocrystalline Fe detailed in Chapter 6. The main reason for its use lies in the microstructure of interest, which consists of a large volume fraction of grain boundaries where the most important atomistic transitions are expected to take place. Due to the complicated disordered structure, plausible transitions from any initial configuration are too numerous to investigate individually by NEB, even if the problem of identifying the end states of these transitions is surmounted. In addition, the characteristics of the atomic transitions that occur are expected to differ as the microstructure of the grain boundary evolves due to the external driving force (i.e. stress). That ABC does not require guesses of the final states and that it can provide a trajectory of the system deformation renders it an ideal choice for investigating this problem.
1020 1015
-
, S 251 (1) 10
1010
JI
I
0__. o 2 4 6 8 10 12 140 10
54
>
.
100 A10-5
0.0
0.2
0.4
0.6
0.8
1.0
1.2
Tg/T
Figure 2-3: The viscosity of supercooled liquids as calculated using the ABC method (solid and dashed curves) [37] in comparison with experimental measurements (symbols [40]). I and II denote amorphous SiO2 [38] and binary Lennard-Jones model [39], respectively. The inset shows the extracted activation barriers as a function of temperature. Tg is the glass transition temperature where the viscosity is 1013 poise.
3
Vacancy and Solute Interaction in Fe
Supersaturated with Carbon Solute
3.1 Experimental Background
Steels with a high carbon concentration beyond the eutectoid point at 0.77 wt.% have since historical times been utilized, such as in the case of "Damascus steel" scimitars, for their impressive mechanical properties, particularly, toughness [41]. These steels are used in a state far out of equilibrium, with a supersaturation of carbon atoms in the ferritic BCC matrix and with the Fe3C cementite fraction kept low compared to the equilibrium state. It is this complex microstructure which results from its thermodynamic metastability that confers superior mechanical properties. Yet these materials are subject to creep failure at high applied stresses (c (normalized by Young's elastic modulus E as o/E = 103 - 102). Figure 3-1(a) illustrates this experimental trend, wherein different research groups [42, 43, 9] measured appreciable effective strain rates of ferritic steels, normalized by the effective temperature-dependent self-diffusivity D1l in each experiment, and indicate power-law stress dependences of power n of 5 - 8. This power-law dependence is consistent with vacancy-driven dislocation climb creep [9].
b 1020 I I I I I I 0 3.6 at% C - 5.6 aMt c 1019 S1018-1018 SA 5 1017 -1014 - 1016-1012 A 1015 I I I 10- 10-3 2.0 4.0 6.0 o/E at% C
Figure 3-1: Experimental creep strain rates in high-carbon steel. (a) Normalized strain rates de/dt increase strongly with increasing normalized stress o, where Deft is Fe self-diffusivity and E is elastic modulus. Experiments were conducted at T/T, - 0.45, where the creep strain rates were readily measurable. The power-law stress dependence n of 5-8 is a signature of creep by the vacancy-driven dislocation climb mechanism [9]. (b) At a given stress magnitude, creep strain rates decrease with increasing carbon content. Data from [42, 43, 9].
It is difficult to understand these creep trends from experiments alone. As seen in Figure 3-1(b), the aforementioned studies indicate a decreased creep strain rate with increasing total carbon content, contrary to observed trends in the face-centered cubic (FCC) phase* (as a function of carbon [44] or palladium [45] solute content) as well as the theoretical understanding that dilute solute atoms generally increase self-diffusivity [46]. As current experimental techniques cannot provide full details of the microstructure (e.g. how carbon solute atoms are distributed throughout the bulk), it is not simple to attribute this discrepancy, based purely on experiment results, to sources such as a differential distribution of the carbon from grain interiors to boundaries or a differential concentration of carbon-vacancy clusters that reduces iron self-diffusivity.
* The FCC phase is the equilibrium phase of iron from 1184 K to 1665 K, and is known
In this study, we aim to use atomistic simulations to develop an understanding of these trends. We first investigate the migration mechanisms and activation barriers of defect clusters consisting of Fe vacancies and C solute atoms within a model system of BCC Fe bulk, and construct an analytical framework to calculate the diffusion rate incorporating these atomistic details. As the rate of creep by the vacancy-driven dislocation climb mechanism is proportional to the rate of diffusion [10], our calculated trends could be used to understand the experimental creep rate.
3.2 Developing an Appropriate Energy Landscape
As discussed in Section 2.2, an energy model suitable for simulating the microstructure is necessary. We therefore begin our investigation with identifying the essential features we require out of any energy model we use.
3.2.1 Potential Criteria and Benchmarking of Existing Potentials
DFT has been used with success to examine the basic energetics of defect formation in the BCC Fe with a variety of solute atoms (Cu [47], C [8], and N [8]). However, as
discussed in Section 2.2, the energy model, although accurate, is very computationally expensive to use. Given the large number of lattice defect clusters and associated migration pathways that have to be sampled in this study, it could not be used for anything more than a reference energy landscape. Empirical potentials are more appropriate for the task and are open for future extensions into calculations involving large systems (e.g. dislocation studies). However, we could not expect that these potentials would be able to duplicate the entire DFT energy landscape of C solute atoms in the BCC Fe matrix. As such, it is necessary to establish a list of the most basic criteria
appropriate for the specific problem of studying defect pathways in BCC Fe supersaturated with C:
1. Represent well the basic properties (e.g. elastic properties) of BCC Fe.
2. Accurately account for the key minima of C interstitial atoms (e.g. octahedral interstitials) in BCC Fe.
3. Energetically distinguish multiple, slightly different defect configurations of key defect clusters relevant to BCC Fe supersaturated with up to 10 wt.% C.
The fulfillment of requirements 1 and 2 would allow the potential to compare with what little experimentally available data there is of the BCC Fe lattice and of the basic thermodynamics of embedding carbon solute in Fe. Requirement 3 is important as it is known from DFT calculations that complicated defect clusters consisting of multiple carbon atoms and iron vacancies are expected within the matrix [25]. These defects can take multiple configurations, some of which can be seen in [8]. Being able to replicate the energy of formation of the key energy minima (i.e. the deepest minima) and at least correctly rank, even if not hitting the exact energy targets, the less important energy minima would guarantee that the potential could reproduce the thermodynamics of the defect species and provide the ability to model the defect transport pathways.
Finally, while it is not entirely necessary for the potential to be capable of doing so, there are advantages if it can favor the formation of Fe3C as an equilibrium phase, which is achieved by a correct representation of the energy of formation of the structure (and to a lesser degree, the exact structure) [48]. This is to ensure that the potential can at least duplicate the Fe-C phase diagram for low temperatures [7] and would accurately reflect a carbon-supersaturated BCC lattice as metastable versus carbide formation.
Three existing potentials for the Fe-C system could be found in the literature. The Johnson potential [49] was composed of pair-potential descriptions for Fe-Fe and Fe-C interactions. However, pair-potentials have well known issues with representing the properties of transition-metals [27]. The Ruda potential [50] has a fatal defect in favoring the tetrahedral over the octahedral configuration for carbon interstitials, contrary to expectations that the solute would prefer the larger interstitial position as confirmed by results from DFT [8, 25]. The most promising potential of the three, according to the comparisons with DFT [8], was the Rosato potential [51], which was created by combining the Johnson Fe-C pair-potential with a superior Finnis-Sinclair (FS) type multibody description of the Fe-Fe interaction [26]. We have however observed that the Rosato potential is unable to duplicate the exact configurations of the IC-1Va cluster, as detailed in [52]. An energetic description of the C-C interactions is also missing.
3.2.2 Fitting Strategy
Finding a lack of an appropriate potential from the literature, we elect to embark on constructing our own. Realizing the importance of ranking the different minima correctly in comparison to DFT data, we fitted our potential to the energies generated by DFT for specific configurations rather than fitting strictly to energetic data (and ignoring the atomic configuration) as is generally done. To maximize the fitting database and achieve a greater degree of qualitative energy landscape feature correspondence between DFT and the potential, the geometries and respective energies of the relaxed defect clusters, unrelaxed defect clusters and select defect cluster configurations along the CG ionic minimization route were used. We then used the GULP code [1] to fit the potential with the BFGS algorithm to minimize the weighted sum of squares of deviations in calculated
and targeted energies over the parameter space. We elect to employ the relatively simple FS format, where the energy contribution of each atom to the system is
j/i .2
(For the meaning of the different variables in the equation, refer to Section 2.2.) For the density function and pair-potential parameters of the Fe-Fe term, we adopt the values developed by Finnis and Sinclair, having noticed their ability to match the pure BCC Fe characteristics [53]. For the Fe-C and C-C interactions we use the same form
Pfla (r,) t, (r 2 +t2 3, ,
0&, ()= (r - r , )2 (k, k2r k3r 2
), r <
where these functions are zero for r > r,. The parameters are provided in Table 3.1.
a 3 rc, t t2 rc, kl k2 k3 Fe Fe 3.569745 1 0.504238 3.4 1.237115 -0.359218 -0.038560 Fe C 2.545937 10.024001 1.638980 2.468801 8.972488 -4.086410 1.483233 C Fe 2.545937 10.482408 3.782595 C C 2.892070 0 -7.329211 22.061824 -17.468518 4.812639 2.875598 Table 3.1: Fitted parameters of the Fe-C potential, assuming units of length in A and units of energy in eV, where AFe = 1.828905 eV and Ac = 2.958787 eV.
3.2.3 Results
Details about the work and the results have been published [52]; we will provide here only a summary of some of the formation energies in Table 3.2 and a commentary on the results.
In general, we find good agreement with DFT for configurations of the highly energetically favorable 1Va-IC and 1Va-2C that were explicitly fitted and reasonable agreement for other defect clusters. The potential also accurately gives the energies of the
![Figure 2-3: The viscosity of supercooled liquids as calculated using the ABC method (solid and dashed curves) [37] in comparison with experimental measurements (symbols [40])](https://thumb-eu.123doks.com/thumbv2/123doknet/14121248.467695/33.918.161.778.117.726/figure-viscosity-supercooled-liquids-calculated-comparison-experimental-measurements.webp)

![Table 3.2: Formation energies corresponding to the deepest energy minima of different C-Va defect clusters calculated from DFT as described in [25] and obtained from the potential, relative to free vacancies and octahedral C](https://thumb-eu.123doks.com/thumbv2/123doknet/14121248.467695/40.918.324.624.499.856/formation-corresponding-different-calculated-described-potential-vacancies-octahedral.webp)
![Figure 3-2: Concentrations of various defect species. Calculations were performed at fixed [Va 0 o,] of 0.005 (an arbitrary value) at varying [C,o,] for 450 K, as discussed in Section 3.3](https://thumb-eu.123doks.com/thumbv2/123doknet/14121248.467695/43.918.168.772.348.904/figure-concentrations-various-calculations-performed-arbitrary-discussed-section.webp)


![Risiko- & [und] Schutzfaktoren der psychischen Gesundheit humanitärer Einsatzhelfer : eine systematische Literaturübersicht](data:image/gif;base64,R0lGODlhAQABAIAAAP///wAAACH5BAEAAAAALAAAAAABAAEAAAICRAEAOw==)