Publisher’s version / Version de l'éditeur:
Journal of Materials, 20, January 1, pp. 20-28, 2008-01-01
READ THESE TERMS AND CONDITIONS CAREFULLY BEFORE USING THIS WEBSITE.
https://nrc-publications.canada.ca/eng/copyright
Vous avez des questions? Nous pouvons vous aider. Pour communiquer directement avec un auteur, consultez la
première page de la revue dans laquelle son article a été publié afin de trouver ses coordonnées. Si vous n’arrivez pas à les repérer, communiquez avec nous à PublicationsArchive-ArchivesPublications@nrc-cnrc.gc.ca.
Questions? Contact the NRC Publications Archive team at
PublicationsArchive-ArchivesPublications@nrc-cnrc.gc.ca. If you wish to email the authors directly, please see the first page of the publication for their contact information.
NRC Publications Archive
Archives des publications du CNRC
This publication could be one of several versions: author’s original, accepted manuscript or the publisher’s version. / La version de cette publication peut être l’une des suivantes : la version prépublication de l’auteur, la version acceptée du manuscrit ou la version de l’éditeur.
Access and use of this website and the material on it are subject to the Terms and Conditions set forth at
Corrosion inhibiting systems for durable concrete bridges - Part 1:
Field performance evaluation
Cusson, D.; Qian, S. Y.; Chagnon, N.
https://publications-cnrc.canada.ca/fra/droits
L’accès à ce site Web et l’utilisation de son contenu sont assujettis aux conditions présentées dans le site LISEZ CES CONDITIONS ATTENTIVEMENT AVANT D’UTILISER CE SITE WEB.
NRC Publications Record / Notice d'Archives des publications de CNRC:
https://nrc-publications.canada.ca/eng/view/object/?id=b312d134-7784-49e3-b580-8fb9177aaedd https://publications-cnrc.canada.ca/fra/voir/objet/?id=b312d134-7784-49e3-b580-8fb9177aaedd
http://irc.nrc-cnrc.gc.ca
C o r r o s i o n i n h i b i t i n g s y s t e m s f o r d u r a b l e
c o n c r e t e b r i d g e s – P a r t 1 : F i e l d p e r f o r m a n c e
e v a l u a t i o n
N R C C - 4 8 1 3 5
C u s s o n , D . ; Q i a n , S . Y . ; C h a g n o n , N .
A version of this document is published in / Une version de ce document se trouve dans: Journal of Materials, v. 20, no. 1, Jan. 2008, pp. 20-28
The material in this document is covered by the provisions of the Copyright Act, by Canadian laws, policies, regulations and international agreements. Such provisions serve to identify the information source and, in specific instances, to prohibit reproduction of materials without written permission. For more information visit http://laws.justice.gc.ca/en/showtdm/cs/C-42
Les renseignements dans ce document sont protégés par la Loi sur le droit d'auteur, par les lois, les politiques et les règlements du Canada et des accords internationaux. Ces dispositions permettent d'identifier la source de l'information et, dans certains cas, d'interdire la copie de documents sans permission écrite. Pour obtenir de plus amples renseignements : http://lois.justice.gc.ca/fr/showtdm/cs/C-42
Corrosion Inhibiting Systems for Durable Concrete Bridges –
Part 1: Five-year Field Performance Evaluation
Daniel Cusson
1, Shiyuan Qian
2, Nathalie Chagnon
3, and Bruce Baldock
4Abstract: The performance of nine commercially available corrosion-inhibiting systems for use in
reinforced concrete structures exposed to corrosive environments was assessed in the field on bridge
barrier walls and in accelerated electrochemical cells in the laboratory. The corrosion-inhibiting systems
included concrete admixtures, reinforcing steel coatings, and/or concrete surface coatings/sealers. The
results of this study are presented in two companion papers, in which the field evaluation and laboratory
investigation are reported. The field evaluation consisted of annual corrosion surveys of half-cell potential
and corrosion rate, as well as remote monitoring with embedded instrumentation for the measurement of
the environmental conditions. After five years of investigation, the system containing an inorganic-based
admixture performed better than others in reducing the risk of reinforcement corrosion in the barrier wall.
It was also found that the system using epoxy-coated reinforcement showed good early performance
during the first year, but after, the risk of corrosion increased relatively faster than in other systems,
possibly due to localized pitting corrosion developing in small defects or pores of the epoxy coating.
CE Database subject headings: Concrete bridges, field investigations, reinforcement, corrosion
1
Research Officer, National Research Council Canada, 1200 Montreal Rd., Ottawa, Ontario, Canada, K1A 0R6, Tel.: (613) 998-7361, Fax.: (613) 952-8102, Email: Daniel.Cusson@nrc-cnrc.gc.ca.
2
Senior Research Officer, National Research Council Canada, 1200 Montreal Rd., Ottawa, Ontario, Canada, K1A 0R6, Email: Shiyuan.Qian@nrc-cnrc.gc.ca.
3
Technical Officer, National Research Council Canada, 1200 Montreal Rd., Ottawa, Ontario, Canada, K1A 0R6, Email: Nathalie.Chagnon@nrc-cnrc.gc.ca.
4
Technical Officer, National Research Council Canada, 1200 Montreal Rd., Ottawa, Ontario, Canada, K1A 0R6, Email: Bruce.Baldock@nrc-cnrc.gc.ca.
INTRODUCTION
Many of North America’s bridges are in urgent need of substantial rehabilitation, nearly one of every three
bridges is rated structurally deficient or functionally obsolete (Smith and Virmani 2000). They estimated
the cost of repairing and replacing deteriorated concrete bridges to be over $20 billion in USA, and
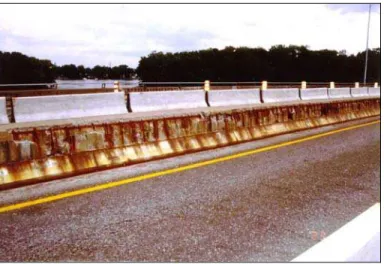
increasing at $500 million per year. The main cause of deterioration of concrete bridge structures (e.g.
cracking, delamination and spalling of concrete) is the chloride-induced corrosion of steel reinforcing
bars, as illustrated in Figure 1.
Design solutions, in part, involve specifying the appropriate concrete mix constituents, coating of the
reinforcement, and/or sealing of the hardened concrete to slow down the rate of rebar corrosion in
concrete structures. Amongst different corrosion-protection systems, corrosion inhibitors are considered
one of the most cost-effective solutions. The mechanisms by which they protect the reinforcing steel from
corrosion are often complex and vary according to the type of inhibitors used. Some inhibitors retard
corrosion by reducing the rate of the cathodic and/or anodic reactions, while others inhibit corrosion by
reducing the concrete permeability to chloride ions.
Several corrosion inhibitors have been used for the last 20 years on new or rehabilitated concrete bridges
to extend their service lives. The most common ones are active inhibitors based on inorganic nitrites. In
recent years, active-passive inhibitors based on organic amines have gained popularity. Yet very little
information exists on the long-term field performance of concrete structures built or repaired with such
corrosion-inhibiting systems. The selection of appropriate corrosion inhibitors for specific field
applications remains a difficult task, since it can be seen from these studies that a given inhibitor may have
different performance depending on the experimental test conditions. Contradictory performance results
have sometime been obtained between laboratory studies and field observations (Elsener 2001; Chambers
et al. 2003). Documented test results from field investigations are then necessary to clarify the
This paper presents a five-year assessment of the field performance of nine corrosion-inhibiting systems
applied on a major highway bridge near Montreal, Canada. Field corrosion measurements, including
half-cell potential, linear polarization and concrete electrical resistivity were performed over the reinforcement
of the bridge barrier walls. Additional laboratory corrosion tests in electrochemical cells and on field-cast
concrete prisms were also carried out to support the field study; they are presented in a companion paper.
RESEARCH SIGNIFICANCE
The claimed effectiveness of most corrosion inhibiting products on the market is based on laboratory
testing or observations from periodic field inspections. The former has a narrow focus, while the latter
provides a limited understanding of the underlying physical performance. The main objectives of this
investigation were: (i) to evaluate the in-service performance of rehabilitated concrete structures subject to
the simultaneous effects of de-icing salt contamination, freeze-thaw (F/T) and wet-dry cycles; and (ii) to
understand the factors governing the performance of corrosion inhibiting systems in the field. The results
obtained in this study will enable bridge owners to make informed decisions when selecting corrosion
inhibiting systems, and provide manufacturers with information suitable for product improvement.
EXPERIMENTAL INVESTIGATION Test Structure and Rehabilitation Work
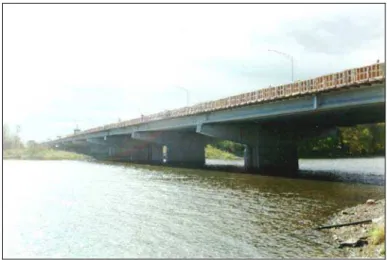
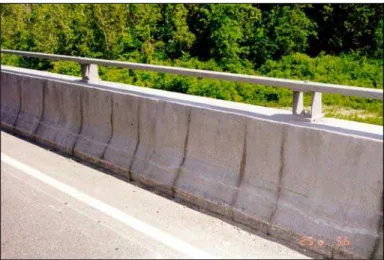
In 1996, the Ministry of Transportation of Quebec undertook the rehabilitation of the Vachon bridge
located north of Montreal on Highway 13 across Mille-Îles River (Figure 2). The overall rehabilitation
included the replacement of the barrier walls and patching of the concrete slab (later paved with asphalt).
This 6-lane wide, 714-m long bridge has twenty-one 34-m long single spans consisting of prestressed
concrete girders supporting a reinforced concrete slab. Ten consecutive spans of the east-side barrier wall
barrier wall presented many advantages over the slab as a test site: (a) similar initial conditions, (b) direct
exposure to chlorides, and (c) ease of access for instrumentation and corrosion surveys.
Eight spans of barrier wall were built using a standard concrete mix (Table 1) and conventional
carbon-steel reinforcement; each span included a different corrosion inhibiting system (Table 2) provided and
installed by its manufacturer. The concentration of each corrosion inhibitor in the concrete was the one
recommended by its manufacturer for bridge decks. For instance, the dosages of the corrosion-inhibiting
admixtures of Systems B, C, E, F, G and H were 10, 22, 5, 0.7, 10 and 15 L/m3 of concrete, respectively.
The total water content in the concrete, accounting for the liquid part of the corrosion-inhibiting
admixture, was maintained constant in all test spans of barrier wall. Two other test spans were built using
the same concrete but with no corrosion inhibitors: one span with carbon-steel reinforcement (identified as
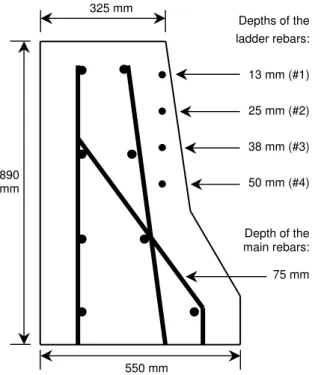
Control Span), and the other span with epoxy-coated steel reinforcement (identified as Epoxy Span). As
schematically shown in Figure 3, the main reinforcement consisted of eight 15-mm longitudinal bars in
the cross-section, and 15-mm transverse bars spaced at 230 mm along the barrier wall length. The
concrete had a water-cement ratio of 0.36, an air content of 6.5% (± 1.5%), a slump of 80 mm (± 20 mm),
and a 28-day compressive strength of 45 MPa on average. Concreting took place in October 1996; no
special protection for curing was used by the contractor, and the forms were stripped one day after casting.
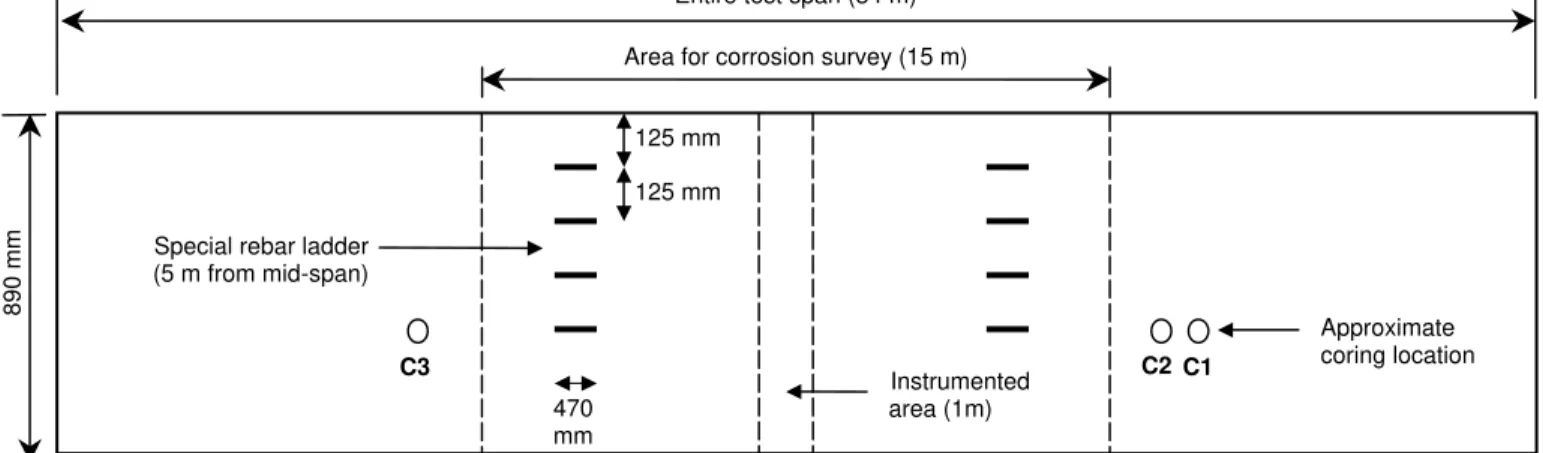
As shown in Figure 4, each corrosion-inhibiting system was applied over the 34-m length of its assigned
test span of barrier wall. Non-destructive corrosion testing was limited to the 15-m central portion of the
span to avoid measuring possible secondary effects from adjacent test spans, since the reinforcement was
continuous in the existing slab. Concrete cores for laboratory testing of strength, permeability and chloride
content were taken just outside this 15-m central portion; and embedded instrumentation for remote
Field Instrumentation and Data Logging System
Manganese dioxide (MnO2) reference electrodes (ERE 20, from Forces Institutes) were embedded in
concrete to monitor the corrosion potential of the reinforcement in the barrier wall. Their reference
potential was approximately 100 mV more positive with respect to copper sulfate electrodes (CSE). The
embedded MnO2 electrodes were calibrated with external CSE during the annual corrosion surveys.
Capacitance-type relative humidity and temperature (RH/T) sensors (Humitter 50Y, from Vaisala) were
installed in the wall near the top and bottom of the cross-section; one additional sensor was installed
behind the barrier wall to measure the ambient environmental conditions at the bridge. Custom-made
temperature-compensated stainless steel strain gauges (SG) were embedded in the wall near the top and
bottom of the cross-section to measure the longitudinal strains in the rebuilt structure.
Five data acquisition systems were installed at the bridge. The 16-bit central processing unit (Datataker
DT-505, from Data Electronics) supported various types of sensors, on-line data manipulation and
statistical functions. Each system consisted of the following major components: (i) a 10-channel
acquisition unit with two 10-channel extension modules (impedance of 10 MΩ), (ii) a cellular modem for data transfer, (iii) an AC-DC transformer, (iv) a 12-volt battery in case of short-term power failures, and
(v) a metal enclosure with added interior insulation to reduce temperature extremes, as the heat produced
by the modem was relied upon to enhance the thermal protection needed during cold winter days.
All sensor wires were properly protected in concrete and carried out into junction boxes located behind the
barrier wall. The sensors were connected to the data loggers, which were firmly anchored in the back of
the concrete barrier at the junction of two consecutive test spans. As a result, the cable length between the
sensors and their respective loggers was constant and minimal, which reduced the noise level picked up by
the cables. The five data loggers were programmed to take hourly readings from the sensors and store in a
On-site Corrosion Measurements
On-site corrosion surveys of the barrier wall were performed annually during the month of June from
1997 to 2001, including measurements of half-cell potential, corrosion rate and concrete electrical
resistivity. These annual surveys were conducted under similar environmental conditions, including
ambient temperature (15-25°C) and concrete surface condition (i.e. free of visible moisture). A saturated
CSE and a multimeter were used to measure the half-cell potential following the ASTM C876 procedure.
The measurements were taken at 110, 345 and 550 mm from the top of the barrier wall, and horizontally at
300-mm intervals over the central 15-m portion of each test span. A Gecor 6 device (manufactured by
James Instruments) was used to measure the corrosion rate of steel in concrete by the polarization
resistance technique. This technique works by applying a small current to the reinforcing bar and
measuring the change in polarization potential (Broomfield et al. 1993). Gecor 6 has the ability to confine
the area of measurement by a sensor-controlled guard ring (Feliu et al. 1990). The same device (with
another sensor) was also used to determine the electrical resistivity of the concrete by measuring the “IR
drop” from a DC pulse applied between the sensor and reinforcement (Broomfield et al. 1993). In each
test span, measurements were taken on vertical and horizontal bars at cracked and uncracked locations.
For early detection of corrosion and early performance evaluation of the corrosion inhibiting systems, two
sets of rebar ladders were embedded in each test span during rehabilitation (Figures 3 and 4); except in the
control concrete, in which four sets of ladders were embedded. Half-cell potentials and corrosion rates
were taken over these ladders using the instruments and methods described above. Each ladder was made
of four 470-mm long horizontal bars (10-mm diameter) spaced at 125 mm center to center. The ladder
bars had varying concrete cover thicknesses ranging from 13 mm for the upper bar, and 25 mm, 38 mm
ANALYSIS OF FIELD RESULTS Observation of Early-Age Cracking
A visual inspection of the barrier wall, carried out 1.5 days after casting, revealed closely spaced cracks
running completely through the walls, raising a concern for premature rebar corrosion due to accelerated
moisture and salt ingress and eventual spalling of the concrete cover. These vertical cracks had an average
spacing of 800 mm. No joints other than the control joints between each 34-m long span of barrier wall
were present to control crack spacing. Most cracks had a width of 0.2 mm or less, with a few having
openings of 0.3 mm. Figure 5 presents a photograph, taken 7 months after reconstruction, illustrating the
severe transverse cracking in the barrier wall. This type of cracking is common on such structures
according to a survey (TRB 1996) of 52 Departments of Transportation across North America, which
revealed that more than 100,000 bridges in the United States – about half of the bridges monitored by the
respondents – had developed transverse cracking of the deck shortly after reconstruction.
A study (Cusson and Repette 2000) was conducted to determine the underlying causes of this problem
using time-dependent numerical models and measured field data. It was concluded that the early-age
cracking was mainly due to uncontrolled thermal effects and autogenous shrinkage, typical of
high-strength concrete with high cement content and low water-cement ratio. The models confirmed that, after
a large amount of heat was released due to cement hydration, the rapid decrease of the concrete
temperature combined with early-age autogenous shrinkage resulted in a severe contraction of the barrier
wall. Stress-induced cracking resulted from contractions of the barrier wall restrained by the existing
concrete slab. In addition, large temperature gradients in the cross-section of the wall likely occurred at
early-age due to rapid ambient temperature fluctuations and the presence of unsymmetrical thermal
boundary conditions (i.e. plywood panels used at the back of the barrier wall and steel panels used at the
front). As a result, the contraction that occurred near the front face of the wall was internally restrained by
This early cracking was not related to the use of the corrosion inhibiting systems in the barrier wall, since
the same cracking pattern also occurred in other spans that were not protected by corrosion inhibiting
systems. However, this cracking probably has accelerated the ingress of moisture, chlorides and oxygen to
the reinforcement, resulting in more severe conditions than in uncracked concrete.
Remote Monitoring of Internal Environmental Conditions of the Concrete Barrier Wall
A rise in temperature can increase of the rate of corrosion. The moisture level in concrete also influences
reinforcement corrosion as it affects carbonation, chloride ingress, electrical resistivity, and oxygen level.
It is therefore important to have adequate information on the prevailing environmental conditions in the
concrete, thus providing better data for input into predictive models, improving their reliability. This
information also ensures adequate analysis of the parameters that govern the field performance of the
concrete systems, such as corrosion potential, electrical resistivity, strain, etc.
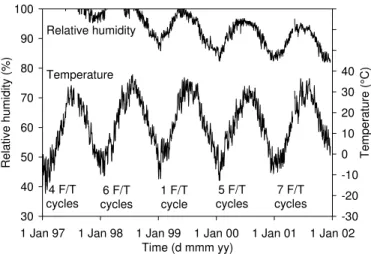
Figure 6 shows the typical concrete temperature data measured in the Control Span of the barrier wall.
Similar results from other test spans confirmed that the concrete temperature was similar from span to
span, indicating that the presence or type of corrosion inhibitors had no effect on the thermal properties of
the concrete. The concrete temperature typically varied from approximately –15°C in January to +35°C in
August. The temperature in the centre of the barrier was at least 5°C warmer than the ambient temperature
at any given time of the year. This was due to solar radiation and the heat capacity of the concrete.
The temperature data were also used to estimate the number of freeze-thaw cycles occurring during the
winter seasons. According to Neville (1996), capillary water in mature concrete freezes at about -5°C due
to chemicals in solution. The water in concrete will thaw at 0°C, provided that the duration of this
temperature is long enough (few hours). Based on these assumptions, the number of freeze-thaw cycles
occurring in the concrete barrier wall during each winter was determined (see Figure 6), totaling 23 F/T
cannot be compared to controlled F/T cycles measured in the laboratory according to ASTM C666, as
there are significant differences in the range and rate of change in temperature and moisture.
The risk of reinforcement corrosion is directly related to the evaporable water content in concrete,
however, measurements of relative humidity are often taken in concrete structures by using RH sensors
due to their ease of use and relatively low cost (Broomfield 1996). When exposed to an environment of a
given RH and temperature, the moisture content in the concrete pores equilibrates with the ambient
humidity after some time. RH readings, however, do not represent the moisture content directly, as daily
and seasonal cycles of temperature can affect them. A compensation for temperature needs to be carried
out on the measured RH data in order to obtain an indication of the variation of water content in concrete.
The procedure provided by Pruckner and Gjorv (2001) was therefore used to normalize the measured RH
data for a constant temperature of 25°C.
In Fig. 6, the temperature-compensated RH in the Control Span of the barrier is shown to follow a
seasonal pattern with high RH measured in May-June and lower RH in December-January. This is typical
of this region with the months of May and June having frequent rainy periods and the months of
December and January being cold and dry. As expected, the concrete RH decreased over the years as a
result of continual cement hydration and drying. Although some differences in RH were observed between
the test spans (not shown here); the values at any given time were always above 70 % during the 5-year
monitoring period. According to ACI Committee 222, the risk of corrosion can be considered low in dry
concrete when RH is lower than 50% due to an impeded electrolytic process, or in fully saturated concrete
due to low oxygen concentration at the steel-concrete interface. In partially saturated concrete, however,
the risk of corrosion becomes higher since oxygen can easily diffuse through concrete to the
reinforcement, which will accelerate the corrosion process. As seen above, the measured RH values were
confirmed that the environmental conditions at the bridge were favorable to rebar corrosion during the
field investigation.
Risk of Corrosion of the Main Reinforcement
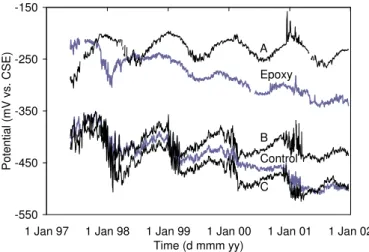
Figure 7 presents five of the ten curves of half-cell potential of the reinforcement monitored continuously
by MnO2 reference electrodes embedded at specific locations in the concrete barrier wall. The five other
curves (Spans D to H, not shown for brevity) are similar to the curve presented for the Control Span. In
general, all curves show a seasonal variation of the potential with the least negative values occurring
during the cold winter months (November–February) and the most negative values occurring in warmer
weather, as expected. The half-cell potential curves for the Epoxy Span and Span A stand above all other
curves. The apparent difference in potential of these two spans from the other test spans is due to the high
electrical resistance induced by the presence of the coating on the reinforcement. In this case, the current
flow had to go through the highly resistive path between the reinforcement and the MnO2 reference
electrode, resulting in a shift of the half-cell potential towards less negative values. It is therefore
important in the analysis to consider the relative changes in half-cell potential over time rather than the
numerical values at a given time, as it is well known, very negative half-cell potential readings can arise
from factors other than corrosion (Elsener et al. 2003; Hansson et al. 2004). In this regard, the curves of
Spans A and B show the smallest overall decrease in potential over the years, which is a possible
indication of the beneficial effect of these corrosion-inhibiting systems in reducing the risk of corrosion.
Figure 8 shows the half-cell potentials measured over the main reinforcement, where each data point is an
average of over a hundred readings taken during a single annual survey. The half-cell potentials were
between –300 mV and –400 mV in 1997 (except in Epoxy Span) and shifted gradually over time towards
more negative values, in general. The Epoxy Span, which had an initial potential of –250 mV in 1997,
showed the sharpest change towards negative potential values over the years. The observed negative shifts
concrete resulting in oxygen depletion in the concrete and (ii) the presence of early-age cracks possibly
resulting in localized pitting corrosion of the reinforcement.
Figure 9 shows the cumulative distributions of half-cell potential obtained on the ten test spans for the
1997, 1999 and 2001 surveys. From 1997 to 2001, the half-cell potential shifted towards more negative
values, which is a clear indication of the increase in the risk of corrosion. By 2001, the potential had also
spread over a wider range of values. The Epoxy Span showed more positive potential values than in all
other spans in 1997. This is due to the high initial electrical resistance of epoxy coating on the
reinforcement. However, a substantial negative shift has occurred after 1997, which was possibly due to
the deterioration of the epoxy coating and/or the development of localized corrosion. In 2001, Span F
showed the most negative potential values followed by the Epoxy Span and Span E. The Control Span
showed average performance while Spans A and G, on the other hand, had the least negative potential
values, which is an indication of good performance.
Figure 10 shows the average corrosion rates measured over the main reinforcement under similar
environmental conditions at cracked and uncracked locations. Initially, some test spans showed relatively
high oxidation rates in 1997 and 1998, which were probably due to the formation of an oxide film on the
reinforcement. After 1998, low corrosion rates were found in all test spans as they reduced to values below the threshold of 0.5 μA/cm2, proposed by Rodriguez et al. (1994) for the Gecor 6 device. This net
reduction was probably due to the beneficial effects of the corrosion-inhibiting systems and/or oxygen
depletion at the steel surface. In general, higher corrosion rates were found at cracked locations than at
uncracked locations over the five years, with an overall rate increase of 30% for the nine spans with
carbon-steel reinforcement. An overall increase of 260% was found for the Epoxy span, however, this was
the test span with the lowest corrosion rates at uncracked locations. In Span G, the equipment limitation
conductivity of the concrete surface (hydrophobic penetrating sealer). In 2001, however, the highest
corrosion rate of the group was measured on Span G at cracked locations.
Figure 11 presents the values of concrete electrical resistivity measured in the barrier wall from 1997 to 2001. In 1997, the measured values were relatively low (8-16 kΩ cm) in most spans, probably due to the high moisture content in the new concrete and the initially-moderate concrete permeability. The resistivity
values increased with time, in general, except in the Epoxy Span and the Control Span. In the Epoxy Span,
the decrease was probably due to the deterioration of the epoxy coating on the rebar leading to
development of corrosion where the epoxy coating was very thin or had been scratched during installation.
Corrosion of the Rebar Ladders
Figure 12 shows the half-cell potential measured on the special rebar ladders for each span. In all spans, it
can be seen that the half-cell potentials became more negative with time. In general, half-cell potentials
had the most significant change on the top bar (bar 1 with 13 mm cover, highest chloride content) and the
least change on the lower bars (bars 2, 3 and 4 with thicker covers), as expected. Of the ten test spans,
Spans G and H had the least negative half-cell potentials, especially on the top bars.
As shown in Figure 13, the corrosion rates were much higher on the top ladder bar (thinnest cover) than
on the second ladder bar in most spans, as expected. The corrosion rate on Span G was not measured in
the first three years due to the very low concrete conductivity. On Spans E and G, high corrosion rates
were measured at the ladders in 2001, coinciding with observations of horizontal cracks and rust stains
along the top ladder rebars. It should be noted that corrosion at these locations was probably initiated by
the premature shrinkage cracks found over the rebar ladders. A high corrosion rate was also measured on
Span B in 2001, however, no shrinkage cracks were observed at the ladder. In Spans D and H, the
corrosion rates were quite low on both the first and second bars of the ladders, showing the beneficial
Strength, Permeability and Chloride Content
Table 3 presents the compressive strengths measured according to ASTM C39 on concrete cores taken
from the barrier wall in May 1997 (0.5 years after reconstruction) and June 2001 (4.5 years). As hydration
of cement proceeded, the overall compressive strength increased by 37 % in four years. The water vapor
permeability coefficients, measured according to ASTM E96 in Dec. 1996, May 1997 and June 2001
show a steady decrease in the permeability as a function of time, due to further hydration of cement. All
the coefficients of permeability measured in 1996 and 1997 can be considered representative of moderate
permeability, and all those measured in 2001 are indicative of very low permeability (<10x10-12 m/s),
according to Neville (1996). The depth of carbonation was also measured on cores taken in June 2001
using a phenolphthalein solution and an optical microscope. No carbonation was found at the surface of
the barrier wall after 4.5 years. The results in Table 3 confirm that the corrosion inhibiting systems did not
have detrimental effects on the measured concrete properties (e.g. strength and permeability). The
concrete of Span E obtained the lowest coefficient of permeability of the group. The corrosion admixture
in this particular concrete was claimed by the manufacturer to reduce chloride ingress.
The total content of chlorides by weight of concrete was determined from cores taken from the barrier
wall according to ASTM C114. Figure 14 illustrates the chloride profiles measured in 1997, 1998, 2000
and 2001 for each span. As expected, the chloride ion contents increased over time and decreased with
concrete depth. At depths of 25-50 mm, the chloride contents in all spans were below the critical threshold
value of 0.1% by weight of concrete (Stoltzner et al. 1997) after the first two winters. By 2001, the
concretes in all spans had chloride contents exceeding this threshold value. At depths of 50-75 mm (actual
rebar level), the concretes in all test spans had chloride contents below the threshold value after 5 years,
suggesting that the risk of corrosion of the reinforcing steel was low at uncracked locations. However,
slowest penetrations of chloride ions of the group (Admixture E was claimed to reduce chloride ingress).
The corrosion-inhibiting system in Span G performed very well in the first year, at which time no
chlorides were found in the concrete. In the following years, however, the hydrophobic sealer of System G
did not show a clear improvement in reducing chloride ingress compared to the other systems with no
sealers. It is important to mention that the concrete sealer of System G was applied over the thin parging
of the barrier wall surface, which spalled off a year after installation due to severe weathering and
abrasion.
OVERALL PERFORMANCE OF INVESTIGATED CORROSION INHIBITING SYSTEMS
The evaluation of the performance of systems having different corrosion-inhibiting mechanisms installed
on a concrete structure is a challenging task. On one hand, there is no single test capable of determining
the overall performance of a system in the field and; on the other hand, different tests offer conditions of
varying severity and type, and therefore the performance of a particular system may vary according to the
tests used in such study. In order to provide a meaningful assessment of the overall performance of the
corrosion inhibiting systems, the performance of a given system during a particular test was evaluated
against the performance of the control system.
The assessment of corrosion of the main reinforcement indicated that the risks of corrosion in all test
spans were low but increased slowly (i.e. negative changes in half-cell potential and increasing corrosion
rates). The thick concrete cover over the reinforcement (75 mm), the low concrete permeability and the
relatively short duration of the study (5 years) are reasons why no major differences in performance
between the corrosion-inhibiting systems and the control system were observed. The epoxy-coating
system performed well in the first year with the least negative half-cell potential and a low corrosion rate.
It showed early signs of decreasing performance in the following years with the largest negative potential
change over 5 years combined with low but increasing corrosion rates, which were possibly due to
The assessment of the corrosion of the rebar ladders installed in the barrier wall (cover thicknesses of 13,
25, 38 and 50 mm) allowed additional findings about the performance of the corrosion inhibiting systems.
One system, the inorganic admixture corrosion inhibitor on span H, consistently performed well and better
than the control system (least negative change in potential and lowest corrosion rates). It was also able to
keep the chloride levels low in the concrete cover. The systems B, E and G had the highest corrosion rates
measured on the ladder bars with the 13-mm cover; with horizontal cracks and rust stains observed over
the ladder bars for Systems E and G.
SUMMARY AND CONCLUSIONS
The field performance of ten 34-m spans of a reconstructed bridge barrier wall protected with nine
proprietary corrosion-inhibiting systems and one control system were evaluated for 5 years. The bridge
structure was exposed to the severe Canadian climate, including freeze-thaw and wet-dry cycles, and
deicing salt contamination. The field performance of the corrosion-inhibiting systems was evaluated based
on measurements of half-cell potential, corrosion rate, concrete electrical resistivity and chloride ion
content obtained for the test spans of the barrier wall. Visual inspections and corrosion rate measurements
revealed early corrosion on the main reinforcement (cover of 75 mm) at cracked locations, and on the
embedded rebar ladders, which had thin concrete cover thicknesses (from 13 to 50 mm). The major
conclusions of this field investigation can be summarized as follows:
• The risks of corrosion of the main reinforcement in all test spans were low but increased slowly, as indicated by the negative change in half-cell potentials and the low but increasing corrosion rates. The
thick concrete cover, low concrete permeability and 5-year duration of the study explain the marginal
• The risks of corrosion of the rebar ladders with reduced cover thicknesses of 13, 25, 38 and 50 mm were higher than over the main reinforcement in all test spans, as indicated by more negative half-cell
potentials and higher corrosion rates, especially for the thin concrete covers of 13 and 25 mm. • System H, which is an inorganic concrete admixture, consistently provided good performance in all
the corrosion measurements taken over the embedded rebar ladders with thin concrete covers. • The epoxy-coating system, which performed very well in the first year, showed signs of decreasing
performance later on (i.e. largest negative change in potential and low but slightly increasing
corrosion rates). This may be due to pitting corrosion developing at damaged locations on the coating. • System G with the added concrete sealer was very effective during the first year in blocking the
chlorides from penetrating into the concrete to the reinforcement (no chlorides present at the surface).
After the first year, because it was applied on a weak parging that spalled off after the first winter, the
chloride content at any given depth in the concrete cover was not clearly lower than in the other test
spans.
• Shrinkage-induced vertical cracks were observed in each span of barrier wall shortly after reconstruction, with a regular spacing of 800 mm and a maximum width of 0.3 mm. As a result,
corrosion rates on the main reinforcement measured over the cracks were consistently higher than
those measured over uncracked locations, regardless of the corrosion-inhibiting systems used.
• Corrosion-induced horizontal cracks were observed in two test spans over the embedded rebar ladders where the concrete cover thickness was only 13 mm. The high corrosion rates measured at these
locations were due to the high chloride contents at the reinforcement, in turn due to the premature
shrinkage vertical cracking and higher rate of chloride diffusion.
• The values of water permeability measured on concrete cores taken from the bridge barrier wall in all test spans reduced to values lower than 10 x 10-12 m/s after 5 years, indicative of very low
reducing the corrosion current in concrete. These changes are mainly attributed to continued cement
hydration, as indicated by an overall 37% increase in the concrete compressive strength over 5 years. • The field performance of these corrosion-inhibiting systems will change in time, since five years is a
short period for such field study. Further monitoring is needed to corroborate these findings.
ACKNOWLEDGEMENTS
The financial and technical contributions of our project partners are gratefully acknowledged, namely:
Ministère des Transports du Québec (MTQ), Axim-Italcementi Group, Caruba Holdings, Euclid
Admixture Canada, Israel Richler Trading, Master Builders Technologies, Sika Canada, W.R. Grace &
Co, the Regional Municipality of Peel, and IRAP. The sustained assistance of Louis Marie-Bélanger and
Daniel Vézina from the MTQ is also gratefully acknowledged. The authors would also like to thank Noel
Mailvaganam and Roger Willoughby for their expertise and advise, and Mark Arnott, Rock Glazer, Ted
Hoogeveen and Gordon Chan for their valuable technical assistance.
REFERENCES
ACI Committee 222 (2001). “Protection of metals in concrete against corrosion,” American Concrete
Institute, Farmington Hills, 41 pp.
Broomfield, J.P. (1996). “Permanent corrosion monitoring,” Construction Repair, 10(2), Mar-Apr, 44-49.
Broomfield, J.P., Rodriguez, J., Ortega, L.M., Garcia, A.M. (1993). “Corrosion rate and life prediction for
reinforced concrete structures,” Proceedings of the Structural Faults and Repairs Symposium,
Edinburgh, Scotland, June, 9 p.
Chambers, B.D., Taylor, S.R., and Lane, D.S. (2003). “An evaluation of new inhibitors for rebar corrosion
in concrete,” Report VTRC 03-R8, Virginia Transportation Research Council, 61 pp.
Cusson, D., and Repette, W. (2000). “Early-age cracking in reconstructed concrete bridge barrier walls,”
Elsener, B. (2001). “Corrosion inhibitors for steel in concrete: state of the art report,” Publication Number
35 of the European Federation of Corrosion, The Institute of Material, ed., 68 pp.
Elsener, B., Andrade, C., Gulikers, J., Polder, R., Raupach, M. (2003). “Half-cell potential
measurements-potential mapping on reinforced concrete structures,” Materials and Structures, 36, Aug-Sep, 461-471.
Feliu, S., Gonzalez, J.A., Feliu S. Jr., Andrade, C (1990). “Confinement of the electrical signal for in situ
measurement of polatization resistance in reinforced concrete,” ACI Materials Journal, 87(5),
Sept.-Oct., 457-460.
Hansson, C.M., Seabrook, P.T., Marcotte, T.D. (2004). “In-place corrosion monitoring,” Concrete
International, 26(7), July, 59-65.
Neville, A. M. (1996). “Properties of concrete,” 4th ed., John Wiley & Sons, Inc., ed., New-York, 844 pp.
Pruckner, F. and Gjorv, O.E. (2001). “Measurements of relative humidity in concrete,” Proceedings of the
3rd Int. Conference on Concrete Under Severe Conditions, N. Banthia, K. Sakai and O.E. Gjorv, eds.,
Vancouver, 1489-1496.
Rodriguez, J., Ortega, L.M., Garcia, A.M. (1994). “Assessment of structural elements with corroded
reinforcement,” Proceedings of the International Conference on Corrosion, Sheffield, U.K., July, 16 p.
Smith, J.L. and Virmani, Y.P. (2000). “Materials and methods for corrosion control of reinforced and
prestressed concrete structures in new construction” Report No. FHWA-RD-00-081, FHWA, August,
82 pp.
Stoltzner, E., Knudsen, A., and Buhr, B. (1997). “Durability of marine structures in Denmark,”
Proceedings of the International Conference on Repair of Concrete Structures From Theory to
Practice in a Marine Environment, A. Blankvoll, ed., Svolvaer, Norway, May, 59-68.
TRB (1996). “Transverse cracking in newly constructed bridge decks, ” National Co-operative Highway
Research Program Report 380, Transportation Research Board, National Academy Press, ed.,
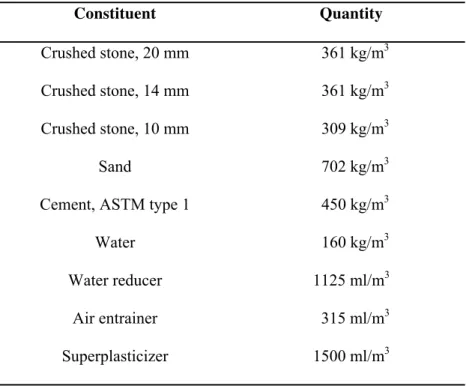
Table 1. Concrete mix design for barrier wall under study Constituent Quantity Crushed stone, 20 mm 361 kg/m3 Crushed stone, 14 mm 361 kg/m3 Crushed stone, 10 mm 309 kg/m3 Sand 702 kg/m3
Cement, ASTM type 1 450 kg/m3
Water 160 kg/m3
Water reducer 1125 ml/m3
Air entrainer 315 ml/m3
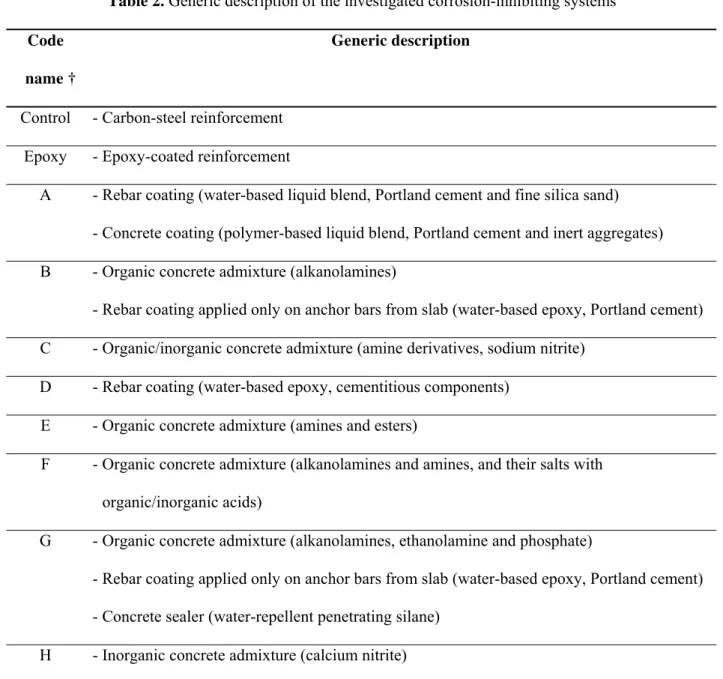
Table 2. Generic description of the investigated corrosion-inhibiting systems
Code name †
Generic description
Control - Carbon-steel reinforcement
Epoxy - Epoxy-coated reinforcement
A - Rebar coating (water-based liquid blend, Portland cement and fine silica sand)
- Concrete coating (polymer-based liquid blend, Portland cement and inert aggregates)
B - Organic concrete admixture (alkanolamines)
- Rebar coating applied only on anchor bars from slab (water-based epoxy, Portland cement)
C - Organic/inorganic concrete admixture (amine derivatives, sodium nitrite)
D - Rebar coating (water-based epoxy, cementitious components)
E - Organic concrete admixture (amines and esters)
F - Organic concrete admixture (alkanolamines and amines, and their salts with
organic/inorganic acids)
G - Organic concrete admixture (alkanolamines, ethanolamine and phosphate)
- Rebar coating applied only on anchor bars from slab (water-based epoxy, Portland cement)
- Concrete sealer (water-repellent penetrating silane)
H - Inorganic concrete admixture (calcium nitrite)
Table 3. Material properties measured on concrete cores taken from barrier wall Code name Compressive strength (MPa) Coefficient of permeability (m/s x 10-12) May 1997 June 2001 Dec. 1996 May 1997 June 2001 Control 41 59 22.8 17.2 7.0 Epoxy 43 n/a 22.6 15.4 7.1 A 43 64 21.3 13.9 6.7 B 46 68 13.5 12.8 5.6 C 38 50 10.1 10.7 4.6 D 39 54 12.7 12.3 6.7 E 45 69 15.1 11.5 4.3 F 45 60 16.5 15.9 8.7 G 50 68 14.3 14.9 6.2 H 55 60 18.3 14.1 7.3
FIGURE CAPTIONS
Fig. 1. Central barrier wall of Vachon bridge after 20 years of service (Montreal, Canada)
Fig. 2. Vachon bridge during rehabilitation in 1996
Fig. 3. Cross-section of typical test span of barrier wall
Fig. 4. Elevation of typical test span of barrier wall
Fig. 5. Transverse cracking observed after reconstruction
Fig. 6. Relative humidity and temperature measured in concrete of Control Span
Fig. 7. Half-cell potential measured with embedded reference electrodes
Fig. 8. Average half-cell potential obtained over main reinforcement
Fig. 9. Cumulative distributions of half-cell potential measured over main reinforcement
Fig. 10. Corrosion rate measured over main reinforcement at cracked and uncracked locations
Fig. 11. Concrete electrical resistivity measured over main reinforcement
Fig. 12. Half-cell potential measured over embedded rebar ladders
Fig. 13. Corrosion rate measured over embedded rebar ladders
325 mm 550 mm 890 mm Depth of the main rebars: 75 mm Depths of the ladder rebars: 13 mm (#1) 25 mm (#2) 38 mm (#3) 50 mm (#4)
Area for corrosion survey (15 m) Entire test span (34 m)
Special rebar ladder (5 m from mid-span) 890 mm C2 C1 C3 Approximate coring location Instrumented area (1m) 470 mm 125 mm 125 mm
30 40 50 60 70 80 90 100
1 Jan 97 1 Jan 98 1 Jan 99
Fig. 6. Relative humidity and temperature measured in concrete of Control Span
1 Jan 00 1 Jan 01 1 Jan 02 Time (d mmm yy) R e la ti ve h u m id it y (% ) -30 -20 -10 0 10 20 30 40 50 60 70 Te mp er a tu re (°C) Temperature Relative humidity 6 F/T cycles 1 F/T cycle 5 F/T cycles 7 F/T cycles 4 F/T cycles
-550 -450 -350 -250 -150
1 Jan 97 1 Jan 98 1 Jan 99 1 Jan 00 1 Jan 01 1 Jan 02 Time (d mmm yy) Po ten tial (mV vs. CSE) Control Epoxy A B C
-500 -400 -300 -200 Po te nt ia l ( m V v s . CS E) -500 -400 -300 -200 1997-2001 1997-2001 1997-2001 1997-2001 1997-2001 Control Epoxy A B C D E F G H
0 20 40 60 80 100 > -250 -250 -275 -276 -300 -301 -325 -326 -350 -351 -375 -376 -400 -401 -425 -426 -450 -451 -475 -476 -500 -501 -525 -526 -550 -551 -575 -576 -600 Potential (mV vs. CSE) 2001 0 20 40 60 80 100 1999 0 20 40 60 80 100 Control Epoxy A B C D E F G H 1997 Cumulativ e fre q ue nc y ( % )
0.0 0.2 0.4 0.6 0.8 1.0 Cor ros ion ra te ( μA/ cm 2 ) Cracked Uncracked 0.0 0.2 0.4 0.6 0.8 1.0 Control Epoxy A B C D E F G H 1997-2001 1997-2001 1997-2001 1997-2001 1997-2001
0 20 40 60 80 Re si st iv it y ( k o h m c m ) 0 20 40 60 80 1997-2001 1997-2001 1997-2001 1997-2001 1997-2001 Control Epoxy A B C D E F G H
-700 -500 -300 -100 Potential ( m V vs. C SE) #1 (13mm) #2 (25mm) #3 (37mm) #4 (50mm) -700 -500 -300 -100 Control-1 Control-2 A B C D E F G H 1997-2001 1997-2001 1997-2001 1997-2001 1997-2001
0.0 0.5 1.0 1.5 Co rro s io n ra te (μA/ c m 2 ) #1 (13mm) #2 (25mm) 0.0 0.5 1.0 1.5 Control-1 Control-2 A B C D E F G H 1997-2001 1997-2001 1997-2001 1997-2001 1997-2001
0.0 0.2 0.4 0.6 0.8 C h lor id e co nt en t (% ) 0-13mm 13-25mm 25-50mm 50-75mm 0.0 0.2 0.4 0.6 0.8 Control Epoxy A B C D E F G H 1997-2001 1997-2001 1997-2001 1997-2001 1997-2001