Publisher’s version / Version de l'éditeur:
Vous avez des questions? Nous pouvons vous aider. Pour communiquer directement avec un auteur, consultez la
première page de la revue dans laquelle son article a été publié afin de trouver ses coordonnées. Si vous n’arrivez pas à les repérer, communiquez avec nous à [email protected].
Questions? Contact the NRC Publications Archive team at
[email protected]. If you wish to email the authors directly, please see the first page of the publication for their contact information.
https://publications-cnrc.canada.ca/fra/droits
L’accès à ce site Web et l’utilisation de son contenu sont assujettis aux conditions présentées dans le site LISEZ CES CONDITIONS ATTENTIVEMENT AVANT D’UTILISER CE SITE WEB.
Probabilistic Methodologies in Water and Wastewater Engineering: 23 September 2011, Toronto, ON., Canada [Proceedings], pp. 1-9, 2011-09-23
READ THESE TERMS AND CONDITIONS CAREFULLY BEFORE USING THIS WEBSITE. https://nrc-publications.canada.ca/eng/copyright
NRC Publications Archive Record / Notice des Archives des publications du CNRC :
https://nrc-publications.canada.ca/eng/view/object/?id=d6084d10-3ce2-4483-a1ff-1473ff8955d2 https://publications-cnrc.canada.ca/fra/voir/objet/?id=d6084d10-3ce2-4483-a1ff-1473ff8955d2
NRC Publications Archive
Archives des publications du CNRC
This publication could be one of several versions: author’s original, accepted manuscript or the publisher’s version. / La version de cette publication peut être l’une des suivantes : la version prépublication de l’auteur, la version acceptée du manuscrit ou la version de l’éditeur.
Access and use of this website and the material on it are subject to the Terms and Conditions set forth at Energy recovery in water distribution systems using microturbines
Energy recovery in water
distribution systems using
microturbines
Colombo, A.; Kleiner, Y.
NRCC-54556
A version of this document is published in / Une version de ce document se trouve dans: Probabilistic Methodologies in Water and Wastewater Engineering (in Honour of Prof. Barry Adams, University of Toronto) Toronto, Canada, September 23-27, 2011, pp. 1-9
The material in this document is covered by the provisions of the Copyright Act, by Canadian laws, policies, regulations and international agreements. Such provisions serve to identify the information source and, in specific instances, to prohibit reproduction of materials without written permission. For more information visit http://laws.justice.gc.ca/en/showtdm/cs/C-42
Les renseignements dans ce document sont protégés par la Loi sur le droit d’auteur, par les lois, les politiques et les règlements du Canada et des accords internationaux. Ces dispositions permettent d’identifier la source de l’information et, dans certains cas, d’interdire la copie de documents sans permission écrite. Pour obtenir de plus amples renseignements : http://lois.justice.gc.ca/fr/showtdm/cs/C-42
1
Energy recovery in water distribution systems using microturbines
Andrew Colombo and Yehuda Kleiner
National Research Council of Canada, Institute for Research in Construction 1200 Montreal Road, Ottawa, Ontario K1A 0R6, Canada
Abstract:
The viability of deploying microturbines for energy recovery and downstream pressure dissipation in water distribution systems was examined. A simple, yet representative, system that included a source with surplus head and a conduit of moderate size was used to ascertain the financial viability of using a microturbine to dissipate pressure. Discharge through the system was the most important factor contributing to the turbine’s performance, which was analyzed probabilistically using Monte Carlo simulation with system demand as a random variable. The roles of diurnal demand patterns and a random annual demand growth rate were also considered.
Keywords: Microturbines, energy recovery, water distribution systems, Monte Carlo simulation
Introduction
Traditional ways to reduce energy use in water distribution systems have focused on pump selection, pipe sizing and relining, optimization of tank filling operations, leak detection and repair, and pressure management. Recently, there has been growing interest not only to reduce energy consumption in systems but to recover energy and possibly derive revenue in situations where excess pressure requires dissipation, such as in systems with significant topographic variation. Giugni et al., (2009) analyzed the potential of turbines to replace pressure reducing valves (PRV) for pressure control and to generate revenue for a district of Naples. McNabola et al., (2011) conducted a preliminary financial assessment of replacing break-pressure tanks with turbines for several reservoir trunk mains in Ireland. The potential of linking microturbine use for pressure control and energy recovery in water distribution systems, in conjunction with pumps driven by renewable energy, such as from wind farms, has also been examined (Vieira and Ramos, 2009).
2
While feasibility assessments have been conducted at the academic and consulting level,
microturbines have already been installed in some real systems. The District of West Vancouver replaced a PRV with a Pelton wheel turbine at its Eagle Lake high elevation reservoir and
produces about 1.1 GWh of electricity per year, approximately 20% of the District’s power needs. Hart and Crotwell (2009) describe the potential installation of regenerative turbines in the municipal water system of Greensboro, North Carolina. Recently, the water utility of Keene, New Hampshire installed two microturbines to replace a PRV and earn revenue from selling power to the electrical grid (Tozzi, 2011).
This paper examines the feasibility of microturbine application from a probabilistic perspective, focusing on demand uncertainty and its impact on the turbine’s financial return. Analysis is undertaken using Monte Carlo simulations on a hypothetical moderately-sized (16 inch diameter) water main.
Hypothetical system and characteristic properties
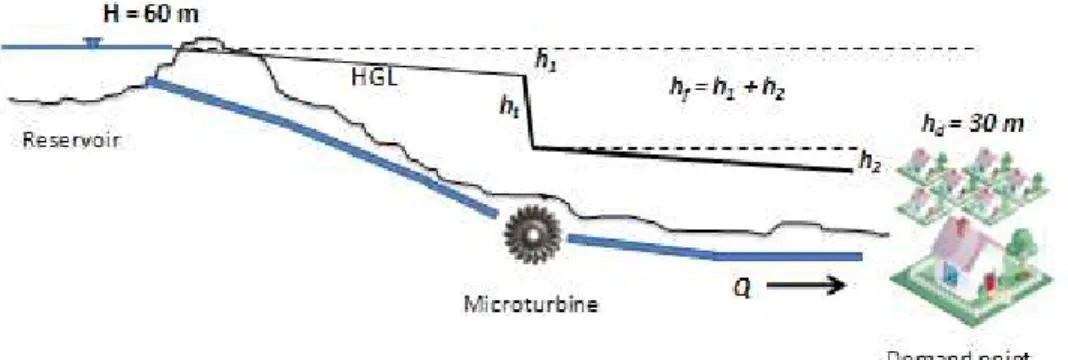
Figure 1 illustrates the system studied here. Constant head, H (m), is provided upstream. Water is delivered through a 16” (400 mm), 1 km long pipe (Hazen-Williams C=110 assumed), at an average flow rate, Q (m3/s). Minimum demand pressure hd (m) is required. The power generated by a turbine is given by
� = ���ℎ� (1)
Where ht is the head (m) drop through the turbine, Q is the flow (m3/s) through the turbine (the same as the demand in this system), γ is the specific weight of water (9.81 kN/m3) and η is the efficiency of the turbine (treated as 100% for this analysis). The head available to the turbine, ht, is the difference between source head and the downstream pressure constraint after accounting for dynamic losses, hf, which are dependent on Q.
In reality, numerous uncertainties may exist in the parameters of even a simple system such as the one examined here. These include demand flow magnitude and fluctuations, long-term growth in demand, pipe friction coefficients, future costs, etc., all of which would impact the microturbine’s economic performance (e.g., annual revenue, NPV, payback period, etc.). In this investigation we consider a fixed-head source as well as known pipe characteristics and focus on
3
Figure 1. System profile and key parameters.
Figure 2. Average turbine head and daily revenue (1000 simulations).
Head at turbine
95% confidence Mean Revenue
Zero-revenue days Distribution of revenue at 0.1 m3/s
4
demand uncertainties, which are examined using Monte Carlo simulations (typically 1000 realizations of various input parameters). Figure 2 illustrates the performance of the system over a range of demands (assumed normally distributed) with means that vary from 0.1 to 0.35 m3/s and constant standard deviation 0.02 m3/s. Revenue from power production was assumed at a flat rate of $0.09/kWh.
Figure 2 clearly demonstrates the tradeoff between head and flow. As the mean demand increases, the head available at the turbine consistently decreases due to friction losses. Nonetheless, power production increases with flow up to about 0.2 m3/s (since head losses are approximately proportional to the flow rate squared) and gradually diminishes thereafter. It is interesting to note that for a simple system such as this, the peak of the revenue curve can be determined analytically as follows:
� = ���� − �ℎ�+ℎ��� (2)
Where the frictional head loss can be expressed in terms of flow and hydraulic resistance:
� = ��[(� − ℎ�)− ��2] (3)
The peak occurs where dP/dQ=0:
�� ��� = �[(� − ℎ�)− 3��2] = 0 (4) Thus, the flow corresponding to peak power generation, Qp, is:
�� =��−ℎ3�� (5)
Not surprisingly, more available head and less pipe resistance imply a larger peak power and flow at peak power production. The 95% confidence bands show that demand uncertainty can have a significant impact on revenue generation. The upper portion of Figure 2 shows the derived probability density function (pdf) of daily revenue for an average demand of 0.1 m3/s. Thus, while revenue could swing as widely as $38-72/day, it will more likely fall in the $50/day range. A basic sensitivity analysis would not convey this likelihood even if it does reveal the feasibility of the turbine at the revenue extremes.
5 Demand growth
Since the deployment of a microturbine is a multi-year project, and given that flow through the system is the dominant factor influencing power generation and revenue, changes in demand over time should be considered. Figure 2 captures some aspect of this by showing how a range of demands impacts this system’s performance. It does not, however, indicate when these
demands will occur or whether they follow any reasonable growth pattern for the time horizon of the project.
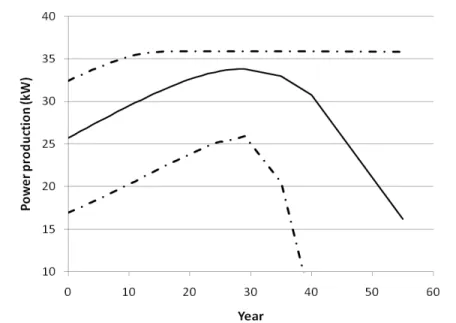
Figure 3 illustrates anticipated power generation capacity for the same system with the following assumptions. Demand is normally distributed with standard deviation σ=0.02 and year zero mean μ=0.1. Demand annual growth is assumed to be random with a triangular distribution
(min=1.5%, max=2.5% and mode=2.0%) The solid curve in Figure 3 shows the daily generated power trajectory through time and the dashed curves indicate the 95%-confidence interval.
Figure 3. Daily power generation as a function of time with 95%-confidence interval.
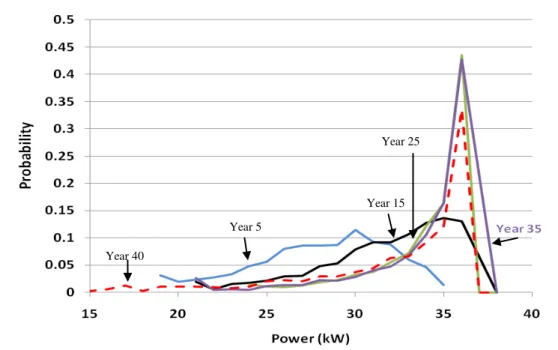
Snapshots of the pdf of power production are shown in Figure 4 for years 5, 15, 25, 35 and 40 to demonstrate how they become more peaked and right-skewed towards years of peak production. Overall project return
Reliable and comprehensive cost data are not currently easy to find since there are relatively few providers of microturbines suitable for water distribution network installation and cost
6
Figure 4. Derived probability density functions for daily power productions according to year.
information is closely linked to the specific application context. Nonetheless, there are some general estimates. One Electrochemical Science and Technology Information Resource (ESTIR) estimates micro-hydropower (<100 kW) turnkey cost at 1,500-6000 €/kW (ESTIR, 2002). McNabola et al., (2011) indicate a capital cost range of €100,000 to €140,000 for a 100kW micro-hydropower plant. One American supplier and installer of microturbines indicates a capital/installation cost range of $3.50-7.00/Watt, depending on the capacity of the unit and suggests a conservative estimate of annual maintenance costs of $2000 (Zammataro, 2011). Larger units are priced closer to $3.50/W while smaller units of around 30 kW-output (similar to the turbine considered here) cost about $7/Watt. This capital cost includes design, construction, installation and commissioning.
For the purpose of this study, $7/W is used as a turnkey capital cost estimate for the turbine and $2,000/year as a maintenance cost. As seen in Figure 2, the maximum power output that might be expected from this turbine for this system is 36 kW. Thus, a turnkey capital cost of $280,000, based on 40 kW capacity, is used here. Coupled with yearly maintenance of $2,000, the present worth of costs over the 30-year planning horizon at 3% discount rate is $320,000.
The system described earlier (whose characteristics are illustrated in Figures 2 and 3) yielded a mean present value of project revenue of $460,000 (with a minimum of $228,000-and maximum
Year 25
Year 5
Year 15
7
of $539,000) over a 30-year horizon, as illustrated in Figure 5. The probability of the project generating (discounted) net positive earnings over a 30 year planning period is better than 97%. Figure 6 illustrates the probability density of the discounted payback period, with a mean of approximately 15 years and 95% interval of approximately [12, 21] years.
.
Figure 5. Distribution of NPV of revenue (PV of capital and operating costs indicated).
Figure 6. pdf of payback period
Present value of costs
8 Role of the diurnal cycle
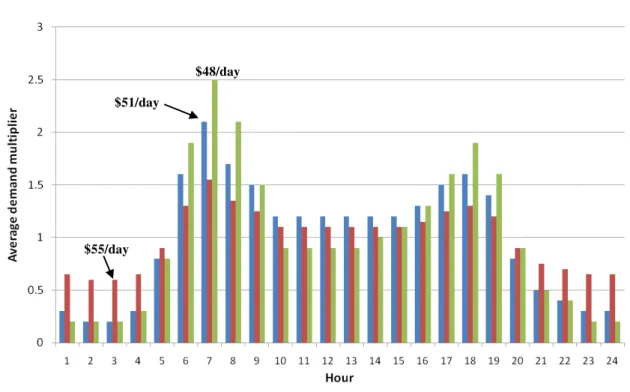
As discussed earlier, demand perturbations can have a substantial impact on power generation capacity. In this section, the impact of diurnal demand cycle is explored. Figure 7 illustrates three diurnal patterns, each producing an average demand of 0.1 m3/s for the day. The patterns loosely represent service areas of different populations with the premise being that smaller customer bases exhibit wider demand fluctuations about the average daily value. Thus, a diurnal pattern with a peak-to-average ratio of 1.5 might typify a larger community (e.g., an entire small town), while a ratio of 2.5 could represent a single subdivision or cluster of subdivisions. Daily revenues for these patters were computed and compared with the daily revenue assuming
constant average demand throughout the day (i.e., 0.1 m3/s all 24 hours of the day). For patterns with a peak-to-average ratio of 1.5, 2.1 and 2.5, the daily revenues were $55, 51 and 48/day, respectively, representing 4%, 12% and 16% lower revenue than the $57/day obtained using the average demand for all 24 hours. These results clearly demonstrate that diurnal, and possibly also seasonal, demand fluctuations should be considered in a comprehensive analysis.
Figure 7. Diurnal demand patterns (all with daily average of 0.1 m3/s). $55/day
$48/day $51/day
9 Conclusions
As found by other authors, there are situations where microturbines could present a financially viable alternative to PRVs. System demand is the dominant factor that governs the viability of micro-turbines (provided there is sufficient head to dissipate) and therefore should be properly considered. As demand is always uncertain, a probabilistic framework is prudent to propagate these uncertainties into the calculations in order to obtain more robust results. While average parameters are helpful in energy calculations, diurnal demand pattern has been demonstrated to have an impact on project return. Additional issues that have not been covered here but may be important to consider include variable power tariffs (subsidies) and the role of
pressure-dependent demand (including leakage). Acknowledgements
The authors wish to thank Frank Zammataro and Rentricity for information regarding turbine costs.
References
Giugni, M., Fontana, N and D. Portolano. (2009). “Energy saving policy in water distribution networks.” International Conference on Renewable Energies and Power Quality, Valencia, Spain, 15-17 April, 2009.
Hart, V. and C. Crotwell. (2009). “Stop the burn: Utilizing energy recovery via regenerative turbines.” Research Solutions (Spring 2009), 4-5, Carollo Engineers.
McNabola, A., Coughlan, P. and A.P. Williams. (2011). “The technical and economic feasibility of energy recovery in water supply networks.” International Conference on Renewable Energy and Power Quality (ICREPQ 2011), Las Palmas, Grand Canary Island, April 13-15, 2011. Tozzi, J. (2011). “Rentricity Powers Cities Using Pressure in Water Mains”. Bloomberg News, June 29, 2011. Retrieved September 2, 2011: http://www.bloomberg.com/news/2011-06-29/rentricity-uses-pressure-in-city-pipes-to-make-electricity.html
Vieira, F. and Ramos, H. (2009). “Optimization of operational planning for wind/hydro hybrid water supply systems.” Renewable Energy, 34(2009) 928-936.
![Figure 6 illustrates the probability density of the discounted payback period, with a mean of approximately 15 years and 95% interval of approximately [12, 21] years](https://thumb-eu.123doks.com/thumbv2/123doknet/14129617.468909/10.918.220.714.243.588/figure-illustrates-probability-density-discounted-approximately-interval-approximately.webp)