HAL Id: hal-02883980
https://hal.inrae.fr/hal-02883980
Submitted on 29 Jun 2020
HAL is a multi-disciplinary open access
archive for the deposit and dissemination of
sci-entific research documents, whether they are
pub-lished or not. The documents may come from
teaching and research institutions in France or
abroad, or from public or private research centers.
L’archive ouverte pluridisciplinaire HAL, est
destinée au dépôt et à la diffusion de documents
scientifiques de niveau recherche, publiés ou non,
émanant des établissements d’enseignement et de
recherche français ou étrangers, des laboratoires
publics ou privés.
tree flora
Hans ter Steege, Paulo Prado, Renato de Lima, Edwin Pos, Diogenes de
Andrade, Lima Filho, Rafael Salomão, Ieda Amaral, Francisca Dionizia de
Almeida Matos, Carolina Castilho, et al.
To cite this version:
Hans ter Steege, Paulo Prado, Renato de Lima, Edwin Pos, Diogenes de Andrade, et al..
Biased-corrected richness estimates for the Amazonian tree flora. Scientific Reports, Nature Publishing
Group, 2020, 10, pp.10130. �10.1038/s41598-020-66686-3�. �hal-02883980�
Biased-corrected richness
estimates for the Amazonian tree
flora
Hans ter Steege
1,2✉, Paulo I. prado
3✉, Renato A. F. de Lima
1,3, Edwin pos
4, Luiz de
Souza Coelho
5, Diogenes de Andrade Lima Filho
5, Rafael P. Salomão
6,7, Iêda Leão Amaral
5,
Francisca Dionízia de Almeida Matos
5, Carolina V. Castilho
8, Oliver L. phillips
9,
Juan Ernesto Guevara
10,11, Marcelo de Jesus Veiga carim
12, Dairon Cárdenas López
13,
William E. Magnusson
14, Florian Wittmann
15,16, Maria Pires Martins
5, Daniel Sabatier
17,
Mariana Victória Irume
5, José Renan da Silva Guimarães
12, Jean-François Molino
17,
Olaf S. Bánki
1, Maria Teresa Fernandez piedade
18, Nigel C. A. pitman
19, José Ferreira Ramos
5,
Abel Monteagudo Mendoza
20, Eduardo Martins Venticinque
21, Bruno Garcia Luize
22,
percy Núñez Vargas
23, Thiago Sanna Freire Silva
24, Evlyn Márcia Moraes de Leão Novo
25,
neidiane farias costa Reis
26, John terborgh
27,28, Angelo Gilberto Manzatto
29,
Katia Regina Casula
26, Euridice N. Honorio coronado
9,30, Juan Carlos Montero
5,31,
Alvaro Duque
32, Flávia R. C. costa
5, Nicolás castaño Arboleda
13, Jochen Schöngart
18,
Charles Eugene Zartman
5, Timothy J. Killeen
33, Beatriz S. Marimon
34, Ben Hur
Marimon-Junior
34, Rodolfo Vasquez
20, Bonifacio Mostacedo
35, Layon O. Demarchi
18,
Ted R. Feldpausch
9,36, Julien Engel
17,37, Pascal petronelli
38, Chris Baraloto
37, Rafael L. Assis
39,
Hernán Castellanos
40, Marcelo Fragomeni Simon
41, Marcelo Brilhante de Medeiros
41,
Adriano Quaresma
18, Susan G. W. Laurance
28, Lorena M. Rincón
5, Ana Andrade
42,
Thaiane R. Sousa
5, José Luís camargo
42, Juliana Schietti
5, William F. Laurance
28,
Helder Lima de Queiroz
43, Henrique Eduardo Mendonça nascimento
5,
Maria Aparecida Lopes
44, Emanuelle de Sousa farias
45,46, José Leonardo Lima Magalhães
47,48,
Roel Brienen
9, Gerardo A. Aymard C.
49, Juan David Cardenas Revilla
5,
Ima Célia Guimarães Vieira
7, Bruno Barçante Ladvocat cintra
50, Pablo R. Stevenson
51,
Yuri Oliveira feitosa
52, Joost F. Duivenvoorden
53, Hugo F. Mogollón
54, Alejandro
Araujo-Murakami
55, Leandro Valle ferreira
7, José Rafael Lozada
56, James A. comiskey
57,58,
José Julio de Toledo
59, Gabriel Damasco
60, Nállarett Dávila
61, Aline Lopes
18,62,
Roosevelt García-Villacorta
63,64, Freddie Draper
37,65, Alberto Vicentini
14, Fernando Cornejo
Valverde
66, Jon Lloyd
67, Vitor H. F. Gomes
68,69, David neill
70, Alfonso Alonso
58,
francisco Dallmeier
58, Fernanda Coelho de Souza
9,14, Rogerio Gribel
5, Luzmila Arroyo
55,
Fernanda Antunes Carvalho
14,71, Daniel Praia Portela de Aguiar
18, Dário Dantas do Amaral
7,
Marcelo Petratti pansonato
3,5, Kenneth J. Feeley
72,73, Erika Berenguer
74,75, Paul V. A. fine
60,
Marcelino Carneiro Guedes
76, Jos Barlow
75, Joice ferreira
48, Boris Villa
77,
Maria Cristina Peñuela Mora
78, Eliana M. Jimenez
79, Juan Carlos Licona
31, Carlos cerón
80,
Raquel thomas
81, Paul Maas
1, Marcos Silveira
82, Terry W. Henkel
83, Juliana Stropp
84,
Marcos Ríos paredes
85, Kyle G. Dexter
86,87, Doug Daly
88, Tim R. Baker
9, Isau
Huamantupa-Chuquimaco
23, William Milliken
89, Toby pennington
36,87, J. Sebastián Tello
90,
José Luis Marcelo pena
91, Carlos A. peres
92, Bente Klitgaard
93, Alfredo Fuentes
90,94,
Miles R. Silman
95, Anthony Di fiore
96, Patricio von Hildebrand
97, Jerome Chave
98,
Tinde R. van Andel
1,99, Renato Richard Hilário
59, Juan Fernando Phillips
100, Gonzalo
Rivas-torres
101,102, Janaína Costa noronha
103, Adriana prieto
104, Therany Gonzales
105,
Rainiellene de Sá Carpanedo
103, George Pepe Gallardo Gonzales
85, Ricardo Zárate Gómez
106,
Domingos de Jesus Rodrigues
103, Egleé L. Zent
107, Ademir R. Ruschel
48,
Vincent Antoine Vos
108, Émile fonty
17,109, André Braga Junqueira
110,
Hilda Paulette Dávila Doza
85, Bruce Hoffman
111, Stanford Zent
107,
Edelcilio Marques Barbosa
5, Yadvinder Malhi
112, Luiz Carlos de Matos Bonates
5, Ires Paula de
Andrade Miranda
5, Natalino Silva
113, Flávia Rodrigues Barbosa
103, César I. A. Vela
114,
Linder Felipe Mozombite pinto
85, Agustín Rudas
104, Bianca Weiss Albuquerque
18,
Maria Natalia Umaña
115, Yrma Andreina Carrero Márquez
56, Geertje van der Heijden
116,
Kenneth R. Young
117, Milton tirado
118, Diego F. correa
51,119, Rodrigo Sierra
118,
Janaina Barbosa pedrosa costa
76, Maira Rocha
18, Emilio Vilanova Torre
120,121,
Ophelia Wang
122, Alexandre A. Oliveira
3, Michelle Kalamandeen
9,123, Corine Vriesendorp
19,
Hirma Ramirez-Angulo
120, Milena Holmgren
124, Marcelo Trindade nascimento
125,
David Galbraith
9, Bernardo Monteiro Flores
126, Veridiana Vizoni Scudeller
127,
Angela cano
51,128, Manuel Augusto Ahuite Reategui
129, Italo Mesones
60, Cláudia Baider
3,130,
casimiro Mendoza
131,132, Roderick Zagt
133, Ligia Estela Urrego Giraldo
32, Cid ferreira
5,
Daniel Villarroel
55, Reynaldo Linares-Palomino
58, William farfan-Rios
90,134, William
farfan-Rios
23, Luisa Fernanda casas
51, Sasha cárdenas
51, Henrik Balslev
135, Armando
torres-Lezama
120, Miguel N. Alexiades
136, Karina Garcia-cabrera
95, Luis Valenzuela Gamarra
20,
Elvis H. Valderrama Sandoval
137,138, Freddy Ramirez Arevalo
138, Lionel Hernandez
40,
Adeilza Felipe Sampaio
26, Susamar pansini
26, Walter Palacios Cuenca
139,
Edmar Almeida de Oliveira
34, Daniela Pauletto
140, Aurora Levesley
9, Karina Melgaço
9&
Georgia Pickavance
91Naturalis Biodiversity Center, PO Box 9517, Leiden, 2300 RA, The Netherlands. 2Systems Ecology, Vrije Universiteit
Amsterdam, De Boelelaan 1087, Amsterdam, 1081 HV, The Netherlands. 3Instituto de Biociências - Dept. Ecologia,
Universidade de Sao Paulo - USP, Rua do Matão, Trav. 14, no. 321, Cidade Universitária, São Paulo, SP, 05508-090, Brazil. 4Ecology & Biodiversity Group, Utrecht University, Padualaan 8, Utrecht, 3584 CH, The Netherlands. 5Coordenação de Biodiversidade, Instituto Nacional de Pesquisas da Amazônia - INPA, Av. André Araújo, 2936,
Petrópolis, Manaus, AM, 69067-375, Brazil. 6Programa Professor Visitante Nacional Sênior na Amazônia - CAPES,
Universidade Federal Rural da Amazônia, Av. Perimetral, s/n, Belém, PA, Brazil. 7Coordenação de Botânica, Museu
Paraense Emílio Goeldi, Av. Magalhães Barata 376, C.P. 399, Belém, PA, 66040-170, Brazil. 8EMBRAPA – Centro de
Pesquisa Agroflorestal de Roraima, BR 174, km 8 – Distrito Industrial, Boa Vista, RR, 69301-970, Brazil. 9School of
Geography, University of Leeds, Woodhouse Lane, Leeds, LS2 9JT, UK. 10Grupo de Investigación en Biodiversidad,
Medio Ambiente y Salud-BIOMAS, Universidad de las Américas, Campus Queri, Quito, Ecuador. 11Keller Science
Action Center, The Field Museum, 1400 S. Lake Shore Drive, Chicago, IL, 60605-2496, USA. 12Departamento de
Botânica, Instituto de Pesquisas Científicas e Tecnológicas do Amapá - IEPA, Rodovia JK, Km 10, Campus do IEPA da Fazendinha, Amapá, 68901-025, Brazil. 13Herbario Amazónico Colombiano, Instituto SINCHI, Calle 20 No 5-44,
Bogotá, DC, Colombia. 14Coordenação de Pesquisas em Ecologia, Instituto Nacional de Pesquisas da Amazônia -
INPA, Av. André Araújo, 2936, Petrópolis, Manaus, AM, 69067-375, Brazil. 15Dep. of Wetland Ecology, Institute of
Geography and Geoecology, Karlsruhe Institute of Technology - KIT, Josefstr.1, Rastatt, D-76437, Germany.
16Biogeochemistry, Max Planck Institute for Chemistry, Hahn-Meitner Weg 1, Mainz, 55128, Germany. 17AMAP, IRD,
Cirad, CNRS, INRA, Université de Montpellier, Montpellier, F-34398, France. 18Coordenação de Dinâmica Ambiental,
Instituto Nacional de Pesquisas da Amazônia - INPA, Av. André Araújo, 2936, Petrópolis, Manaus, AM, 69067-375, Brazil. 19Science and Education, The Field Museum, 1400 S. Lake Shore Drive, Chicago, IL, 60605-2496, USA. 20Jardín
Botánico de Missouri, Oxapampa, Pasco, Peru. 21Centro de Biociências, Departamento de Ecologia, Universidade
Federal do Rio Grande do Norte, Av. Senador Salgado Filho, 3000, Natal, RN, 59072-970, Brazil. 22Departamento de
Ecologia, Universidade Estadual Paulista - UNESP – Instituto de Biociências – IB, Av. 24 A, 1515, Bela Vista, Rio Claro, SP, 13506-900, Brazil. 23Herbario Vargas, Universidad Nacional de San Antonio Abad del Cusco, Avenida de la Cultura,
Nro 733, Cusco, Cuzco, Peru. 24Biological and Environmental Sciences, University of Stirling, Stirling, FK9 4LA, UK. 25Divisao de Sensoriamento Remoto – DSR, Instituto Nacional de Pesquisas Espaciais – INPE, Av. dos Astronautas,
1758, Jardim da Granja, São José dos Campos, SP, 12227-010, Brazil. 26Programa de Pós- Graduação em
Biodiversidade e Biotecnologia PPG- Bionorte, Universidade Federal de Rondônia, Campus Porto Velho Km 9,5 bairro Rural, Porto Velho, RO, 76.824-027, Brazil. 27Department of Biology and Florida Museum of Natural History,
University of Florida, Gainesville, FL, 32611, USA. 28Centre for Tropical Environmental and Sustainability Science and
College of Science and Engineering, James Cook University, Cairns, Queensland, 4870, Australia. 29Departamento de
Biologia, Universidade Federal de Rondônia, Rodovia BR 364 s/n Km 9,5 - Sentido Acre, Unir, Porto Velho, RO, 76.824-027, Brazil. 30Instituto de Investigaciones de la Amazonía Peruana (IIAP), Av. A. Quiñones km 2,5, Iquitos,
Loreto, 784, Peru. 31Instituto Boliviano de Investigacion Forestal, Av. 6 de agosto #28, Km. 14, Doble via La Guardia,
Casilla 6204, Santa Cruz, Santa Cruz, Bolivia. 32Departamento de Ciencias Forestales, Universidad Nacional de
Colombia, Calle 64 x Cra 65, Medellín, Antioquia, 1027, Colombia. 33Agteca-Amazonica, Santa Cruz, Bolivia. 34Programa de Pós-Graduação em Ecologia e Conservação, Universidade do Estado de Mato Grosso, Nova Xavantina,
MT, Brazil. 35Facultad de Ciencias Agrícolas, Universidad Autónoma Gabriel René Moreno, Santa Cruz, Santa Cruz,
Bolivia. 36Geography, College of Life and Environmental Sciences, University of Exeter, Rennes Drive, Exeter, EX4
4RJ, UK. 37International Center for Tropical Botany (ICTB) Department of Biological Sciences, Florida International
University, 11200 SW 8th Street, OE 243, Miami, FL, 33199, USA. 38Cirad UMR Ecofog,
Museum, University of Oslo, Postboks 1172, Oslo, 0318, Norway. 40Centro de Investigaciones Ecológicas de Guayana,
Universidad Nacional Experimental de Guayana, Calle Chile, urbaniz Chilemex, Puerto Ordaz, Bolivar, Venezuela.
41Prédio da Botânica e Ecologia, Embrapa Recursos Genéticos e Biotecnologia, Parque Estação Biológica, Av. W5
Norte, Brasilia, DF, 70770-917, Brazil. 42Projeto Dinâmica Biológica de Fragmentos Florestais, Instituto Nacional de
Pesquisas da Amazônia - INPA, Av. André Araújo, 2936, Petrópolis, Manaus, AM, 69067-375, Brazil. 43Diretoria
Técnico-Científica, Instituto de Desenvolvimento Sustentável Mamirauá, Estrada do Bexiga, 2584, Tefé, AM, 69470-000, Brazil. 44Instituto de Ciências Biológicas, Universidade Federal do Pará, Av. Augusto Corrêa 01, Belém, PA,
66075-110, Brazil. 45Laboratório de Ecologia de Doenças Transmissíveis da Amazônia (EDTA), Instituto Leônidas e
Maria Deane, Fiocruz, Rua Terezina, 476, Adrianópolis, Manaus, AM, 69060-001, Brazil. 46Programa de
Pós-graduação em Biodiversidade e Saúde, Instituto Oswaldo Cruz - IOC/FIOCRUZ, Pav. Arthur Neiva – Térreo, Av. Brasil, 4365 – Manguinhos, Rio de Janeiro, RJ, 21040-360, Brazil. 47Programa de Pós-Graduação em Ecologia, Universidade
Federal do Pará, Av. Augusto Corrêa 01, Belém, PA, 66075-110, Brazil. 48Embrapa Amazônia Oriental, Trav. Dr. Enéas
Pinheiro s/n°, Belém, PA, 66095-100, Brazil. 49Programa de Ciencias del Agro y el Mar, Herbario Universitario (PORT),
UNELLEZ-Guanare, Guanare, Portuguesa, 3350, Venezuela. 50Instituto de Biociências - Dept. Botanica, Universidade
de Sao Paulo - USP, Rua do Matão 277, Cidade Universitária, São Paulo, SP, 05508-090, Brazil. 51Laboratorio de
Ecología de Bosques Tropicales y Primatología, Universidad de los Andes, Carrera 1 # 18a- 10, Bogotá, DC, 111711, Colombia. 52Programa de Pós-Graduação em Biologia (Botânica), Instituto Nacional de Pesquisas da Amazônia -
INPA, Av. André Araújo, 2936, Petrópolis, Manaus, AM, 69067-375, Brazil. 53Institute of Biodiversity and Ecosystem
Dynamics, University of Amsterdam, Sciencepark 904, Amsterdam, 1098 XH, The Netherlands. 54Endangered
Species Coalition, 8530 Geren Rd., Silver Spring, MD, 20901, USA. 55Museo de Historia Natural Noel Kempff
Mercado, Universidad Autónoma Gabriel Rene Moreno, Avenida Irala 565 Casilla Post al 2489, Santa Cruz, Santa Cruz, Bolivia. 56Facultad de Ciencias Forestales y Ambientales, Instituto de Investigaciones para el Desarrollo
Forestal, Universidad de los Andes, Via Chorros de Milla, 5101, Mérida, Mérida, Venezuela. 57Inventory and
Monitoring Program, National Park Service, 120 Chatham Lane, Fredericksburg, VA, 22405, USA. 58Center for
Conservation and Sustainability, Smithsonian Conservation Biology Institute, 1100 Jefferson Dr. SW, Suite 3123, Washington, DC, 20560-0705, USA. 59Universidade Federal do Amapá, Ciências Ambientais, Rod. Juscelino
Kubitschek km2, Macapá, AP, 68902-280, Brazil. 60Department of Integrative Biology, University of California,
Berkeley, CA, 94720-3140, USA. 61Biologia Vegetal, Universidade Estadual de Campinas, Caixa Postal 6109,
Campinas, SP, 13.083-970, Brazil. 62Department of Ecology, University of Brasilia, Brasilia, DF, 70904-970, Brazil. 63Department of Ecology and Evolutionary Biology, Cornell University, Corson Hall, 215 Tower Road, Ithaca, NY,
14850, USA. 64Peruvian Center for Biodiversity and Conservation (PCBC), Iquitos, Peru. 65Department of Global
Ecology, Carnegie Institution for Science, 260 Panama St., Stanford, CA, 94305, USA. 66Andes to Amazon Biodiversity
Program, Madre de Dios, Madre de Dios, Peru. 67Faculty of Natural Sciences, Department of Life Sciences, Imperial
College London, Silwood Park, South Kensington Campus, London, SW7 2AZ, UK. 68Escola de Negócios Tecnologia
e Inovação, Centro Universitário do Pará, Belém, PA, Brazil. 69Universidade Federal do Pará, Rua Augusto Corrêa 01,
Belém, PA, 66075-110, Brazil. 70Ecosistemas, Biodiversidad y Conservación de Especies, Universidad Estatal
Amazónica, Km. 2 1/2 vía a Tena (Paso Lateral), Puyo, Pastaza, Ecuador. 71Universidade Federal de Minas Gerais,
Instituto de Ciências Biológicas, Departamento de Genética, Ecologia e Evolução, Av. Antônio Carlos, 6627 Pampulha, Belo Horizonte, MG, 31270-901, Brazil. 72Department of Biology, University of Miami, Coral Gables, FL,
33146, USA. 73Fairchild Tropical Botanic Garden, Coral Gables, FL, 33156, USA. 74Environmental Change Institute,
University of Oxford, Oxford, Oxfordshire, OX1 3QY, UK. 75Lancaster Environment Centre, Lancaster University,
Lancaster, Lancashire, LA1 4YQ, UK. 76Empresa Brasileira de Pesquisa Agropecuária, Embrapa Amapá, Rod.
Juscelino Kubitschek km 5, Macapá, Amapá, 68903-419, Brazil. 77Direccíon de Evaluación Forestal y de Fauna
Silvestre, Av. Javier Praod Oeste 693, Magdalena del Mar, Peru. 78Universidad Regional Amazónica IKIAM, Km 7 via
Muyuna, Tena, Napo, Ecuador. 79Grupo de Ecología y Conservación de Fauna y Flora Silvestre, Instituto Amazónico
de Investigaciones Imani, Universidad Nacional de Colombia sede Amazonia, Leticia, Amazonas, Colombia. 80Escuela
de Biología Herbario Alfredo Paredes, Universidad Central, Ap. Postal 17.01.2177, Quito, Pichincha, Ecuador.
81Iwokrama International Centre for Rain Forest Conservation and Development, Georgetown, Guyana. 82Museu
Universitário/Centro de Ciências Biológicas e da Natureza/Laboratório de Botânica e Ecologia Vegetal, Universidade Federal do Acre, Rio Branco, AC, 69915-559, Brazil. 83Department of Biological Sciences, Humboldt State University,
1 Harpst Street, Arcata, CA, 95521, USA. 84Institute of Biological and Health Sciences, Federal University of Alagoas,
Av. Lourival Melo Mota, s/n, Tabuleiro do Martins, Maceio, AL, 57072-970, Brazil. 85Servicios de Biodiversidad EIRL,
Jr. Independencia 405, Iquitos, Loreto, 784, Peru. 86School of Geosciences, University of Edinburgh, 201 Crew
Building, King’s Buildings, Edinburgh, EH9 3JN, UK. 87Tropical Diversity Section, Royal Botanic Garden Edinburgh,
20a Inverleith Row, Edinburgh, Scotland, EH3 5LR, UK. 88New York Botanical Garden, 2900 Southern Blvd, Bronx,
New York, NY, 10458-5126, USA. 89Natural Capital and Plant Health, Royal Botanic Gardens, Kew, Richmond, Surrey,
TW9 3AB, UK. 90Center for Conservation and Sustainable Development, Missouri Botanical Garden, P.O. Box 299, St.
Louis, MO, 63166-0299, USA. 91Universidad Nacional de Jaén, Carretera Jaén San Ignacio Km 23, Jaén, Cajamarca,
06801, Peru. 92School of Environmental Sciences, University of East Anglia, Norwich, NR4 7TJ, UK. 93Department for
Identification & Naming, Royal Botanic Gardens, Kew, Richmond, Surrey, TW9 3AB, UK. 94Herbario Nacional de
Bolivia, Universitario UMSA, Casilla 10077 Correo Central, La Paz, La Paz, Bolivia. 95Biology Department and Center
for Energy, Environment and Sustainability, Wake Forest University, 1834 Wake Forest Rd, Winston Salem, NC, 27106, USA. 96Department of Anthropology, University of Texas at Austin, SAC 5.150, 2201 Speedway Stop C3200,
Austin, TX, 78712, USA. 97Fundación Estación de Biología, Cra 10 No. 24-76 Oficina 1201, Bogotá, DC, Colombia. 98Laboratoire Evolution et Diversité Biologique, CNRS and Université Paul Sabatier, UMR 5174 EDB, Toulouse,
31000, France. 99Biosystematics group, Wageningen University, Droevendaalsesteeg 1, Wageningen, 6708 PB, The
Netherlands. 100Fundación Puerto Rastrojo, Cra 10 No. 24-76 Oficina 1201, Bogotá, DC, Colombia. 101Colegio de
Ciencias Biológicas y Ambientales-COCIBA & Galapagos Institute for the Arts and Sciences-GAIAS, Universidad San Francisco de Quito-USFQ, Quito, Pichincha, Ecuador. 102Department of Wildlife Ecology and Conservation, University
Amazonian forests are extraordinarily diverse, but the estimated species richness is very much debated. Here, we apply an ensemble of parametric estimators and a novel technique that includes conspecific spatial aggregation to an extended database of forest plots with up-to-date taxonomy. We show that the species abundance distribution of Amazonia is best approximated by a logseries with aggregated individuals, where aggregation increases with rarity. By averaging several methods to estimate total richness, we confirm that over 15,000 tree species are expected to occur in Amazonia. We also show that using ten times the number of plots would result in an increase to just ~50% of those 15,000 estimated species. To get a more complete sample of all tree species, rigorous field campaigns may be needed but the number of trees in Amazonia will remain an estimate for years to come.
The lowland rainforest of the Amazon River basin and Guiana Shield, hereafter Amazonia, covers an area of nearly 6 million km2 with an estimated total number of 3.9 × 10¹¹ trees (diameter at 1.30 m - dbh ≥ 10 cm)1.
Sampling such an extensive area has been extremely limited, and accurate estimates of the total number of tree species and their populations have thus been difficult to obtain1. Nevertheless, these estimates are important to
understand the difference between what we already know and what still needs to be discovered about Amazonian tree diversity. In 2013, we estimated that around 16,000 tree species should occur within Amazonia1 using the
distribution of estimated total abundances of all tree species occurring in 1,170 forest plots scattered across the area. A number that has both been criticized2–4 and accepted as plausible for plot inventories5. In the following
years there has been considerable progress both in the taxonomy of Amazonian tree species4,6–8 and the number
of forest inventory plots available9, which has steadily grown from 1,170 to 1,946. In addition, our previous
rich-ness estimate was based on a single estimation method, the linear extension of a hypothetical logseries10 of the
estimated population sizes of the Amazonian tree species present in our plots1.
While the logseries fits the relative abundance distribution of many taxa quite well11, others have recently
argued that it tends to overestimate richness and that other models such as the negative binomial would provide
of Florida, 110 Newins-Ziegler Hall, Gainesville, FL, 32611, USA. 103ICNHS, Federal University of Mato Grosso, Av.
Alexandre Ferronato 1200, Setor Industrial, Sinop, MT, 78.557-267, Brazil. 104Instituto de Ciencias Naturales,
Universidad Nacional de Colombia, Apartado 7945, Bogotá, DC, Colombia. 105ACEER Foundation, Jirón Cusco N°
370, Puerto Maldonado, Madre de Dios, Peru. 106PROTERRA, Instituto de Investigaciones de la Amazonía Peruana
(IIAP), Av. A. Quiñones km 2,5, Iquitos, Loreto, 784, Peru. 107Laboratory of Human Ecology, Instituto Venezolano de
Investigaciones Científicas - IVIC, Ado 20632, Caracas, DC, 1020 A, Venezuela. 108Universidad Autónoma del Beni
José Ballivián, Campus Universitario Final, Av. Ejercito, Riberalta, Beni, Bolivia. 109Direction régionale de la Guyane,
ONF, Cayenne, F-97300, French Guiana. 110Institut de Ciència i Tecnologia Ambientals, Universitat Autònoma de
Barcelona, 08193, Bellaterra, Barcelona, Spain. 111Amazon Conservation Team, Doekhieweg Oost #24, Paramaribo,
Suriname. 112Environmental Change Institute, Oxford University Centre for the Environment, Dyson Perrins Building,
South Parks Road, Oxford, England, OX1 3QY, UK. 113Instituto de Ciência Agrárias, Universidade Federal Rural da
Amazônia, Av. Presidente Tancredo Neves 2501, Belém, PA, 66.077-830, Brazil. 114Escuela Profesional de Ingeniería
Forestal, Universidad Nacional de San Antonio Abad del Cusco, Jirón San Martín 451, Puerto Maldonado, Madre de Dios, Peru. 115Department of Ecology and Evolutionary Biology, University of Michigan, Ann Arbor, MI, 48109, USA. 116University of Nottingham, University Park, Nottingham, NG7 2RD, UK. 117Geography and the Environment,
University of Texas at Austin, 305 E. 23rd Street, CLA building, Austin, TX, 78712, USA. 118GeoIS, El Día 369 y El
Telégrafo, 3° Piso, Quito, Pichincha, Ecuador. 119School of Agriculture and Food Sciences - ARC Centre of Excellence
for Environmental Decisions CEED, The University of Queensland, St. Lucia, QLD, 4072, Australia. 120Instituto de
Investigaciones para el Desarrollo Forestal (INDEFOR), Universidad de los Andes, Conjunto Forestal, 5101, Mérida, Mérida, Venezuela. 121School of Environmental and Forest Sciences, University of Washington, Seattle, WA, USA. 122Environmental Science and Policy, Northern Arizona University, Flagstaff, AZ, 86011, USA. 123Laurentian
University, 935 Ramsey Lake Road, Sudbury, Ontario, P3E 2C6, Canada. 124Resource Ecology Group, Wageningen
University & Research, Droevendaalsesteeg 3a, Lumen, building number 100, Wageningen, Gelderland, 6708 PB, The Netherlands. 125Laboratório de Ciências Ambientais, Universidade Estadual do Norte Fluminense, Av. Alberto
Lamego 2000, Campos dos Goyatacazes, RJ, 28013-620, Brazil. 126University of Campinas, Plant Biology
Department, Rua Monteiro Lobato, 255, Cidade Universitária Zeferino Vaz, Barão Geraldo, Campinas, São Paulo, CEP, 13083-862, Brazil. 127Departamento de Biologia, Universidade Federal do Amazonas - UFAM – Instituto de
Ciências Biológicas – ICB1, Av General Rodrigo Octavio 6200, Manaus, AM, 69080-900, Brazil. 128Cambridge
University Botanic Garden, 1 Brookside, Cambridge, CB2 1JE, UK. 129Medio Ambiente, PLUSPRETOL, Iquitos,
Loreto, Peru. 130The Mauritius Herbarium, Agricultural Services, Ministry of Agro-Industry and Food Security, Reduit,
80835, Mauritius. 131Escuela de Ciencias Forestales (ESFOR), Universidad Mayor de San Simon (UMSS), Sacta,
Cochabamba, Bolivia. 132FOMABO, Manejo Forestal en las Tierras Tropicales de Bolivia, Sacta, Cochabamba, Bolivia. 133Tropenbos International, Lawickse Allee 11 PO Box 232, Wageningen, 6700 AE, The Netherlands. 134Living Earth
Collaborative, Washington University in Saint Louis, St. Louis, MO, 63130, USA. 135Department of Bioscience, Aarhus
University, Building 1540 Ny Munkegade, Aarhus C, Aarhus, DK, 8000, Denmark. 136School of Anthropology and
Conservation, University of Kent, Marlowe Building, Canterbury, Kent, CT2 7NR, UK. 137Department of Biology,
University of Missouri, St. Louis, MO, 63121, USA. 138Facultad de Biologia, Universidad Nacional de la Amazonia
Peruana, Pevas 5ta cdra, Iquitos, Loreto, Peru. 139Herbario Nacional del Ecuador, Universidad Técnica del Norte,
Quito, Pichincha, Ecuador. 140Instituto de Biodiversidade e Floresta, Universidade Federal do Oeste do Pará, Rua Vera
better estimates12. Other parametric methods, such as the Poisson lognormal13,14 have also been suggested to have
a better performance than the logseries when used to describe species relative abundances in Amazonian forest15.
Here we present a new species richness estimation of Amazonian tree species based on the revised taxon-omy and increased inventory dataset using various parametric estimation methods. Non-parametric methods4,16
continue to be used to estimate species richness but as they tend to hugely underestimate richness in sparsely sampled, species-rich areas6,17,18, such as Amazonia, we did not employ them here. All methods assume random
sampling of species with random distribution across space, conditions mostly not met in forest inventory data. Rather, limited dispersal and ecological preferences of trees tend to result in aggregated spatial patterns of species distribution19–21. Hence, conspecific aggregation at the sampling scale has also been pointed out as a source of
serious bias of parametric estimates of species richness12,21.
The new advances in species taxonomy, improved sampling coverage and richness estimation methods, dis-cussed above, allow us to provide an update on the estimated number of species in the Amazonian tree flora and their estimated population sizes, which are key to the understanding and conservation of the Amazonian tree diversity. Making use of the March 2019 Amazon Tree Diversity Network (ATDN) database, an improved Amazon lowland forest map22, and an updated taxonomy4,8, we provide new estimates of the (i) population sizes
for each species and (ii) total species richness of the Amazonian tree flora. We provide species richness estimates using parametric methods based on the logseries (LS), negative binomial (NB) and Poisson lognormal (PLN). For the first time, we use data on species occurrences across plots to assess the impacts of conspecific aggregation in the estimation of tree species richness in Amazonia. Based on the simulation of the sampling from a hypothetical species abundance distribution (SAD) for the Amazonian tree flora, we evaluate the accuracy of each estimation method and provide correction of biases in their estimates. Finally, we evaluate how robust the richness estimates of each method are to increases in the number of forest plots included in the sample and to changes in species taxonomy.
Results
Raw data description.
The 2019 version of the dataset (1,946 plots) contained a total of 1,101,368 individ-uals, 89% of which were identified to a valid species name (Supplementary Table 1). It contained a total of 5,027 tree species (Appendix 1), representing an increase of 63 observed species in comparison to the 2013 version (496 species, if the 2013 dataset would have used the current taxonomy – see also Appendix 2, 3). The total number of trees in Amazonia, based on the tree density modelling, was estimated at 3.06 ∙ 1011. The 10 most commonspe-cies were: Eschweilera coriacea, Euterpe precatoria, Oenocarpus bataua, Pseudolmedia laevis, Protium altissimum, Iriartea deltoidea, Mauritia flexuosa, Socratea exorrhiza, Astrocaryum murumuru, and Pentaclethra macroloba (species authorities follow ref. 8). Six of these species are palms (see Appendix 1 for the population estimates for
all species). Most of the hyperdominant species show only small changes in their estimated populations compared to 2013 and only small differences in rank.
Fitted models to empirical SADs.
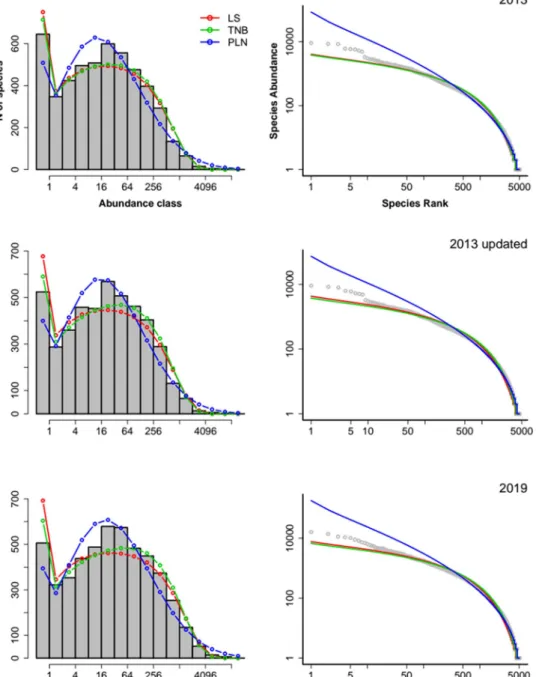
The truncated negative binomial (TNB) was the model with best fit to the empirical SADs for all versions of the data sets (Table 1, Supplementary Table 2) with the logseries providing an equally good fit for the 2013 dataset (Table 1, Supplementary Fig. 1), if we used AIC. Model selection with a Bayesian Information Criterion (BIC) had the same result, except by the best support of LS for the 2013 data set (Supplementary Table 3). Visually, the LS and TNB provided very similar fits, with both models underestimating the abundances of the most abundant species in the sample (Fig. 1). The PLN model had no support from the three data sets, overestimating the abundance of common species and underestimating the abundance of rare ones (Fig. 1).Estimated species richness.
The number of species estimated greatly depended on the method of estimation. The original estimates provided by each method, could differ by a factor three from one another (Supplementary Table 4, Supplementary Fig. 2). Because the PLN had little or no support from the data and provided richness estimates (5,649) that were much smaller than species already collected in Amazonia, this method was not further considered. The TNB estimate for the 2013 dataset was similar to those found by ref. 11. (13,602 ± 711, compared with 13,497 and range estimates of 14,324 – 12,448, Supplementary Fig. 2,Supplementary Table 4).
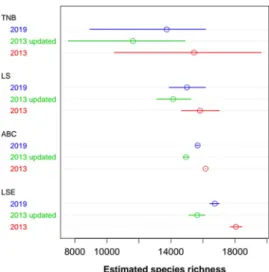
We found that conspecific aggregation introduced bias in the estimation of the species richness for the LS, TNB, and Logseries expansion method (LSE), resulting in an underestimation of the true species richness (Supplementary Table 4, Supplementary Fig. 3). Hence, the original richness estimates had to be corrected to pro-vide more accurate estimates of the richness. The TNB propro-vided the most discrepant and uncertain bias-corrected estimates, while the other methods provided comparable numbers (Fig. 2, Supplementary Fig. 4). This low pre-cision of corrected TNB estimates was caused by a non-linear relationship between estimated and true values (Supplementary Fig. 3a–c). Excluding TNB due to this low precision, the average of estimates for the 2019 data-set, weighted by the inverse of their standard errors, was 15,835 tree species for the Amazonian tree flora. As a conservative interval estimate, we can use the minimum and maximum of the range estimates, also excluding TNB: 13,887 to 17,020 species (Fig. 3). This weighted average estimate for the original 2013 data set was 16,243 (14,659–18,439) species, and 15,020 (13,095–16,136) species for the reviewed 2013 data set.
The LS model had no support in simulated samples drawn from logseries regional SADs with more than 10,000 species with clumping, but had a constant and high support in simulated samples without clumping (Supplementary Fig. 5). For simulated samples from a Negative Binomial regional SAD, the LS model had a poor support for communities with more than 10,000 species, irrespective of conspecific clumping. Thus, the conspe-cific clumping observed in our data sets causes a strong selection bias against LS, when this is the correct model, but does not cause selection bias for TNB. The best support of TNB provided by the abundances in the sample
could thus be an artefact. In fact, the approximate Bayesian Computation model selection showed that LS models had by far the largest posterior probabilities to approximate the distribution of total population sizes, for all three data sets (Table 2).
For all datasets, simulations of samples with conspecific clumping of a logseries regional SAD had the highest posterior Approximate Bayesian Computation (ABC) probabilities, and simulations of samples from a truncated negative binomial or a lognormal had very low or zero posterior probabilities (Table 2). We thus assumed the simulations of sampling of a logseries regional SAD with conspecific aggregation as the best approximation of the process that generated the ATDN data.
Impacts of sampling effort and species taxonomy.
Bias-corrected estimates of species richness, using conspecific aggregation fell between 13,730 (TNB) and 16,741 (LSE) species for the 2019 dataset, a variation of 22% (Fig. 2, Supplementary Table 4). Corresponding figures for the 2013 and updated 2013 data sets were 15,437 – 18,056 (TNB - LSE, 20%) and 11,618 – 15,643 (TNB - LSE, 35%) respectively. The taxonomic update of the 2013 data set led to a decrease in the number and abundance of rarer species (species below the median abundance ranking and with densities below to 2–5 individuals/ha in the sample, Supplementary Fig. 6). The same effect was observed in the distribution of abundances of estimated population sizes (Supplementary Fig. 7). As a conse-quence, the taxonomic update decreased the estimated number of species by all methods. This reduction ranged from –7.6% (ABC) to –24.8% (TNB). The expansion of inventory plots for the 2019 ATDN database increased the number and abundance of rarer species (Supplementary Figs. 6 and 7), which in turn partially reversed the decreasing of the estimated numbers of species (Fig. 2), increasing the estimated richness by 4.9% (ABC) to 18.1% (TNB). The sensitivity of the methods to taxonomic updates and to the expansion of the database followed same order: ABC < LS < LSE < TNB (Fig. 2). Overall, there was more variation of estimates among methods than among the versions of the database. The variance components of the point estimates were 52% for estimation methods and 38% for the data sets, with a residual component of 10%.Predicted richness with increasing sample sizes.
We predicted species richness for larger plot samples, using a logseries with 15,874 species, which was the average estimation of total species richness for Amazonia from the 2019 data set. Two other logseries with 13,887 and 17,020 species respectively, were used as the lower and upper bounds for the estimated number of species. The simulations predicted that on average 746 additional species would be recorded in the plots if the current sample size was doubled, an increase of 15% (lower and upper bounds: 247 – 1,317, or 5–26%, Fig. 4). The expected number species for the same sample size, assuming random dispersion of all species, can be estimated with equation S.3. Assuming a mean density of 528.5 trees ha-1 in Amazon that would amount to 6,110 species, or an increase of 22%. As expected, conspecific clumping, which is stronger for the rare species (Supplementary Fig. 8), decreases the rates of accumulation of species.If the number of plots was ten times the current sample size, the expected number of species in the plots would be 6,958 (an increase of 38%; lower and upper bounds: 6,517 – 7,884), getting close to half of the species estimated to be present in Amazonia.
Discussion
Our ability to estimate species richness ultimately depends on the capacity to accurately describe patterns of com-monness and rarity from samples of local communities and project it to a much larger sample size (see also ref. 18).
This is not a trivial challenge and it has been the subject of much empirical and theoretical study23. Here we used
nearly 2,000 forest inventory plots to estimate the total number of tree species for the entire Amazonian forest and compare it to earlier estimates1,4,12,22. Our first finding was that despite the updated taxonomy (i.e. reduction
of almost 10% of the species) and the addition of nearly 800 plots, the estimates of total species richness by each method were fairly similar. Updated point estimates using LSE and LS had a difference of -5% and 1.3% with our previous estimates1, and the updated estimate using the TNB had a difference of only 0.9% with previous
esti-mates12. Such a small variation was the outcome of the well-known increase of number of species recorded as new
plots were added to the sample, compensating the reduction of species by the taxonomic updating. Both processes affected the abundance distributions in the same way, as most of the species removed from the 2013 data set and most of the species added in the 2019 data set are among the less abundant ones.
Therefore, the updates affected the evenness of the abundance distributions in the samples, mainly by chang-ing the number and relative abundances of rare species. These changes directly affect the estimates of species richness by LS and TNB, which rely on the shape of the distribution of abundances in the sample. Moreover, these changes also affect LSE and ABC estimates indirectly, because these methods use the distribution of total popu-lation sizes, which in turn depends on the relative abundances of species in the sample and on the occurrence of species across plots.
Also, we also updated the total area of Amazonian forest22 (see methods), causing a reduction of 17% in the
estimated total number of trees. This is an additional cause of the decrease in the 2013 estimates of species rich-ness, as all methods we used upscale some abundance distribution to the total size of the community.
The aggregation of species forms another important aspect of species richness estimation24, and as we have
shown here, this greatly influences species estimations. All estimators make assumptions about the probability of occupancy, which is then used to estimate the expected number of species recorded if the whole area would be sampled. The occupancy is affected by the distribution of individuals across plots, and is higher under random distribution of species than if species are aggregated (as more aggregation leads to less occupied plots, under the same mean density per plot). Thus, if is there conspecific aggregation the assumption of random distribution underestimates the real number of species, as our simulations have shown. This effect was even greater in our data
Model DF 2013 2013 updated 2019
Negative Binomial (TNB) 2 0.00 0.00 0.00 Logseries (LS) 1 1.67 30.02 31.52 Poisson-lognormal (PLN) 2 60.43 47.87 42.09
Table 1. Delta-AIC for each parametric model fitted to the empirical SAD constructed using the 2013 version
of the data (less plots, old taxonomy), the updated 2013 version (less plots, updated taxonomy) and the 2019 version (more plots, updated taxonomy). For each dataset version, the better supported model has 0 Delta-AIC. Models with Delta-AIC < 2 have equal support. DF = number of parameters in the model.
Figure 1. Fit of SAD models to the species abundances from samples from the three ATDN data sets. Left
column: observed frequencies of species in each abundance class (octaves, grey bars) and frequencies predicted by analytical Logseries (LS), truncated negative binomial (TNB) and Poisson-lognormal (PLN). Right column: rank-abundance plot in log-log scale of the abundances of species (gray) and the predicted abundances at each rank by the same three models.
Figure 2. Bias-corrected estimates of total species richness for each method and each data set. TNB, LS:
upscaling from the fit of Truncated Negative Binomial and the analytical Logseries to abundances in the sample; LSE: linear extension of the distribution of estimated population sizes; ABC: approximated Bayesian Computation for estimated population sizes distribution. ABC and all bias corrections are derived from simulated samples with conspecific clumping from a logseries community. Bars depict bias-corrected 95% confidence intervals or similar (credible interval for ABC).
Figure 3. Extension of assumed logseries of estimated population sizes to predict the number of species in
Amazonian forests. Grey dots in both panels are the estimated total population sizes of species recorded in the 2019 ATDN data set. The solid blue line in the main figure is the rank-abundance relationship predicted by a logseries with the average of estimates of number of species (15,874 spp). Dotted lines in the main panel delimit the rank-abundance for minimum and maximum of lower and upper limits 95% of the estimates. The lines in the inset panel are the mean and lower and upper bounds for the values of abundances estimates of the recorded species, also from averaging over all estimation methods.
Data set
Poisson-lognormal Logseries Negative Binomial Clumped Random Clumped Random Clumped Random
2013 0.00 0.00 0.71 0.29 0.00 0.00 2013 updated 0.00 0.00 0.76 0.24 0.00 0.00 2019 0.00 0.00 0.91 0.09 0.00 0.00
Table 2. ABC model selection. Posterior probabilities of each combination of regional SAD (PLN, LS, TNB)
and conspecific distribution (clumped or random) in simulated samples to approximate observed distribution of estimated population sizes, for the three datasets. ABC posterior probabilities estimates the probability of each simulation model to output an acceptable approximation of empirical data. Sizes of posterior samples: 600 (2013), 508(2013 updated) and 570 (2019).
set because the rarer the species, the more aggregated it was. This positive relationship between abundance and aggregation was found at local scales in tropical forests19. For ATDN data sets this pattern results from larger scale
processes, such as environmental differences and dispersal limitation among plots, and is in line with the hyper-dominance of a few, abundant species in Amazon1, and also with core-satellite hypotheses25,26. The relationship
is linear in log-log scale, which means that the degree of aggregation (expressed by the inverse of parameter k in Eq. S8, Fig. S8) increases by a power function with the mean density of species. Thus, the expected occupancy probability of unrecorded species drops quickly as more plots are added to the sample and the more abundant species are recorded, making the collectors curve rise slower than expected by random distribution of species. Thus, completing a list of species for Amazon is a long-term task that depends of increasing effort in data gather-ing. Such efforts include the expansion of plot-based inventory networks, such as ATDN, the increase of collect-ing efforts in existcollect-ing plots, make fertile material available in herbaria for taxonomic experts, support taxonomic work, exchange information between field ecologists and taxonomist27. It also depends on other strategies to
opti-mize the chances of adding new records to the list of Amazonian tree species, such as quick species assessments in target areas, and compilation of curated herbarium data7,28.
The main source of variation of richness estimates were the estimation methods. Therefore, which method should we trust? Considering that the current number of tree species recorded for the Amazon region is a little over 10,0008 methods that provide uncorrected estimates much below this value are definitely inappropriate for
estimating the total richness of the Amazonian tree flora (PLN, 5649). In fact, PLN had poor support from all data sets. Using non-parametric methods would also result in estimates between 5,000 and 6,000, leading to rejection. Non-parametric methods are based on assumptions that do not meet sampling with tree inventory plots in large areas such as the Amazon6, and tend to hugely underestimate richness when sampling is below 40%6,18 – sampling
here was 0.00035%. We have no good explanation why the PLN had such poor support from the data, however. TNB provided more accurate estimates of species richness than LS when applied to simulated samples with aggregation taken from a lognormal distribution with 5,000 species, and also when applied to empirical data sets12. We added to these results a comparison of LS and TNB with information theoretical criteria, showing that
TNB had better support from the distribution of abundances in the samples. Nevertheless, our more compre-hensive simulations (simulated samples from LS and TNB, with and without clumping and with species richness ranging from 10,000 to 20,000) showed that the degree of clumping found in our data sets can make TNB fit better even if the sampled distribution is a LS. Although both LS and TNB models assume random sampling (the mean field assumption sensu12), TNB has an additional scaling parameter that allows a better fit to different types
shapes of SADs12, and thus can accommodate better the increased dominance in abundance samples caused by
conspecific clumping. Such versatility12 comes at the cost of a selection bias against LS when the species are not
distributed randomly at the scale of sampling units. Indeed, the distribution of total population sizes were best approximated by simulated samples of LS metacommunities than by samples from TNB. Moreover, when fitted to samples from LS, TNB provided estimates with low precision. Combined, our current and previous12 simulations
suggest that benefits of using TNB to estimate species richness and as a model for metacommunity SADs still needs further investigation.
Looking towards the other alternatives (LSE: 16,741; ABC: 14,941; LS: 14,996, Fig. 2), the choice of the best estimate for the entire Amazon still is not an easy one, because differences between them are not trivial in num-bers. Differences in thousands of species are around 10% for the Amazon tree species richness but they are bigger than the tree diversity of North America (68029) or Europe (250). Recent reviews with simulated data support
both LS6 and LSE30 as accurate models to upscale SADs from samples to metacommunities. The effectivity of
ABC for inferring community parameters has not been evaluated systematically so far (but see31 for a particular
example). Nevertheless, ABC is unique among methods we used because it estimates richness directly from the
Figure 4. Expected species-accumulation curves from simulated samples logseries with conspecific clumping
based on the 2019 data set. The lines show simulated samples of a logseries with the mean (solid line) and lower-upper bounds (dotted lines) of the estimated number of species in the plot sample. Blue dots show the observed values for the three data sets.
simulations that allow different degrees of dispersion among species. As detailed above, these simulations were also used to correct ad hoc the bias of the other methods.
Given all the considerations outlined above, we argue here that using these different methods and taking into account their pros and cons, the most reliable estimate is that of a weighted average providing an upper and lower bound of the estimated species richness.
Because the most up-to-date dataset already contains 5,027 tree species and considering that the 1,946 plots constitute a very small sample of the complete Amazonian forest (0.00035%), estimates close to that number are clearly an underestimate. Any trustable estimate should at least be more than the ~10,000 tree species already col-lected in Amazonian forests8. The LS, LSE and ABC estimations showed a wide range of richness, so which species
estimate is most believable? As we cannot make a definite choice for any of the parametric methods (after all, the real number of species is not known), we suggest that the most probable estimate for the number of tree species in Amazonia is 15,874 species, based on a logseries with conspecific aggregation. We have shown that increasing the plot effort two or ten-fold will not contain more than 50% of the total estimated richness. A ten-fold increase of the current number of ~1-ha plots would still represent only 0.0035% of the forest area of Amazonia. Significantly increasing either the plot effort or implementing new, more intensive local sampling schemes (e.g.15) seem to be
inconceivable in any near future. Therefore, the number of tree species in Amazonia would remain as much an estimate as it is now and even a rather intensive well planned collecting campaign7,28 will only resolve part of the
“dark diversity” of trees in Amazonia.
Methods
To delineate the surface area for estimation, we created a base map of Amazonia, the borders of which were the same as those in our earlier estimate1. Following8,22, we gridded this landscape32 into 0.1-degree grid cells
(01DGC) and eliminated all 01DGCs that were more than 50% open water32, non-forest vegetation such as open
wetlands or savannahs33,34, or>500 m elevation35. We quantified the area of all individual 1-degree grid cells
(1DGCs), which varies with latitude due to distance from the equator (~124 km2 at the equator, ~106 km2 at 14°
S, and ~120 km2 at 8° N). The final forest map consisted of 46,986 01DGCs, totalling 5.79 million km2 of forest
area (Supplementary Fig. 10). This is considered the original extent of Amazonian forests. We made no correction for deforestation22, as all plots are in undisturbed forest. Therefore, predictions of the population sizes and species
richness estimates relate to the original Amazonian forest cover.
Tree density.
Our tree-inventory data are from the ATDN network1,9. March 2019, the ATDN networkcom-prised of 1,946 (1,774 1-ha, 146 < 0.5 ha, 26 > 2 ha) tree inventory plots with information on species composi-tion and abundances, and an addicomposi-tional set of 274 plots for which only tree density is known. These forest plots are scattered throughout Amazonia (Supplementary Fig. 11) and located in all the major forest-soil combina-tions1. The total plot area of the 1,946 plots with composition data is 2,042 ha. Our composition plot sample thus
amounts to 0.00035% of the Amazon forest area.
The methods we used to estimate the density of trees ≥10 cm dbh, species population sizes, and distribution are similar to those of1,22. From the 2,220 (= 1,946 + 274) plots with known tree density we removed outlier plots
with less than 200 (59 plots) and plots with over 900 stems (105 plots) (Supplementary Fig. 12). We constructed a loess regression model for tree density (stems ha−1) based on the observed tree density in the remaining 2,056
plots (using latitude, longitude, and their interaction as independent variables). The span was set at 0.5 to yield a relatively smooth average. The model was used to estimate average tree density (D1DGC, stem/ha) in each 1-degree
grid cell (1DGC). This average density was then multiplied by the total forested area of each DGC (see above) to obtain the total number of expected trees in the DGC.
Population sizes and species distributions.
Analyses of tree species composition were carried out using the 1,946 plots having species composition. Species synonymy was updated following4,8, which resulted ina reduction of almost 10% of the species observed in our sample in comparison to the 2013 version of the ATDN database. Species with a “cf.” identification were accepted as belonging to the named species, while those with “aff.” were tabulated at the genus level and therefore removed from the analysis.
While we assume that identification error is within acceptable limits for common species (see discussion in1),
plots vary in the proportion of individuals identified to species. Plots in which this proportion is 75% or greater (1,695 plots) were used for the population estimates of all species. Additionally, for each species we added those plots of the remaining 251 in which the species was identified positively, assuming that where species are known, they usually are locally common and where they are unknown, they are locally rare. In doing so, we assume that this does not add too many false positives. At the same time, we avoid adding too many false negatives, when using the plots with poor resolution in species identifications. Therefore, the number of plots used for the calcu-lation of the popucalcu-lation size differed across species.
The number of trees belonging to each species in the 1DGC was estimated following1,22. Abundances of all valid
species were converted to relative abundances (fractions) for each plot: RAi = ni /Nt, where ni equals the number of
individuals of species i and Nt the total number of trees in the plot (including unidentified trees)1. For all species
with a valid name in the 1,946 plots, we constructed an inverse distance weighting (IDW) model for RAi, with a distance-decay power of 2, a maximum number of plots used for each local estimation of 150, and a maximum distance parameter of 4 degrees. The number of individuals of species i in a given 1DGC was then simply calculated as the total number of trees in the 1DGC (D1DGC) multiplied by the fraction of the species i for that same 1DGC.
Amazonian tree-species richness.
We provide estimates for three different versions of the tree inventory data: the 2013 version which contained less plots (1,170) and used an old taxonomy (hereafter the 2013 dataset), the updated 2013 version which also contains less plots (1,162) but uses the updated taxonomy (the updated 2013dataset), and the 2019 version which includes all 1,946 plots and uses the updated taxonomy (the 2019 dataset). For each version of the data (Table S1), we estimated species richness for the original forest area of Amazonia using two different approaches: (i) extrapolation from the distribution of estimated total population sizes1; and
(ii) parametric methods, using the species abundances recorded in the sampled plots (Fig. 1, right panels). The parametric methods include the fit of the logseries (LS)36, the Poisson lognormal (PLN)13,37, and the negative
binomial (NB)12 to the empirical SAD of the plot data (Fig. 1., right panels) and the upscaling of the model fits to
the total area of Amazonia. A summary of each estimation method follows below (more details are available in the supplementary material).
Logseries extension (LSE). Using the population sizes of all Amazonian trees as in refs. 1,22 (and as outlined above),
this method expands the species abundance distribution of these population sizes down to the species with only 1 individual. Under the assumption of an underlying logseries SAD (see description of logseries below), such expan-sion is well approximated by a linear extrapolation from the central part of the empirical SAD1,10. We calculated
bootstrap confidence intervals of the total number of species estimated by LSE estimates using the standard devia-tions of the estimated population sizes, based on 500 bootstraps of the plot data (supplementary info page 5). Logseries analytical (LS). The logseries was among the first attempts to mathematically describe the relationship between the number of species and number of individuals in random samples from ecological communities36 as:
= α + α
S ln(1 N/ ) (1)
where α is the single free parameter of the logseries, which can be estimated from the distribution of species abundances in a sample. We fitted the logseries to the empirical SAD and then used the estimated value of α to estimate number of species predicted by Eq. (1) using N as the total number of trees estimated for the whole Amazon (supplementary info page 5).
Zero-truncated poisson lognormal (PLN).
Like the logseries, the PLN was developed based on the sam-pling theory of SADs24,38. It assumes that the observed SAD can be described as a Poisson sample of a regionalSAD that follows a lognormal distribution, which is approximated by the ‘veil line’ truncation of the lognormal39.
The PLN fitted to empirical SADs is truncated at zero, as species with no individuals recorded in the sample are unknown. As any zero-truncated distribution, the PLN fitted to an empirical SAD allows the calculation of the proportion of species that have not been sampled, thus allowing to estimate the total number of species in the sampled community13,37 (supplementary info page 6).
Zero-Truncated Negative binomial (TNB).
The TNB also results from a Poisson sample, yet from a Gamma distribution. It has two free parameters, r and ξp, and at the limit r -> 0 the TNB converges to theLS12,24,36,38. After fitting the TNB to the empirical SAD, we used the sampling intensity p (the proportion of all
individuals included in the sample or the proportion of total area covered by the sample) to estimate the number of species in the entire Amazon (S) using the following equation12:
S S (1 (1 )) /(1r (1 ) ) (2)
p pr
= − − ξ − − ξ
p p
where, ξ = ξp/( +(1− ) )ξ .p
The fit of the LS, PLN and TNB models to the empirical SAD, was performed using maximum likelihood techniques with functions from the ‘sads’ R Package40 (supplementary info page 13). The support that each data
set provide for each of these three competing models was gauged by Akaike Information Criterion (AIC) and also by the Bayesian Information Criterion (BIC). (supplementary info page 6).
Adding conspecific aggregation.
Assuming that the trees in our plots constitute a sample from the unknown regional Amazonian SAD, we tested if sampling from this theoretical SAD could provide accurate estimates of the calculated population sizes and total species richness. We performed this assessment by upscal-ing the LS, PLN and TNB for the entire Amazonia. We then simulated 1,946 random draws of 1-ha plots from regional SADs generated by these models, with and without conspecific aggregation. In both cases, we assumed that the expected abundance of each species in each plot was its mean density (ha-1) estimated for the total area ofAmazonia. As in other theoretical studies24, we used a Poisson distribution to simulate samples of randomly
dis-tributed species and a Negative Binomial distribution to simulate conspecific aggregation (not to be confounded with the TNB model described above).
We simulated the sampling of 1,946 1-ha samples from unknown regional SADs ranging from a total of 10,000 to 20,000 species. For each simulation and each estimation method (LSE, LS, PLN or TNB), we applied the same meth-ods described above to estimate the total species richness. We then estimated the bias of each method, defined here as the mean difference between the known values of species richness in the theoretical SAD and the richness esti-mated by each method. We used the estiesti-mated bias of each method to calculate their bias-corrected species richness. For simulations with conspecific aggregation, we allowed species to have different degrees of spatial aggregation, that is, different values of the dispersion parameter k of the negative binomial distribution. We obtained species-specific values of k based on the relationship between the estimated the values of k and the mean density of each species observed in the 1,946 plots (supplementary material page 7).