Faculté des Sciences Economiques Avenue du 1er-Mars 26
CH-2000 Neuchâtel www.unine.ch/seco
PhD Thesis submitted to the Faculty of Economics and Business
Institute of Financial Analysis University of Neuchâtel
For the degree of PhD in Financial Accounting by
Severin Oliver Widmer
Members of the dissertation committee:
Prof. Dr. Peter Fiechter, Université de Neuchâtel, thesis director Prof. Carolina Salva, Ph.D., Université de Neuchâtel
Prof. Dr. David Oesch, Universität Zürich
Prof. Dr. Jörg-Markus Hitz, Georg-August-Universität Göttingen, Germany
Defended on 27 April 2017
THREE ESSAYS ON CAPITAL MARKET EFFECTS OF
ACCOUNTING INFORMATION
Acknowledgements
First of all, I would like to express my sincere gratitude to my advisor Peter Fiechter for his continuous support and guidance throughout my doctoral study. It has been a great honor to be his first doctoral student. Beside his unquestioned expertise in the field of financial accounting, he proved to possess a very accessible personality and a positive attitude that created a friendly work environment, which fostered strong personal bonds within the office.
I am very thankful to my dissertation committee, Carolina Salva, David Oesch, and Markus Hitz for kindly accepting to review this manuscript and contributing their time and effort to the development of this thesis.
I am further indebted to Conrad Meyer who provided me with the opportunity to gain considerable teaching experience at the University of Zurich and whose student-oriented teaching approach has deeply inspired me.
I deeply appreciate the excellent research environment and all the necessary resources that have been provided by the University of Neuchâtel to participate in doctoral courses and to present my work at internationally renowned conferences. I also thank the entire IAF team, the Chair of Conrad Meyer, and the Chair of David Oesch for fruitful conversations and discussions, which broadened and deepened my research and accounting knowledge.
As it is always the people that make any experience special, I would like to thank my all-time wingman Alexander Mück who walked on my side during my first steps as a researcher. Also, I would like to express my special thanks to Albian Albrahimi and Ursina Hüppin for their excellent cooperation and their lifelong friendship.
Finally, and most importantly, I am grateful to my family for their boundless support, their dedication to my well-being, and their unconditional love over the past 30 years.
“Der Mensch verliert das Gleichgewicht seiner Stärke, die Kraft der Weisheit, wenn sein Geist für einen Gegenstand zu einseitig und zu gewaltsam hingelenkt ist.”
Executive Summary
This dissertation comprises three distinct chapters. The first chapter examines market reactions towards changing the information location of own credit risk (OCR) gains and losses on financial liabilities designated at fair value (FVOL) from net income to other comprehensive income (OCI), as part of replacing IAS 39 by IFRS 9. Using event study methodology, I find that banks that have accumulated an OCR net gain (loss) since 2006 exhibit significantly lower (higher) abnormal returns. This result suggests that investors overvalued banks that accumulated an OCR net gain relative to banks that accumulated an OCR net loss prior to the events. Further analysis shows that the effect is solely present in low information environments, consistent with low information environments decreasing the effect of OCR gains and losses on firm valuations.
The second chapter examines the return relevance, value relevance, and risk relevance of OCR gains and losses on FVOL. Using a global sample of IFRS banks from 2006 to 2015, we find that recognized OCR gains and losses are negatively related to stock returns and stock prices, respectively, indicating that the market perceives OCR gains (losses) as a negative (positive) signal for the bank’s economic performance. In addition, OCR gains and losses are risk relevant, as indicated by the positive correlation between the volatility in OCR gains and losses and the volatility in stock returns. Taken together, our findings suggest that recognized OCR gains and losses reflect changes in the entity-wide credit risk, i.e., the asset-side effect of credit risk changes dominates the liability-side effect.
The third chapter examines the capital market effects of standardized voluntary disclosure of industry-specific information in an ex-ante strong information environment, which is the European real estate sector. We compute three proxies measuring the degree of firm compliance with the best practice recommendations (BPR) issued by the European Public
Real Estate Association (EPRA). Our results show that EPRA NAV and EPRA NNNAV are both relatively and incrementally value relevant. Further, our results show that firms’ increased (decreased) EPRA BPR disclosures are positively (negatively) associated with liquidity and analyst coverage and negatively (positively) associated with cost of capital. Lastly, we find that debt offering plans are positively associated with first-time adoption of EPRA BPR and subsequently the degree of compliance with EPRA BPR. Overall, our results indicate that investors and analysts deem complementary disclosures in accordance with EPRA BPR useful.
Keywords: Own credit risk (OCR), debt valuation adjustments (DVA), IFRS 9, IAS 39,
fair value accounting, EPRA, best practice recommendations, standardized voluntary disclosure, banks and real estate firms, information asymmetry.
Résumé
Cette thèse consiste en trois chapitres distincts. Le premier chapitre examine les réactions du marché visant à modifier l'emplacement de l'information des profits et des pertes de risque de crédit propre (OCR) sur les passifs financiers désignés à la juste valeur (FVOL) du résultat net aux autres éléments du résultat étendu (OCI), dans le cadre du remplacement de l’IAS 39 par l’IFRS 9. À l'aide de la méthodologie de l'étude d’événements, je décèle que les banques qui ont accumulé un profit net (une perte nette) d’OCR depuis 2006 affichent des rendements anormaux nettement inférieurs (supérieurs). Ce résultat suggère que les investisseurs ont surévalué les banques ayant accumulé un profit net d'OCR relatif aux banques ayant accumulé une perte nette d'OCR avant les événements. Une analyse plus approfondie montre que l'effet est uniquement présent dans des environnements d'information inférieurs, consistent avec des environnements d'information inférieurs réduisant l'effet des profits et des pertes d'OCR sur les évaluations fermes.
Le deuxième chapitre examine la pertinence du rendement, de la valeur et du risque relative aux profits et aux pertes d'OCR sur FVOL. À l'aide d'un échantillon global de banques IFRS de 2006 à 2015, nous constatons que les profits et pertes d’OCR sont négativement associées aux rendements et aux prix du marché, ce qui indique que le marché perçoit les profits (pertes) d'OCR comme un signal négatif (positif) pour la performance économique de la banque. En outre, les profits et les pertes d’OCR sont pertinents pour le risque, comme la corrélation positive entre la volatilité des profits et des pertes de l'OCR et la volatilité des rendements des stocks l'indique. Pris ensemble, nos résultats suggèrent que les profits et les pertes d’OCR reflètent les changements dans le risque de crédit à l'échelle de l'entité, c'est-à-dire que l'effet sur l'actif des changements de risque de crédit domine l'effet du passif.
Le troisième chapitre examine les effets sur le marché des capitaux de la divulgation volontaire normalisée d'informations spécifiques à l'industrie dans un environnement d'information ex ante solide, qu’est le secteur immobilier européen. Nous calculons trois mesures approximatives capturant le degré de conformité des entreprises aux recommandations de bonnes pratiques (BPR) émises par l'European Public Real Estate Association (EPRA). Nos résultats montrent qu’EPRA NAV et EPRA NNNAV sont relativement et progressivement pertinents pour le prix du marché. En outre, nos résultats montrent que les divulgations EPRA BPR sont positivement (négativement) associées à la couverture de liquidité et aux analystes et négativement (positivement) associées au coût du capital. Enfin, nous constatons que les plans d'offre de créances sont positivement associés à la première adoption d'EPRA BPR et, par la suite, au degré de conformité avec EPRA BPR. Dans l'ensemble, nos résultats indiquent que les investisseurs et les analystes considèrent que les divulgations EPRA BPR sont pertinentes.
Mots clés : risque de crédit propre (OCR), ajustements d'évaluation de la dette (DVA),
IFRS 9, IAS 39, comptabilité de la juste valeur, EPRA, recommandations de bonnes pratiques, divulgation volontaire normalisée, banques et sociétés immobilières, asymétrie de l'information.
Table of contents
Introduction ... 1
Chapter 1: Market Reactions towards IFRS 9 Pronouncements ... 9
1.1. Introduction ... 9
1.2. Background... 14
1.2.1. International Financial Reporting Standards for Financial Liabilities ... 14
1.2.2. Literature Review and Hypotheses Development ... 17
1.2.3. Event Identification ... 19
1.3. Sample and Summary Statistics ... 23
1.3.1. Sample Selection Process ... 23
1.3.2. Descriptive Statistics ... 24
1.4. Research Design ... 25
1.4.1. Overall Market Reactions ... 25
1.4.2. Cross-Sectional Analysis ... 27
1.4.3. Monte Carlo Simulation ... 28
1.5. Empirical Results... 29
1.5.1. Overall Market Reactions ... 29
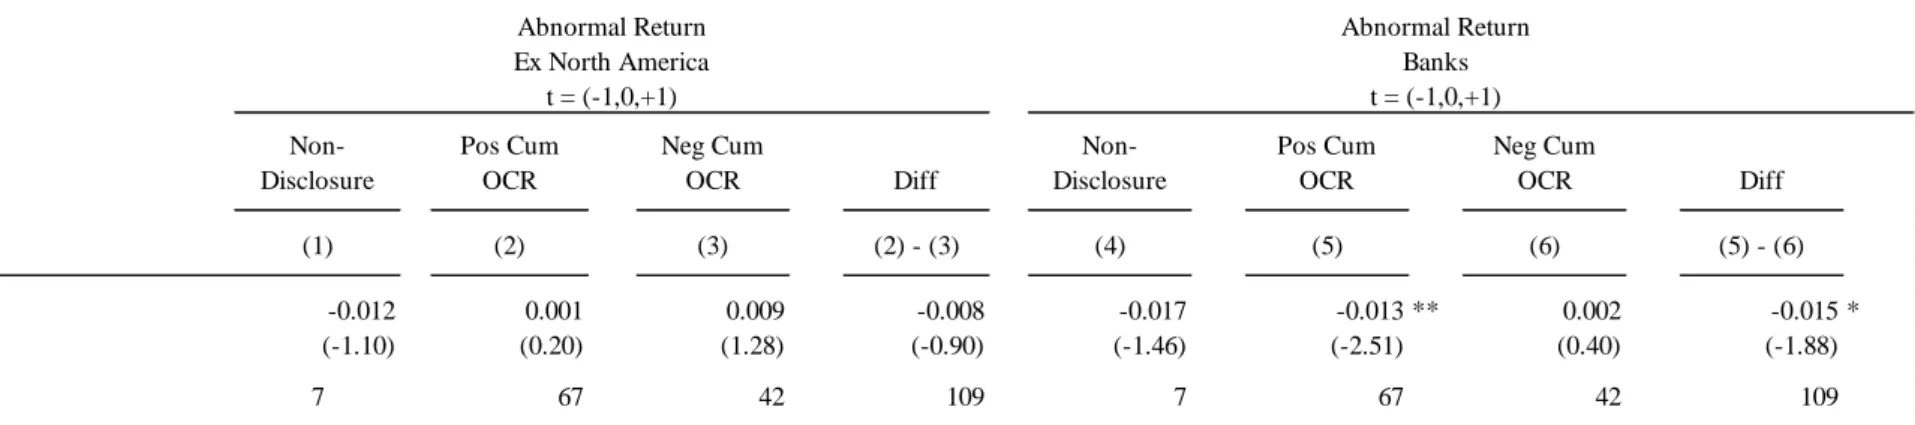
1.5.2. Descriptive Abnormal Returns ... 30
1.5.3. Cross-Sectional Analysis ... 31
1.5.4. Monte Carlo Simulation ... 33
1.6. Additional Analysis ... 34
1.6.1. Continuous Measurement ... 34
1.6.2. Small Sample Regression ... 35
1.7. Conclusion ... 35
References ... 37
Tables... 40
Chapter 2: The Market Perception of Own Credit Risk ... 51
2.1. Introduction ... 51
2.2. Background and Hypotheses Development ... 55
2.2.1. Accounting Treatment for Financial Liabilities under IAS 39 and IFRS 9 ... 55
2.2.2. Literature Review ... 56
2.2.2.1. Credit Risk and Equity Valuation ... 57
2.2.2.2. Processing of OCR Information ... 59
2.2.3. Hypotheses Development ... 61
2.3. Research Design ... 64
2.3.1. Return relevance ... 64
2.3.2. Value relevance ... 65
2.4. Sample Selection and Summary Statistics ... 68
2.4.1. Sample Selection Process ... 68
2.4.2. Descriptive Statistics ... 69 2.5. Empirical Results... 70 2.5.1. Return Relevance ... 70 2.5.2. Value Relevance ... 72 2.5.3. Risk Relevance ... 73 2.6. Additional Analysis ... 74
2.6.1. Institutional Differences in OCR Information Processing ... 74
2.6.2. Asset Write-Downs due to Changes in Credit Risk ... 75
2.6.3. Leverage ... 76
2.7. Conclusion ... 77
References ... 79
Tables... 83
Appendix 2 ... 90
Chapter 3: Beyond IFRS: How Firms Benefit from Industry-Specific Reporting Guidance ... 91
3.1. Introduction ... 91
3.2. Prior Literature ... 96
3.2.1. Voluntary Non-Standardized Disclosure ... 96
3.2.2. Disclosure in Accordance with IFRS ... 99
3.3. EPRA and the Real Estate Industry ... 101
3.4. Hypothesis Development... 104
3.5. Sample Selection, Disclosure Score, and Summary Statistics ... 106
3.5.1. Sample Selection Process ... 106
3.5.2. Disclosure Statistics and Score Construction ... 108
3.5.3. Summary and Distributional Statistics ... 110
3.6. Empirical Analysis ... 112
3.6.1. Value Relevance ... 112
3.6.2. Effects on Liquidity, Cost of Capital, and Analyst Following ... 115
3.6.3. Factors of EPRA BPR Compliance ... 121
3.7. Conclusion ... 123
References ... 125
Tables... 130
List of tables
Chapter 1: Market Reactions towards IFRS 9 Pronouncements
Table 1.1: Timing and Description of Events ... 40
Table 1.2: Sample Selection Process ... 41
Table 1.3: Descriptive Statistics ... 42
Table 1.4: Overall Market Reactions ... 44
Table 1.5: Descriptive Abnormal Returns ... 45
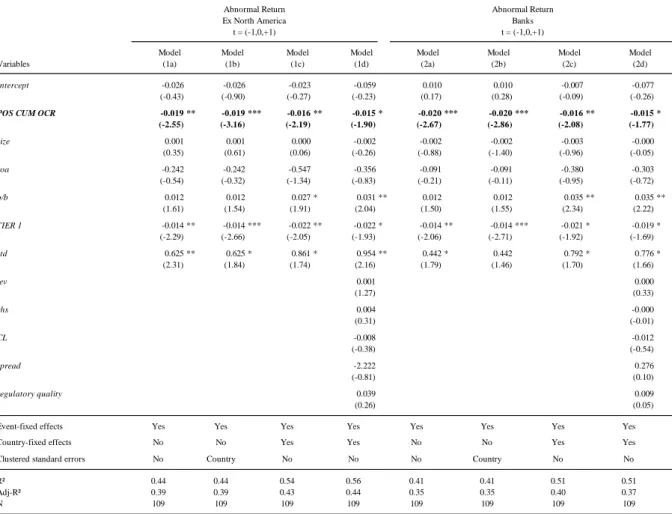
Table 1.6: Cross-Sectional Regression... 46
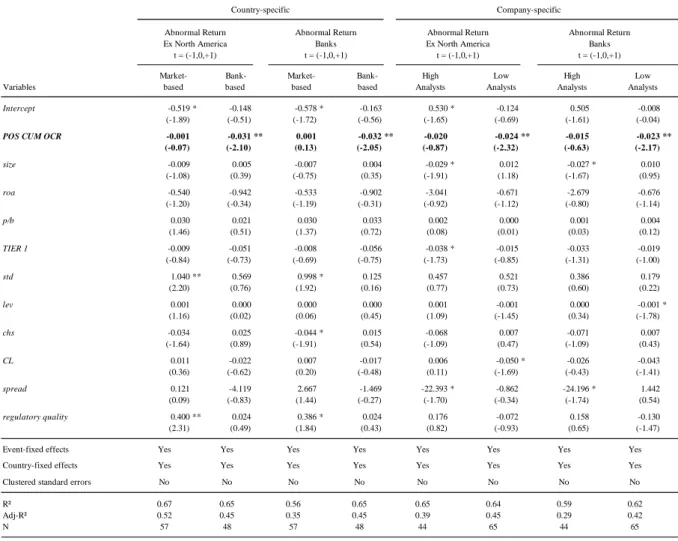
Table 1.7: Cross-Sectional Differences by Information Environments ... 47
Table 1.8: Monte Carlo Simulations ... 48
Table 1.9: Continuous Accumulated OCR Gains and Losses ... 49
Table 1.10: Small Sample Cross-Sectional Regression (ITA, UK, CH, and GER) ... 50
Chapter 2: The Market Perception of Own Credit Risk Table 2.1: Sample Selection Process ... 83
Table 2.2: Descriptive Statistics ... 84
Table 2.3: Non-Zero OCR Gains and Losses by Country and Year ... 85
Table 2.4: Return Relevance of OCR Gains and Losses ... 86
Table 2.5: Value Relevance of OCR Gains and Losses ... 87
Table 2.6: Risk Relevance of OCR Gains and Losses ... 88
Chapter 3: Beyond IFRS: How Firms Benefit from Industry-Specific Reporting Guidance
Table 3.1: Sample Selection ... 130
Table 3.2: Disclosure Statistics ... 131
Table 3.3: Spearman and Pearson Correlations ... 132
Table 3.4: Summary Statistics ... 133
Table 3.5: Sample Distribution ... 134
Table 3.6: Value Relevance ... 135
Table 3.7: Stock Liquidity and EPRA-BPR Compliance ... 136
Table 3.8: Refinancing Costs and EPRA-BPR Compliance ... 137
Table 3.9: Analysts Coverage and EPRA-BPR Compliance ... 138
Table 3.10: Within-Firm Analysis ... 139
Table 3.11: Switch-back Analysis ... 140
Introduction
Accounting research is a very wide area of research that typically examines reportable information and its association with economic outcomes. Those economic outcomes can include but are not limited to capital market outcomes, stakeholder behavior, taxation, labor migration, regulatory changes, and the environment. To investigate the associations between reportable information and economic outcomes, academic accounting research focuses on three broad scientific methodologies, i.e., empirical research, experimental research, and analytical research.
This dissertation focuses on capital market outcomes of accounting information using empirical research methodologies. This stream of literature goes back to Ball and Brown (1968) and Beaver (1968) who adopt event-study methodology for accounting research purposes. Event studies infer whether certain events convey new information to market participants, which in turn leads to changes in level or variability of stock prices or trading volume over a certain period (Kothari, 2001). The two studies provide compelling evidence that earnings announcements convey new information to market participants. In addition, Ball and Brown (1968) is also one of the pioneering association studies in accounting. Association
studies in market-based research test for significant correlation between reportable information and capital market outcomes. Ball and Brown (1968) find a positive correlation between accounting-based income numbers and stock returns.
Since then, empirical studies (e.g. association studies, causality studies, and path analysis studies) on the relation between accounting information and capital market outcomes have grown exponentially over time. These studies have helped us become more comfortable with the idea that there are certain interactions between accounting information and capital market outcomes. Nowadays, there is little disagreement that accounting information in general, and financial reports in particular, are a crucial primary source when investigating a company’s
performance. The increased reliance on accounting information and the increased complexity of today’s economy have led to more complex and exhaustive financial reports; a trend that shows no sign of abating. However, it is still under research whether lengthier and more complex disclosures generally alleviate information asymmetries or when additional disclosures alleviate information asymmetries.
A more traditional view proposes that investors have unlimited processing capacity. This means that lengthy and complex disclosure is potentially beneficial because investors can efficiently process all information and, thus, can ignore irrelevant information. In this case, additional disclosure is never harmful. On the contrary, an alternative view proposes that lengthy and complex disclosure is costly to process and as such less likely to be informative as investors do not have unlimited processing power. Hence the ongoing proliferation of mandated disclosures that accompany financial reports make it difficult for investors to separate relevant information from boilerplate language, immaterial information, or repetitions to decipher a company’s performance (Dyer, Lang, and Stice-Lawrence, 2016). In this view, disclosure overload can aggravate information asymmetries.
Some researchers argue (e.g. Cazier and Pfeiffer, 2015; Dyer, Lang, and Stice-Lawrence, 2016; and Guay, Samuels, and Taylor, 2016) that the increase in complexity and length of
annual reports are primarily driven by complex fundamentals and increased mandated disclosures, two factors that are outside the control of the firm. Nevertheless, a company’s management has at least some discretion over the complexity and length of financial statements. Management may decide to increase the complexity and length of financial statements for two opposing reasons: to obfuscate important information—such as poor performance (e.g. Li, 2008; Miller, 2010; Lawrence 2013; and Loughran and McDonald, 2014)—or to improve a complex information environment (e.g. Guay, Samuels, and Taylor,
My first two dissertation projects relate to the ongoing research on the complexity and length of disclosure by investigating own credit risk (OCR) gains and losses—an accounting topic that seems to be counter-intuitive and particularly difficult to understand even for knowledgeable financial statement users (Gaynor, McDaniel, and Yohn, 2011; Lachmann, Wöhrmann, and Wömpener, 2011; and Lachmann, Stefani, and Wöhrmann, 2015). OCR
gains and losses arise because of value changes in financial liabilities designated at fair value due to changes in an entity’s own credit risk. As such, an increase (decrease) in an entity’s credit risk affects ceteris paribus the value of the financial liability in a negative (positive) and the value of comprehensive income in a positive (negative) manner.
The first chapter is motivated by the question whether information location matters. Therefore, I examine market reactions to IFRS 9 pronouncements for financial liabilities. Specifically, I investigate whether markets reacted to issuance of new information regarding the overhaul of IFRS for financial liabilities designated at fair value. Eventually, the IASB decided—to avoid causing undue disruption to current accounting practices—to keep the accounting treatment for financial liabilities essentially unchanged except for the presentation movement of OCR gains and losses from net income to other comprehensive income. In cross-sectional tests, I observe that banks that accumulated an OCR net gain (loss) showed significantly lower (higher) abnormal returns. This finding suggests that investors perceived banks that accumulated an OCR net gain as overpriced relative to banks that accumulated an OCR net loss. Further analysis shows that—splitting the sample into above- and below-median information environments—the association between the sign of the accumulated OCR net results remains strong for low information environments but vanishes for high information environments. The results are consistent with low information environments decreasing the effect of OCR gains and losses on firm valuations.
The results in the first chapter raise concerns whether investors not only struggle with the processing of OCR gains and losses but systematically misinterpret OCR gains (losses) as a signal that an entity’s credit risk is improving (deteriorating). This concern has already been raised by prior experimental studies that show that knowledgeable financial statement users struggle with the interpretation of OCR gains and losses (Gaynor, McDaniel, and Yohn, 2011; Lachmann, Wöhrmann, and Wömpener, 2011; and Lachmann, Stefani, and Wöhrmann, 2015). In addition, critics of the recognition of OCR gains and losses claim that equity
analysts and investors ignore OCR gains and losses, because they do not reflect economic performance (e.g. JP Morgan Chase, 2009). However, whether OCR gains and losses indeed do not convey useful information to investors remains an open question.
To tackle this question, Peter Fiechter (co-author) and I apply return-, value- and risk-relevance methodology in chapter two. Our empirical evidence suggests that—contrary to various claims that OCR should be ignored—OCR gains (losses) signal negative (positive) economic performance, i.e., are negatively related to stock returns and stock prices, respectively. The negative association between OCR gains and losses and stock returns and stock prices, respectively, also indicates that the asset-side effect of changes in credit risk dominates the liability-side effect. We also find that volatility in OCR gains and losses are positively related to stock volatility, i.e., are risk relevant. Taken together, the results suggest that OCR gains and losses yield—despite their complexity—useful information to investors. Additional tests corroborate our notion that investors do not systematically misinterpret OCR gains (losses) as a signal for positive (negative) future performance.
The third chapter relates to the ongoing research on the complexity and length of disclosures by investigating whether real-estate-specific voluntary disclosures beyond IFRS trigger capital market outcomes. Therefore, Jérôme Halberkann (co-author) and I focus on voluntary standardized disclosures in accordance with the European Public Real Estate
Association (EPRA) Best Practice Recommendations (BPR). EPRA BPR provide European real estate companies with guidance on (1) what information investors need—beyond IFRS financial statements—(2) how the information should be generated, and (3) how the information should be presented. The high level of detail in these recommendations is intended to decrease information processing costs in an arguably ex-ante rich information environment to further increase transparency and comparability among real estate firms. In this setting, we seek to examine the usefulness, the economic effects, and the determinants of EPRA BPR disclosures. More specifically, we investigate whether EPRA BPR disclosures convey useful information that is incorporated into stock prices; whether EPRA BPR disclosures can be associated with positive capital market effects such as higher liquidity, lower cost of capital, and higher analyst following that go beyond the effects of applying IFRS; and whether certain factors favor an EPRA BPR adoption. Using value-relevance methodology, we find that EPRA net asset value (NAV) and EPRA triple net asset value (NNNAV) are relatively and incrementally value relevant, whereas EPRA earnings per share (EPS) are neither relatively nor incrementally value relevant. In terms of capital market outcomes, firms committing to EPRA BPR are associated with increased liquidity, lower refinancing costs, and greater analyst coverage. In addition, we find that an upcoming debt offering provides an incentive for real estate firms to adopt EPRA BPR. Also, firms with weaker stock price performance, firms with upcoming debt offerings, and firms in countries with better legal quality tend to more strongly comply with EPRA BPR.
The results in the third chapter add to the literature by providing rationale for the widespread use of voluntary disclosures to alleviate information asymmetries. Understanding the economic effects of accounting disclosures is arguably of first-order importance, because it sheds light on the economic effects of disclosures in other areas such as product quality,
consumer protection, conflicts of interests, environmental policy, health care etc. (Leuz and Wysocki, 2016).
Although there is already a vast amount of literature investigating the effect of voluntary disclosure in accounting, studies that allow for causal interpretations and studies that include path analysis remains rare due to their nature that these studies face a self-selection problem. Hence it remains an open question whether, for example, voluntary disclosure directly drives capital market outcomes; whether voluntary disclosure and capital market outcomes are a result of omitted variables; or whether voluntary disclosure affects omitted variables, which in turn trigger capital market outcomes. A recent path analysis study by Guay, Samuels, and Taylor (2016) suggest that voluntary disclosure in form of management forecasts may help
mitigate the negative effects of complex financial statements. Still, how voluntary disclosures, capital market outcomes, and analyst coverage are interrelated remains an open question.
References
Ball, R. and Brown, P. 1968. An empirical evaluation of accounting income numbers. Journal
of Accounting Research (6): 159–178.
Beaver, W.H. 1968. The Information content of annual earnings announcements. Journal of
Accounting Research (6): 67–92.
Cazier, R.A. and Pfeiffer, R.J. 2015. Why are 10-K fillings so long? Accounting Horizon (30): 1–21.
Dyer, T., Lang, M. H., and Stice-Lawrence, L. 2016. Do managers really guide through the fog? On the challenges in assessing the causes of voluntary disclosure. Journal of
Accounting and Economics (62): 270–276.
Gaynor, L.M., McDaniel, L., and Yohn, T.L. 2011. Fair value accounting for liabilities: The role of disclosure in unraveling the counterintuitive income statement effect from credit risk changes. Accounting, Organizations and Society (36): 125–134.
Guay, W., Samuels, D., and Taylor, D. 2016. Guiding through the fog: Financial statement complexity and voluntary disclosure. Journal of Accounting and Economics (62): 234–269. JP Morgan Chase. 2009. Comment letter (CL99) on the discussion paper on credit risk in
liability measurement. Retrieved from http://www.ifrs.org/Current-Projects/IASB-Projects/ Credit-Risk-in-Liability-Measurement/DP-Jun-09/Comment-Letters/Pages/Comment-letters.aspx.
Kothari, S.P. 2001. Capital market research in accounting. Journal of Accounting and
Economics (31): 105–231.
Lachmann, M., Stefani, U., and Wöhrmann, A. 2015. Fair value accounting for liabilities: Presentation format of credit risk changes and individual information processing.
Accounting, Organizations and Society (41): 21–38.
Lachmann, M., Wöhrmann, A., and Wömpener, A. 2011. Acquisition and integration of fair value information on liabilities into investors’ judgement. Review of Accounting and
Finance (10): 385–410.
Lawrence, A. 2013. Individual investors and financial disclosure. Journal of Accounting and
Economics (56): 130–147
Leuz, C. and Wysocki, P. D. 2016. The economics of disclosure and financial reporting regulation: Evidence and suggestions for future research. Journal of Accounting Research (54): 525–622.
Li, F. 2008. Annual report readability, current earnings, and earnings persistence. Journal of
Accounting and Economics (45): 221–247.
Loughran, T. and McDonald, B. 2014. Measuring readability in financial disclosure. Journal
of Finance (69): 1643–1671.
Miller, B.P. 2010. The effects of reporting complexity on small and large investor trading.
Chapter 1: Market Reactions towards IFRS 9 Pronouncements
1.1. Introduction
The International Accounting Standards Board (IASB) published the final version of International Financial Reporting Standard 9 (IFRS 9) in July 2014 as a reaction to the increasing criticism of the timeliness of recognition of expected credit losses, the complexity of multiple impairment models, and own credit risk (OCR) recognition for financial liabilities designated at fair value (FVOL) (IASB, 2014c). Related to OCR, the practice of recognizing changes in OCR has been criticized because an entity reports a gain (loss) from a decline (increase) in credit quality, through a decrease (increase) in FVOL (IASB, 2009). To avoid causing undue disruption to accounting practices, the IASB decided to keep the accounting treatment of FVOL essentially unchanged except for the presentation location of OCR gains and losses. Whereas prior International Accounting Standard 39 (IAS 39) stipulates recognition of OCR gains and losses through profit or loss, IFRS 9 generally stipulates recognition through other comprehensive income (OCI). The IASB believes that the new presentation location helps investors process OCR gains and losses without losing useful information about the implications of the changes in credit risk (IASB, 2010).
In this paper, I examine market reactions to IFRS 9 pronouncements regarding the treatment of FVOL. Specifically, I investigate whether markets reacted to the events when the IASB released new information (e.g. discussion papers, exposure drafts, final standards) regarding the standard overhaul process affecting the accounting treatment of FVOL. In a perfectly efficient market, where all information is processed by investors and reflected in stock prices, I should be unable to detect any significant market reaction because the change
in presentation location is unlikely to change the underlying economics of an entity.1 However, prior experimental studies find that investors’ view about the association between OCR gains and losses and firm performance can be biased (Gaynor, McDaniel, and Yohn, 2011; Lachmann, Wöhrmann, and Wömpener, 2011; and Lachmann, Stefani, and Wöhrmann,
2015). In addition, studies show that the quality of processing OCR gains and losses may
depend on the information location and that information presented in a salient, easily processable form can better be absorbed by investors (Lachmann, Stefani, and Wöhrmann, 2015). The increased public information and the heated debate during the standard overhaul
process on the accounting treatment of FVOL and the recognition of OCR gains and losses may have influenced investors’ assessment of how to incorporate OCR gains and losses in firm valuations. Such adjustments can induce market reactions. Focusing on banks, I conjecture that market reactions are likely to depend on whether banks accumulated an OCR net gain or a net loss since the fair value option for financial liabilities became first effective in 2006. Investors may have overvalued banks that accumulated an OCR net gain relative to banks that accumulated an OCR net loss because of the widespread misconception that OCR gains (losses) signal a credit risk improvement (deterioration). I further conjecture that such misconceptions are likely to be more pronounced in weaker information environments.2 Specifically, country-specific variation in information environments (e.g. stock market development) and bank-specific variation in information environments (e.g. analysts following) may affect the market reactions.
To investigate whether the new regulations for FVOL under IFRS 9 induced market reactions, I structure my research design as follows: First, I examine overall stock market reactions towards the new regulations. I market-adjust the raw returns around the four major
1 Bank-specific regulatory requirements such as Basel III stipulate exclusion of OCR gains and losses from the
calculation of Common Equity Tier 1. This exclusion is not affected by IFRS 9.
2 Maffett (2012), for example, shows that there is considerable variation in information environments across
steps towards the final standards using a one-factor market model to mitigate the effect of potential confounding events. Because I use stock return data with common event dates across banks—raising concerns about cross-sectional correlation—I build an equally-weighted portfolio of 144 IFRS-banks and run the tests on a portfolio level (Sefcik and Thompson, 1986). I compute abnormal returns relative to both the STOXX Global 1800 ex North
America index and the STOXX Global 3000 Bank index to mitigate concerns that the results are driven by the choice of a certain market index.
Second, I assess whether abnormal returns are associated with the sign of the accumulated OCR net gains or losses using cross-sectional variation in accumulated OCR gains and losses. I define a dichotomous variable that differentiates between two subgroups of banks: (1) IFRS-banks with FVOL that have accumulated an OCR net gain since 2006 and (2) IFRS-banks with FVOL that have accumulated an OCR net loss since 2006. I control for bank characteristics, stock characteristics, environment characteristics, country-fixed effects, and event-fixed effects to control for (un-)observable differences that may influence the relation between accumulated OCR net gains and losses and abnormal returns. I further investigate whether the association between accumulated OCR net gains and losses and abnormal returns are linked to the information environment. I perform two additional tests where I exploit country-specific and bank-specific variation in information environments. Following Beck and Levine (2002) and Fiechter and Novotny-Farkas (2017), I classify countries into
market-based and bank-market-based economies and repeat the previous regression for the two subsamples. In addition, I classify banks into high-analyst (low-analyst) following based on whether the average number of analysts following is above (below) the sample-median and, again, repeat the previous regressions for the two subsamples.
Third, because my findings are premised to the notion that daily stock returns are generally unrelated to OCR net gains and losses, I re-examine the association between OCR
net gains and losses and abnormal returns during event days. I randomly select four non-overlapping three-day event windows between 2008 and 2010 and re-estimate the main regressions on non-event days. I repeat this procedure one thousand times and test whether the means of the non-event coefficients are significantly different from the coefficients in the event regressions.
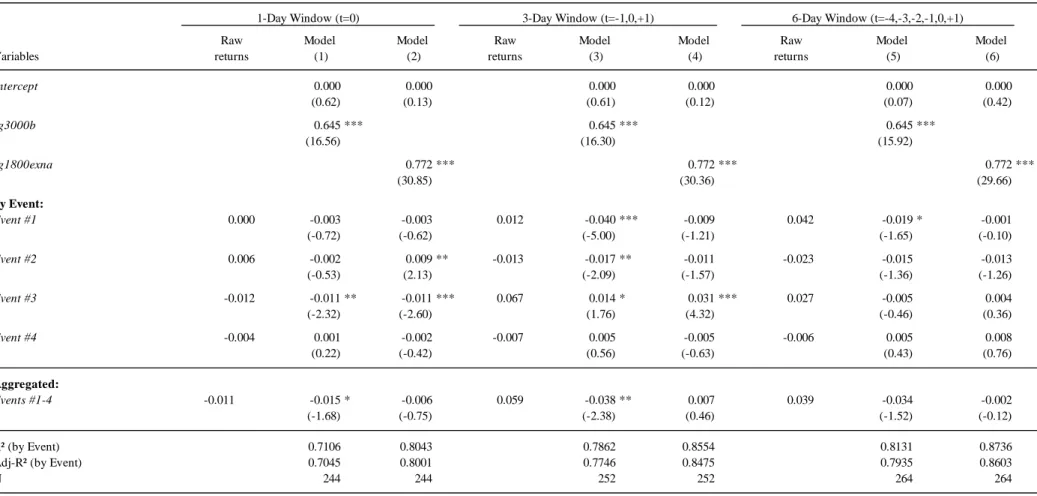
Empirical results show that the portfolio overall market reaction tends to be slightly negative. However, the findings turn out significantly negative only when using the STOXX Global 3000 Bank index and an event window t=(0) or t=(-1,0,+1). Using the STOXX Global 1800 ex North America index or a wider event window t=(-4,-3,-2,-1,0,+1) does not exhibit any significant portfolio overall market reactions. This result is in line with investors viewing banks that accumulated an OCR net gain as overvalued at the time of the events, as the mean of OCR net gains and losses in the sample is positive.
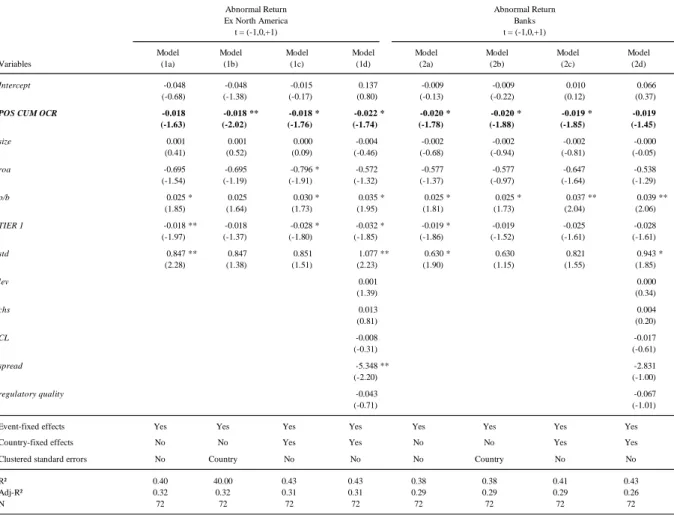
In the cross-sectional analysis, I observe strong results that banks that accumulated an OCR net gain (loss) show significantly lower (higher) abnormal returns. This finding underpins the notion that investors viewed banks that accumulated an OCR net gain as overvalued at the time of the events relative to banks that accumulated an OCR net loss. When I split the sample into above-median and below-median information environments, I observe that the association between the sign of the accumulated OCR net gains or losses and the abnormal returns is strong for low information environments only. The results are consistent with low information environments decreasing the effect of OCR gains and losses on firm valuations.
Simulation results corroborate that the effect is unique to the event days and, therefore, is likely to be driven by IFRS 9 pronouncements rather than misspecification such as omitted variable bias.
To further bolster my results, I examine whether not only the sign but also the magnitude of the accumulated OCR net gains and losses is associated with the abnormal returns by exchanging the dichotomous OCR variable by a continuous measure. I find a weaker negative association between the magnitude of the OCR net gains and losses and the abnormal returns. Still, four out of eight model specifications show significantly negative OCR coefficients and all model specifications exhibit the expected negative sign. To further mitigate concerns that my results are driven by country-specific effects that are unrelated to IFRS 9 pronouncements, I perform the main regressions on a subsample of four countries within Europe, which provide the most OCR-gains-and-losses data for my analyses.3 The small sample regressions show results that remain fully in line with previous results, suggesting that it is unlikely that the results are driven by effects that are specific to countries where OCR data is sparse.
Collectively, I find robust evidence on a negative relation between the sign of the accumulated OCR net gains or losses and abnormal returns towards new regulations for FVOL under IFRS 9. However, the findings include an important caveat—they rely heavily on a correct event identification where the time of relevant new information issuance lies within the event windows and major confounding events are excluded from the estimation.
Understanding the effect of the change in presentation location of OCR gains and losses on stock prices is important for several reasons: First, although banks that apply the fair value option designate, on average, only between 9.69% (2006) and 6.75% (2012) of their financial liabilities at fair value, OCR gains and losses can be substantial. From 2006 to 2012, OCR gains and losses ranged from gains of USD 6.6 billion to losses of USD 7.5 billion. Hence misinterpreting OCR gains and losses may materially distort investors' assessment of an entity’s value. Second, credit risk is arguably banks single-most important risk factor. Their exposure to credit risk due to their underlying business model translates directly into bank’s
3 66.1% of the data on OCR gains and losses comes from banks that are located either in Germany, Italy,
OCR. Hence understanding the implication of changes in credit risk on assets, liabilities, and comprehensive income should be a major concern.
The paper proceeds as follows: Section 1.2 provides background information, a literature review and the hypotheses development. Section 1.3 outlines the sample selection and descriptive statistics. Section 1.4 describes the research design. Section 1.5 presents the empirical results. Section 1.6 discusses additional analyses. Section 1.7 concludes.
1.2. Background
1.2.1. International Financial Reporting Standards for Financial Liabilities
Currently, IFRS require that financial liabilities are initially recognized at fair value plus transaction costs and subsequently recognized at amortized cost using the effective interest method. The effective interest method is based around the effective interest rate, the rate that discounts all contractual fees and points paid or received between parties through the expected life to the net carrying amount. Thus, the effective interest rate incorporates debt's market rate and, in turn, the borrower's credit risk, collateral, and guarantees. Interest expenses are calculated using the effective interest and are allocated over the periods until maturity.
As an alternative to amortized cost measurement, firms may irrevocably designate at initial recognition to measure financial liabilities at fair value through profit or loss. Those FVOL are initially recognized at fair value without incorporating transaction costs. Subsequently, FVOL are measured at fair value with gains and losses recognized in profit or loss (IASB, 2013).
Generally, making use of the fair value option for financial liabilities is not a widespread occurrence amongst banks that prepare their financial statements in accordance with IFRS. In my sample, only 8.9% of total debt is, on average, classified as FVOL. Beside the fair value
option, IAS 39 further requires fair value accounting for derivatives unless they are linked to and must be settled by delivery of an unquoted equity instrument whose fair value cannot be reliably measured.
Many financial statement preparers, users, and auditors have criticized IAS 39 for being too complex. They urged the IASB and the FASB to develop new standards on financial instruments that are principle-based and less complex (IASB, 2008). Meanwhile, the controversial debate over whether measurement of financial liabilities should reflect changes in a company's OCR through profit or loss flared up again. Some argue that incorporating credit risks into profit or loss is consistent with the initial measurement of financial liabilities—including the effects of the borrower's credit risk—and that it better represents the wealth transfer between equityholders and debtholders. As debtholders have a fixed claim, equityholders receive all the upside gains but share the downside losses with debtholder. An unexpected deterioration of credit quality increases the likelihood that debtholders lose (part of) their investment. The result is a wealth transfer from debtholders to equityholders. Others argue that it is counterintuitive if an entity reports a gain from a decline in credit quality and that financial liabilities should be measured at amortized cost because liabilities are seldom transferred, i.e., firms seldom realize value changes in FVOL (IASB, 2009).
In March 2008, the IASB published a discussion paper Reducing Complexity in
Reporting Financial Instruments that marked the beginning of the standard overhaul process
for financial instruments. First, the IASB considered examining the issue of credit risk in liability measurement as an independent project. In October 2009, the IASB decided to stop working on credit risk as a free-standing work stream and to integrate the topic in the project on the classification and measurement of financial instruments. In February 2014, the IASB finalized deliberations on the limited amendments to classification and measurement of financial instruments.
IFRS 9—which supersedes IAS 39—retains the requirement to measure financial liabilities initially at fair value and subsequently at amortized cost using the effective interest method. The option to irrevocably designate financial liabilities at fair value remains eligible if the information leads to more relevant information. Generally, IFRS 9 mandates that changes in the fair value of financial liabilities attributable to changes in OCR need to be presented in OCI. Only in cases where OCR gains and losses through OCI creates or enlarges an accounting mismatch, should a firm continue to show OCR gains and losses in profit or loss. An accounting mismatch arises when the effects of changes in a liability's credit risk are expected to be offset by changes in the fair value of other financial instruments. An assessment of an accounting mismatch is required at initial recognition and is not reassessed (IASB, 2014b). IFRS 7 requires qualitative disclosure in the financial statements notes of the methodology of assessing whether there is an accounting mismatch (IASB, 2014a). The amount of change in the fair value of a financial liability attributable to changes in OCR should be determined either as the amount not attributable to market risk or using an alternative method that directly estimates the amount attributable to credit risk. Changes in market risk can be measured by means of a benchmark interest rate, the price of a firm's financial instruments, a commodity price, a foreign exchange rate, or an index of prices or rates. Changes in fair value of financial liabilities attributable to market risk need to be presented in profit or loss (IASB, 2014b).
Initially, the IASB set January 1, 2013 as the mandatory effective date for application of IFRS 9. However, the effective date was first postponed to January 1, 2015. With the release of the final standard, the effective date was further postponed to January 1, 2018.
1.2.2. Literature Review and Hypotheses Development
One research stream relating to OCR gains and losses examines how changes in credit risk affect the value of equity and debt. Strong (1990) presents a disaggregated approach to measuring market value of debt. He separates debt-holding gains and losses into changes in credit risk and unanticipated inflation. The findings show that the effects of changes in credit risk and unanticipated inflation on bond value and stock value are both material and statistically significant. The disentangling of the two effects shows that increases in credit risk are negatively correlated with both equity and debt values and that there is a wealth transfer between bondholders and stockholders. Holthausen and Leftwich (1986) and Goh and Ederington (1993) investigate the effect of credit rating changes on stock returns. They find
that unanticipated downgrades, i.e., credit risk increases, are associated with negative abnormal returns around the events. Barth, Hodder, and Stubben (2008) test whether equity value changes associated with credit risk changes are attenuated by debt value changes. They find that the relation between credit risk changes and equity returns is significantly less negative for firms with more debt. Controlling for asset value changes, credit risk increases (decreases) are associated with equity value increases (decreases) through decreases (increases) in debt value. However, for a substantial majority of downgrade firms they find that recognized asset write-downs exceed unrecognized gains from debt value decreases. Lipe (2002) demonstrates that financial ratios can produce unwarranted positive signals when
measuring financial liabilities at fair value through profit or loss for firms that experience severe credit deteriorations. Lipe (2002) acknowledges that his results are primarily driven by poor and incomplete accounting choices for asset valuation and that if the accounting for all items was perfect, then any positive signal from writing down financial liabilities would likely be outweighed by other negative signals. Lipe (2002) concludes that if standard setters ultimately determine that fair value is the best measure for the statement of financial
positions, some of the misleading signals could be avoided by placing gains and losses attributable to changes in credit quality in OCI.
Another more recent research stream—relating to the interpretation of OCR gains and losses—shows that financial statement users have difficulties identifying and processing OCR gains and losses. Gaynor, McDaniel, and Yohn (2011) conduct an experimental study with CPAs where they find that over 70% of participants misinterpret a gain (loss) due to changes in firm's OCR as credit risk improving (deteriorating). Even if CPAs are given disclosure that explicitly specifies the relation between a credit risk change and net income—neither mandated by IAS 39 nor IFRS 9—misinterpretation of the OCR gains and losses continue to be around 50%. They conclude that additional disclosure can reduce misinterpretation only partially and that standard setter should, therefore, consider relegating credit risk gains and losses from net income to OCI. Lachmann, Wöhrmann, and Wömpener (2011) confirm the previous result that OCR gains and losses are counterintuitive for knowledgeable financial statement users. In addition, they find that changes in credit risk are more likely to remain unnoticed if they are not recognized but only disclosed. Lachmann, Stefani, and Wöhrmann (2015) conduct an experiment with auditors and find that participants are more likely to
identify the information on changes in credit risk if the information is included in OCI rather than net income. They argue that items presented in net income usually outnumber those in OCI and, as a result, it is more difficult for participants to extract the relevant information from net income than from OCI. However, the risk of misinterpreting the directional relation between credit risk and the comprehensive income is unaffected by the information location. The study is consistent with the notion that information presented in a salient and easily processable form is absorbed more easily by auditors (Hirshleifer and Teoh, 2003).
I argue that—based on the aforementioned studies—market inefficiencies are likely to exist in the form of imperfect OCR information processing. More specifically, difficulties in
identifying relevant OCR information and assessing the ramifications of OCR gains and losses on entity’s performance may have biased investors' assessment of firm valuation. For firms that accumulated an OCR net gain since 2006, firm value was likely overpriced relative to firms that accumulated an OCR net loss because of two reasons: First, if investors do not find OCR gains or losses in an income statement, they are likely to use OCR gains and losses fully for firm valuation through the inclusion of trading income and trading expenses. Second, if investors are able to identify OCR gains and losses but misinterpret the directional relation on firm's performance, they are likely to overprice firms that accumulated an OCR net gain. Correcting those misinterpretations should induce negative market reactions for firms that accumulated an OCR net gain relative to firms that accumulated an OCR net loss.
Investors’ ability to process information may depend on the sophistication of the information environment. Maffett (2012) shows that investor sophistication varies substantially across countries. To investigate differences in market sophistication, Beck and Levine (2002) and Fiechter and Novotny-Farkas (2017) classify countries into market-based
and bank-based countries. The institutional features of market-based economies exhibit higher stock market development, higher disclosure standards, and stronger information environment. Hence market-based countries are more likely to process OCR gains and losses correctly (Fiechter and Novotny-Farkas, 2017). In addition, firm-specific information environment may also influence the processing of OCR gains and losses and, therefore, the market reactions.
1.2.3. Event Identification
Although the shift of OCR gains and losses from profit or loss to OCI was a continuous process with considerable discussions, I identify four major steps towards the finalization of the new regulations for FVOL under IFRS 9. Events are identified by, first, going through all
project stages towards IFRS 9, starting with the discussion paper Reducing Complexity in
Reporting Financial Instruments to the finalization of IFRS 9 Classification and Measurement. Second, I screen the IASB and FASB meeting summaries to identify the major
steps towards finalizing IFRS 9. FASB meeting summaries are considered because FASB’s decisions are likely to have an impact on the IASB’s discussions and vice versa. Third, I examine available listings of documents publicly released by the IASB, the European Financial Reporting Advisory Group (EFRAG), the Standard Advice Review Group (SARG), the Accounting Regulatory Committee (ARC), the European Parliament, the Council of the European Union, and the European Commission (EC). Fourth, I search the Factiva database by Dow Jones & Company Inc. and the Thomson Reuters Eikon database for potential confounding events.4
Eventually, I consider major steps to be events when the IASB issues new publications to the public, such as discussion papers, exposure drafts, and final standards. Those publications are stronger signals how the final IFRS 9 might look like than meeting summaries. Also, IASB publications seem to be timelier than press releases as press releases often provide delayed summaries of the IASB publications. This way, I only consider events that provided new information to the market and I do not consider events that simply process information for another audience. In addition, I do not identify any pattern of good or bad news that systematically affects the stock returns during my events. Further, I focus on publications that are not only related to IFRS 9 but more specifically to FVOL because IFRS 9 does not only stipulate standards for the measurement of FVOL but also for the measurement of other financial instruments, for the impairment of financial instruments, and for hedge accounting. I focus on a small number of events that are most likely to have a significant influence on stock prices. This approach is more likely to isolate the effect of the change in information location
4 Factiva had initially been founded under the name Dow Jones Reuters Business Interactive but changed its
of OCR gains and losses from other concurrent events. Further, focusing on a small number of events should produce less noise and exhibit more accurate regression results. However, if stock returns were influenced by concurrent events, results can be biased. To mitigate this issue, I drop abnormal returns from the sample if event dates coincided with earning releases and shareholder meetings.
On (1) March 19, 2008 the IASB issued the discussion paper Reducing Complexity in
Reporting Financial Instruments to initiate the process of developing new regulations for
financial instruments. Many preparers had urged the IASB and FASB to amend IAS 39 to become more principle-based and less complex. The IASB proposed the following approach to mitigate those concerns:
Unrealized gains and losses on interest-bearing financial liabilities attributable to changes in the entity's own credit risk must be recognized in other comprehensive income. An entity could also choose to report a specific percentage of gains or losses on these financial instruments in earnings and the remainder in other comprehensive
income (IASB, 2008, 2.49(c)).
However, the discussion paper did not ask readers to express their opinion on the proposed approach.
On (2) June 18, 2009 the IASB issued the discussion paper Credit Risk in Liability
Measurement together with the corresponding staff paper.5 Both papers invited readers to
comment on predefined questions by September 1, 2009 without disclosing any new information on the standard overhaul process. The discussion paper sought comments on three possible approaches on liability measurement set out in the staff paper. Those
5 The accompanying staff paper provides additional information, illustrations, and a variety of arguments to
approaches identified possible ways to measure liabilities while always excluding OCR gains and losses from profit or loss.6,7
On (3) May 11, 2010 the IASB issued the exposure draft Fair Value Option for Financial
Liabilities. On the basis of the feedback received from its Financial Instruments Working
Group and from 123 comment letters, the IASB decided that none of the three approaches suggested in the second discussion paper would be any less complex or would result in more useful information than the requirements in IAS 39. The IASB proposed that OCR gains and losses on FVOL should be presented in OCI unless such treatment would create a mismatch in profit and loss. The IASB received 138 comment letters as a result of the exposure draft
Fair Value Option for Financial Liabilities. Those were carefully studied and incorporated
into the development of IFRS 9. However, measurement of OCR gains and losses remained unchanged.
On (4) September 28, 2010 the IASB published the standards relating to the classification and measurement of financial liabilities and financial assets. Those standards amended the measurement of FVOL such that OCR gains and losses should no longer be presented in net income but in OCI, unless such treatment would create or enlarge an accounting mismatch in profit and loss. The remaining amount of the change in the FVOL should remain in profit or loss. Table 1.1 summarizes the four event windows.
6
Between the issuance of the discussion paper Credit Risk in Liability Measurement and the comment letters hand-in deadline, on July 14, 2009, the IASB issued the exposure draft Financial Instruments: Classification and Measurement. The publication of the exposure draft is not included as an additional event because it does not provide any information on financial liabilities.
7 On October 21, 2009, the IASB stopped working on credit risk as a free-standing work stream and decided to
incorporate the topic in the conceptual framework measurement project. Further, the board decided not to change the role of credit/performance risk in the definition of fair value as a result of the responses to the discussion paper.
1.3. Sample and Summary Statistics 1.3.1. Sample Selection Process
I examine investors' perception of the major steps towards new regulations for FVOL under IFRS 9 by focusing on banks' abnormal returns during four events. My tests require data on daily stock returns, firm characteristics, stock characteristics, and information environment characteristics. I draw my sample of IFRS-banks from Bankscope; financial data from Thomson Reuters Eikon; analyst data from I/B/E/S; data on U.S. cross listings from Bankscope; data on the regulatory quality of each country from the index by Kaufmann, Kraay, and Mastruzzi (2009); and data on country-specific information quality from Fiechter
and Novotny-Farkas (2017). Data on FVOL, including OCR gains and losses in accordance
with IAS 39, is hand-collected from annual reports. The overall sample period spans from 2008 to 2010 except for daily stock returns that cover a period from 2007 to 2010—to estimate abnormal returns—and cumulative OCR gains and losses that cover a period from 2006 to 2010—to calculate the accumulated OCR gains and losses since the introduction of the fair value option in 2006. I focus on the banking sector because banks’ balance sheets consist primarily of financial instruments.
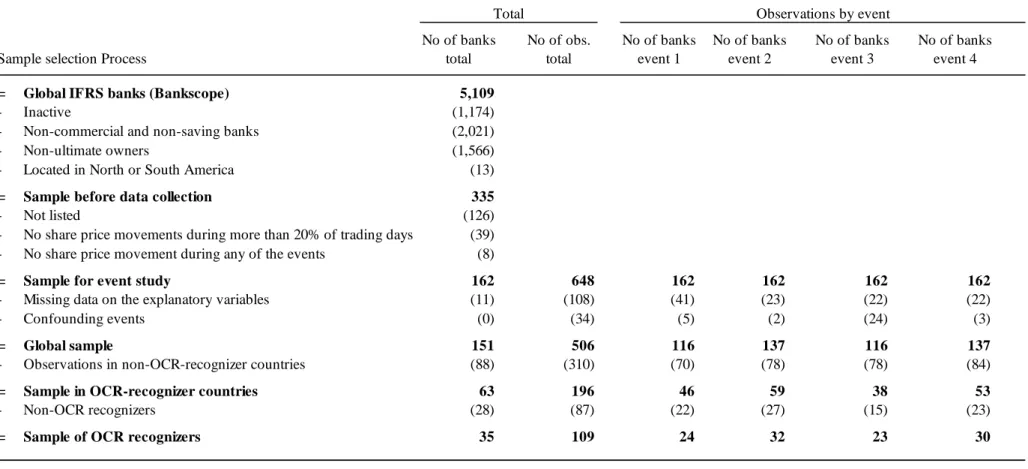
I start with an initial IFRS-bank sample of 5,109 banks. First, I exclude inactive banks (-1,174 banks) from the sample because they are not impacted by the new accounting standards for financial instruments. I focus on commercial banks and saving banks (-2,021 banks); ultimate owners (-1,566 banks) to examine data on the holding companies only; and banks that are located outside of North America and South America (-13 banks) to reduce continent-specific variation.8 The sample before any further data collection consists of 335 IFRS-banks.9 I drop banks from the sample if they have not been quoted on any stock exchange (-126 banks); if share prices do not move on more than 20% of trading days (-39 banks); and if
8 None of the 13 IFRS-banks in America used the fair value option for financial liabilities. 9
banks show no movements in share prices during any of the four event windows (-8 banks). The sample for the event study consists of 162 IFRS-banks and 648 observations. Observations with missing data on any of the explanatory variable were dropped (-108 observations) and if event dates coincide with earnings releases or annual meetings (-34 observations). The sample available for empirical tests comprises 506 observations from 151 banks and 35 countries. Of those observations, 196 observations from 63 banks can be observed in 12 countries where OCR recognizers are present. The sample of OCR recognizers comprises 109 observations from 35 banks in 12 different countries. Table 1.2 outlines the sample selection process.
1.3.2. Descriptive Statistics
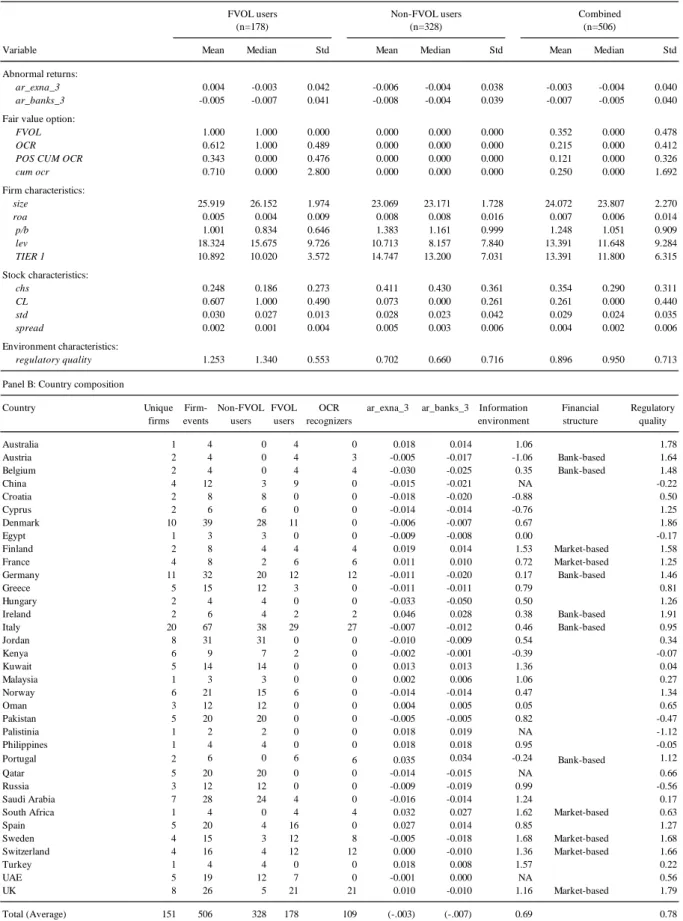
Table 1.3 presents descriptive statistics for the variables used in this paper. Table 1.3,
Panel A reveals that the mean of the abnormal returns using the STOXX Global 1800 ex North America index (ar_exna_3) and the STOXX Global 3000 Banks index (ar_banks_3) for the full sample are close to zero (-0.003 and -0.007, respectively) and close to the median (-0.004 and -0.005, respectively). I find that 35.2% of the firm-events use FVOL, 21.5% of the firm-events disclose OCR gains and losses, and 12.1% of firm-events have accumulated an OCR net gain since 2006. FVOL users tend to be larger banks (size), with higher leverage ratios (lev), lower tier-1 ratios (TIER 1), lower proportion of closely held shares (chs), more cross-listed stock (CL), and are more likely to found in countries with higher regulatory quality (regulatory quality).
Table 1.3, Panel B reports firms (Unique firms) and firm-events (Firm-events) by
country. Firm-events are separated into three subsamples include (1) observations with zero FVOL (Non-FVOL users), (2) observations with positive amounts of FVOL (FVOL users), and (3) observations with disclosure of OCR gains and losses (OCR recognizers), which is a
subsample of FVOL users. Further, I tabulate mean abnormal returns calculated using both the STOXX Global 1800 ex North America index (ar_exna_3) and the STOXX Global 3000 Banks index (ar_banks_3). I also provide continuous data on the financial market structure (Information environment) as measured in Fiechter and Novotny-Farkas (2017). Countries with at least one bank that discloses OCR gains and losses are classified as market-based (bank-based) if Information environment is above (below) median. Untabulated statistics reveal that abnormal returns are similar for market-based and bank-based economies. Lastly, I provide data on the regulatory quality (Regulatory quality) as measured by Kaufmann, Kraay, and Mastruzzi (2009) for the year 2008. Table 1.3, Panel B highlights that disclosure of OCR
gains and losses are most concentrated amongst Italy (24.8%), the United Kingdom (19.3%), Germany (11.0%), and Switzerland (11.0%).
Table 1.3, Panel C provides descriptive Pearson’s correlation below the diagonal and
Spearman’s rank correlations above the diagonal for the variables used in the cross-sectional analysis. Those correlations provide first descriptive evidence that abnormal returns (ar_exna_3 and ar_banks_3, respectively) tend to be negatively correlated with the dichotomous variable equal to one if a bank has accumulated on OCR net gain and zero otherwise (POS CUM OCR) and the magnitude of accumulated OCR gains and losses (cum
ocr), respectively.
1.4. Research Design
1.4.1. Overall Market Reactions
Following the extensive literature on event-studies, I market-adjust raw event returns using a simple one-factor market model to mitigate the effect of potential confounding events
(e.g. MacKinlay, 1997).10 The market model parameters are estimated over the period from 11 to 250 days before the first event on March 19, 2008. Because I use a sample comprising only of banks that are located outside of America, choosing an appropriate market index is not obvious. I market-adjust raw returns for the three-day event-window t=(-1,0,+1) using the STOXX Global 1800 ex North America index and the STOXX Global 3000 Banks index.11 The STOXX Global 1800 ex North America includes firms from all industry sectors that are located outside of North America. The STOXX Global 3000 Banks index includes banks from around the world. I do not use a broader index because that would raise concerns about adding unrelated variation, which can bias my results. I also do not use a narrower index like the STOXX Global 1800 ex North America Banks index because the index is very similar to my sample composition.
I start to examine market reactions towards the development of new regulations for FVOL under IFRS 9 by examining abnormal returns on days that lie within the event windows. For each firm-day within the event windows, I compute abnormal returns relative to the STOXX Global 1800 ex North America index and the STOXX Global 3000 Bank index. I compute cumulative abnormal returns for three different time windows, i.e., 1-day window t=(0), 3-day window t=(-1,0,+1), and 6-day window t=(-4,-3,-2,-1,0,+1). I present cumulative abnormal returns for each of the four events (CAR) and aggregated over all events (CCAR). Because I use stock return data with common event dates across banks, I am likely to find cross-sectional correlation. To remedy this concern, I base my test statistics on equally-weighted portfolio returns. Portfolio returns are not affected by potential cross-sectional correlation (Sefcik and Thompson, 1986) and are assumed to be uncorrelated across different
10 Employing a multi-factor model for short-term event studies has been shown to have limited explanatory
power over a one-factor model (e.g. MacKinlay,1997). Hence I focus on using a one-factor model.
11 For descriptive purposes I also present abnormal returns for the one-day t=(0) and the six-day
time windows. However, a portfolio approach is not applicable in cross-sectional analyses, because all firm-specific abnormal return variation would be lost.
1.4.2. Cross-Sectional Analysis
My main inferences are based on the cross-sectional variation in market reaction to the new regulations for FVOL under IFRS 9. In particular, I assess whether abnormal returns are associated with the sign of the accumulated OCR net gain or loss over time. To measure this effect, I introduce a dichotomous variable POS CUM OCR equal to one if the bank accumulated an OCR net gain since 2006, and zero if the bank accumulated an OCR net loss. To obtain my inferences, I estimate the following model:
ari,e= β0+ β1 POS CUM OCRi,e + ∑𝑗𝑗=1𝐽𝐽 γj Controlsj,i,e + ∑𝑓𝑓=1𝐹𝐹 δf Fixed Effectsf,i,e+ εi,e (1)
where ar is the cumulative abnormal return for bank i during event e relative to the STOXX Global 1800 ex North America index and the STOXX Global 3000 Banks index, respectively. Controls is a vector of control variables including size, roa, p/b, TIER 1, std, lev,
chs, CL, spread, and regulatory quality. Fixed Effects is a vector of country-fixed effects and event-fixed effects.
size is the natural logarithm of total assets. roa is the return on asset calculated as income
after tax divided by total assets. p/b is the price-to-book ratio calculated as market capitalization divided by total book value of equity. lev is the leverage ratio calculated as total liabilities divided by total book value of equity. TIER 1 is a dichotomous variable equal to one if the core equity capital divided by total risk-weighted assets is above the sample median and zero otherwise. chs is the percentage of closely held shares calculated as one minus free floating shares divided by total shares outstanding. CL is a dichotomous variable equal to one
if the company has stock that is cross listed on a U.S stock exchange and zero otherwise. std is the standard deviation of a bank’s stock returns during a calendar year. spread is the yearly median bid-ask spread calculated as the difference between the bid and ask price divided by the mid-point measured at the end of each trading day. regulatory quality is the regulatory quality in accordance with the index by Kaufmann, Kraay, and Mastruzzi (2009) for the year 2008. Generally, dichotomous variables are labeled in capital letters. T-statistics are calculated using White (1980) heteroscedasticity-consistent standard errors controlling for event-fixed effects and country-fixed effects (Petersen, 2009; Gow, Ormazabal, and Taylor, 2010; and Gormley and Matsa, 2014).
To further investigate whether variation in market reactions are associated with the information environment, I perform two additional tests. First, following Beck and Levine (2002) and Fiechter and Novotny-Farkas (2017), I calculated for each country the first
principal component of two variables that measure the comparative activity and size of stock markets relative to the number of banks in this country. I focus on countries with at least one bank disclosing OCR gains and losses in the annual statement. Countries with above (below) median are defined market-based (bank-based) economies. Second, I exploit variation in the information environment on a firm-level based on the number of analysts following. I classify banks as high Analysts (low Analysts) if the number of analysts following is above (below) median. The median is calculated using only banks that accumulated OCR gains and losses, i.e. OCR recognizers. Then I re-estimate the main model separately for market-based and bank-based countries and for high-analyst and low-analyst banks.
1.4.3. Monte Carlo Simulation
My cross-sectional findings are premised to the notion that daily stock returns are generally unrelated to OCR gains and losses on non-event days. In other words, I assume that
absent the development of new regulations for financial liabilities, POS CUM OCR is zero. However, one important alternative is that misspecification or omitted variables, correlated with the new regulations, drives the relation between the two (e.g. Cremers and Nair, 2005; Core, Guay, and Rusticus, 2006; Bebchuk, Cohen, and Ferrell, 2009; Armstrong, Barth,
Jagolinzer, and Riedl, 2010; Gompers, Ishii, and Metrick, 2010; and Larcker, Ormazabal, and
Taylor, 2011). If this is the case, I expect POS CUM OCR to be related with abnormal returns
even in the absence of regulatory action, i.e., on non-event days.
To address this concern, I perform a simulation procedure to re-examine my results by estimating Equation (1.1) on non-event days. I randomly select four three-day event windows between 2008 and 2010 that are not overlapping, calculate the cumulative abnormal returns, and estimate the coefficients. I repeat this procedure one thousand times and retain the coefficients from each iteration. I test whether the non-event coefficients are significantly different from the event coefficients, using the distribution of the one thousand non-event coefficients. This procedure enables me to confirm whether the effects on abnormal returns are specific to the events. For my results to be unbiased, I expect that POS CUM OCR on non-event days is significantly different from POS CUM OCR on non-event days.
1.5. Empirical Results
1.5.1. Overall Market Reactions
In my first set of tests, I establish the overall market reactions during the major steps towards the new regulations for FVOL under IFRS 9. Table 1.4 presents descriptive portfolio raw returns and abnormal returns by event and aggregated for three different event-windows.
The first column for each event-window (Raw returns) reports unadjusted raw returns from the equally-weighted portfolio of IFRS-banks. The portfolio raw returns by event do not

![Table 1.8: Monte Carlo Simulations Variables Regression β Monte CarloE[β] Regressionβ Monte CarloE[β] Intercept -0.023 0.023 -0.007 0.019 (-0.54) (-0.32)](https://thumb-eu.123doks.com/thumbv2/123doknet/14934090.665512/64.1262.110.1046.144.606/table-simulations-variables-regression-carloe-regressionβ-carloe-intercept.webp)