MULTITROPHIC MODELS OF PREDATOR-PREY ENERGETICS' A. P. GUTIERREZ
Division of Biological Control, University of California, Berkeley, California 94720
J. U. BAUMGAERTNER
Institut fuer phytornedizin der ETH, ETH-Zentrurn, 8092 Zurich, Switzerland
C. G. SUMMERS
Division of Entomology and Parasitology, University of California, Berkeley, California 94720
An important goal of many population ecologists has been to model multitrophic (i.e. predator-prey) interactions in a realistic manner (Gilbert et al. 1976). Several obstacles to this goal were apparent, among them the lack of a suitable mathematical biological framework for incorporating the richness of the observed population biology without mak- ing the model so complicated as to approach a one-to-one simulaton of nature. Among the important attributes of populations that needed to be incorporated into models were: age structure, morph, size and sex characteristics, relevant physiology, stochastic devel- opment, behavior, time varying survivorship, and many other factors affecting real pop- ulations. Furthermore, the currency of exchange between trophic levels needed resolution, as numbers of prey killed is not an adequate measure of the food eaten by the predators. A satisfactory compromise between unrealistic mathematical simplicity and excessive bi- ological detail has been elusive. This three-part series makes progress towards resolving some of these issues, and attempts to put the various contributions made into historical perspective.
The first paper (Gutierrez and Baumgaertner I) expands a model for energy or biomass assimilation by individuals, that has been proposed in various forms in the literature, to model the growth, development, reproduction, ageing and survivorship of the pea aphid (Acyrthosiphonpisum (Harris)). The model links theory of food acquisition (i.e. functional response) and food assimilation (metabolic pool), and generalizes the new model across all trophic levels. Using this model, observed fertility and survivorship schedules for pea aphid at several temperatures were successfully simulated and used to predict age-specific life-table parameters (e.g. R,, r,, developmental time) for independent data sets not used to formulate the model. The acquisition and assimilation models were incorporated into a simple predator-prey model.
The second paper (Gutierrez and Baumgaertner 11) incorporated age structure, sto- chastic development, morph, size and other attributes of individuals, behavior, immigra- tion and emigration, and other factors into models of the population dynamics of each species. This multitrophic model is used to examine the theoretical properties of an alfalfa (Medicago sativa L.), pea aphid, blue aphid (A. kondoi Shinji), pea aphid parasitoid (Aphidius smithi Subba Rao), lady beetle (Hippodamia convergens G.-M.), green lace- wing (Chrysopa carnea Stephens) system under constant environmental conditions. The parameters for the acquisition and assimilation model for all species except alfalfa are reported here.
The third paper (Gutierrez et al. 111) uses the model reported above to simulate the observed year-long dynamics of several of the species in the field using observed initial numbers and the observed weather pattern. The effects of the Egyptian alfalfa weevil (Hypera brunneipennis Boh.) feeding on alfalfa, predation by the anthocorid bug (Orius tristicolor White) on the aphids, and disease mortality to the aphid populations from the fungal pathogen Entomophthora spp. are included in a qualitative way.
The three papers show that realistic multitrophic level modeling is possible but cau- tions against extrapolating theoretical results to the field where subtle behavior may yield
results contrary to model predictions. Despite this admonition, the modeling effort has served to explain the nature of the interaction of several species in nature, and will serve as an important tool for future practical and theoretical studies in the alfalfa ecosystem. The work stresses the need for detailed field and laboratory work closely linked to modeling efforts.
I. AGE-SPECIFIC ENERGETICS M O D E L S P E A APHID ACYRTHOSZPHON PZSUM (HOMOPTERA: APHIDIDAE) AS AN EXAMPLE1
A. P. GUTIERREZ and J. U. BAUMGAERTNER
Abstract Can. Ent. 116: 924-932 (1984)
A simple age-specific energetics (calories or biomass) model for the growth and de- velopment, reproduction, respiration, ageing, and intrinsic survivorship as a function of temperature and per capita energy availability for pea aphid (Acyrthosiphon pisum (Harris)) is reported. The ratio of energy supply-demand is used to scale all of the rates in the model. The maximum demand for energy based upon current state values is used to drive the Frazer-Gilbert functional response model (i.e. food acquisition), which is a component of the metabolic pool model used to assimilate energy to growth, repro- duction, respiration, and egestion. The extensive data sets on pea aphid energetics published by Randolph et al. (1975) were used to develop the model. As the model estimates reproduction (M,) and survivorship (L,) values, extensive published age- specific life-data sets on pea aphids are used to test it. The results suggest:
(1) the lower thermal threshold for development is raised and the upper threshold is - - lowered as food resources are decreased
(2) the temperature-dependent rate of development is slowed with decreasing energy resources
(3) the size of individuals and reproduction become smaller as temperature approaches the upper and lower thermal thresholds.
A simple model for multitrophic level interactions incorporating the acquisition and assimilation functions is presented.
Resume
Un modele simple et specifique de I'lge permet de decrire les transferts d'energie (calories ou biomasse) lies i la croissance, le developement, la reproduction, la res- piration, la senescence et la survie intrinseque en fonction de la temperature et des ressources CnergCtiques per capita, chez le puceron du pois (Acyrthosiphon pisum (Harris)). Toutes les vitesses de transfert du modkle ont 6tC adjustkes d'aprks le rapport CnergCtique offre-demande. La demande maximale d'knergie basCe sur les valeurs caractCristiques de 1'Ctat actuel, sert d'intrant au modele de reponse fonctionnelle de Frazer-Gilbert (c. i d . d'acquisition de la nourriture), lequel est un element du modkle de rCserve mktabolique par lequel 1'Cnergie est repartie entre la croissance, la repro- duction, la respiration et 1'Cgestion. Les donnees elaborees publikes par Randolph et al. (1975) sur les budgets CnergCtiques du puceron du pois ont Cte utilisees pour dC- velopper le modkle. Etant donne que le modele estime les valeurs de la reproduction (M,) et de la survie (L,), des bases considCrables de donnCes biologiques d6ja publikes sur le puceron sont utilisees pour le valider. Les rCsultats indiquent que:
(1) le seuil thermique infkrieur pour le developpement est ClevC et le seuil superieur est abaisse, lorsque les ressources alimentaires diminuent
(2) la vitesse de developpement spkcifique de la tempkrature est ralentie par une baisse des ressources CnergCtiques
(3) la taille des individus et la reproduction diminuent lorsque la temperature approche les seuils thermiques infkrieur et supkrieur.
Volume 116 THE CANADIAN ENTOMOLOGIST 925 Un modtle simple dkcrivant les interactions multiples entre niveaux trophiques et incorporant les fonctions d'acquisition et d'assimilation, est prksentk.
Population biologists typically model interactions within trophic and between trophic levels in terms of individuals involved rather than in terms of their dry weight biomass or its calorie equivalent. In such models, density represents the numbers of individuals per unit area. Furthermore, the rates of energy (biomass) acquisition and assimilation and the effects of these rates on the organisms' growth, development, age-specific birth and death rates, and population age structure have not been integrated into population models. The rate of predator food acquisition is defined by the functional response (Solomon 1949; Holling 1966), which relates the increase in prey consumption (No) (or attack) to increasing prey densities (N). The general form of the functional response is convex upward, and may be written as follows:
N, = (1 -f(N,P))N [I]
where P denotes predator density. Several forms for f(N,P) have been proposed, and the subject has been recently reviewed by Gutierrez and Getz (in press).
Of the available prey acquisition models forf(N,P), only the Frazer-Gilbert model (Frazer and Gilbert 1976) [eqn. 21 incorporates predator demand (b) for prey,
MT = M , , ( 1 - exp(( - b J 4 , A t l M L , ) ( 1 - exp( - ~ J 4 , ~ , 1 b , ) ) ) ) [21 where s is the rate of prey discovery. In our modification of the Frazer-Gilbert model, MT, Mi-,, and Mi are prey biomass-consumed, prey biomass, and predator biomass re- spectively; i denotes trophic level and b is the maximum predator demand rate for prey, expressed as g preylg predatorlAt. The model approaches a Nicholson-Bailey model, when N -0, and a Lotka-Volterra model when both N and P -P 0.
Gutierrez et al. (1981) used this model as the basis for their model of biomass ac- quisition and assimilation by the predator Hippodamia convergens G.-M. For our pur- poses, biomass or energy are interconvertible, but in this paper we use calories. The assimilation of prey energy into predator energy is described by the metabolic pool model proposed by Petrusewicz and MacFadyen (1970) and modified by Gutierrez et al. (1981): where the undefined variables A,, R,, and G , are the rates of calories assimilated for re- production and growth respectively by individual predators,
p,
is the fraction of food consumed which is egested, and Z, is the respiration rate per unit predator. The costs of converting prey to predator are included in Z,. The switch of assimilate from G to R occurs at a specific age in the model, but for simplicity we ignore the subscripts.Thus, MT = M,-,(1 - f(M,,,M,)) is the food supply rate per predator, while the sum of R,, G,, egestion, and ZJ4, is the demand rate (b) estimated under conditions of unlimiting food and physical environment. The rate of food acquisition is always less than the demand rate because the acquisition model [2] has the demand rate as its major parameter, and the model itself is a search model. At a probabilistic level, searching is always less than perfect; hence, M*
<
b. Model [3] has been used to model the effects of M*lbe[O, 1] (i.e. 0 M*lb =S 1) on ageing and mortality in the lady beetle, Hippodamia convergens (Gutierrez et al. 1981).This paper extends the model [3] to pea aphid (Acyrthosiphon pisum (Harris)), an important prey of H. convergens. In effect, pea aphid is modeled as a predator of plant sap. The parameters for the pea aphid model were estimated from the very extensive energetics data on pea aphid published by Randolph et al. (1975), and tested against age- specific life-table data of Siddiqui et al. (1973), Barlow et al. (1977), Campbell and
1984
Mackauer (1975), Gutierrez (1968), and Bieri et al. (in press). The parameters estimated for the functional response model [2] are b and s, while those for the metabolic pool model [3] are
p,
and 2,. We will discuss model [3] first.Parameter Estimation
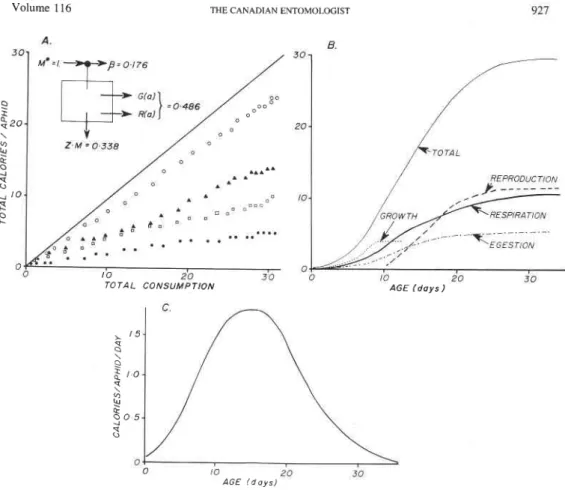
Parameters for the metabolic pool model. Figure 1A shows the proportion of total calories consumed by pea aphid that are allocated to growth or reproduction (48.6%), egestion (p, = 17.6%), and respiration, and cost of conversion (33.8%). Energy allocation either to growth or reproduction is age-specific, but the data show that the proportion of' calories consumed that are allocated to both remains the same. The proportion
Pi
was taken as a constant directly from the above data, even though Llewellyn and Qureshi (1979) showed that it may vary according to food quality and quantity.Figure 1B shows the cumulative allocation of the energy to growth reproduction, egestion, and respiration as a function of age in days at 20°C. Each day equals 15.9 degree- days (Do) above the developmental threshold of 4.1°C (Gutierrez 1968). The ages of the adult molt, first reproduction, decline in feeding, and cessation of feeding can be deter- mined from the data, and the age-specific changes in consumption are shown in Fig. 1C. The respiration rate Zi during growth and reproduction can be estimated by solving for 2, in equation [3]; thus:
z,
= M,-,(l -f(M,-l&'O)(l - P,) - A, = 0.22 cal/cal/day [41 M ,or 0.014 cal/callDO. Since Z includes both maintenance respiration and costs of converting prey to predator, it reduces to just maintenance respiration (i.e. see Randolph et al. 1975) during the postreproductive period (400D0 or 25 days approximately).
Parameters for the functional response model. If we assume that the rate of consump- tion (MT) during the period from birth to peak reproduction occurred under unlimiting conditions (i.e. MT
-
MT, ,),, then [3] may be rewritten asM T = (A, + Z M , ) I ( ~ - P,) 151
and the demand rate b (cal/cal/DO) as
The above value of b, as expected, underestimated the required value because MT
<
MT,,,; hence, b,,, = 0.050 was selected from a series of simulation runs. In practice, Barlow et al. (1977) showed that the flow of sap through cut aphid stylets from vigorous plants was more than twice an aphid's demand, which suggests the aphid regulates the flow of sap into its body. Only at low food levels may the aphid encounter difficulty obtaining food, hence it searches for the additional food (e.g. as in [2]).
Figure 1B,C shows that food consumption declines from a maximum rate at age 18 days to zero after age 30 days (ages 240 < a < 400D0), but we do not know the mechanism. The parameter b [eqns. 5,6] should include the effect, so we estimated it from the data in Fig. 1C:
b(a) = b,,(l . - 0.0045(a - 240)), ~ [ 0 , 0 . 0 5 ] for a > 240. [71
The observation of Ward and Dixon (1982) that embryos in the aphid Megoura viciae are selectively absorbed by the adult (i.e. youngest first) when food becomes limiting, helps us explain the decline in food demand. We propose that embryos grow exponentially within a pea aphid viviparous adult, until demand for nutrients becomes greater than the adult's ability to supply it. At this time, the mother's physiology stops production of new embryos and selectively reabsorbs the youngest ones. In other words, there is a limit to the adult's ability to assimilate food (i.e. supply), but the demand is regulated by the number, size, and pre-birth age structure of embryos. This model is similar to that proposed
Volume 116 THE CANADIAN ENTOMOLOGIST 927 v Z - M 0,338 'TOTAI
/i
T O T A L CONSUMPTION AGE ( d a y s 1 AGE ( d a y s )FIG. 1. The age-specific energetics of pea aphid (data from Randolph et a [ . 1975). A, cumulative calories consumed (-), assimilated (O), used in growth and reproduction
(A),
respiration(a),
and egestion (.); B, cumulative age-specific assimilation of energy; C, daily age-specific consumption of calories. NOTE: All dataare presented per individual reared on peas at 20°C.
by Gutierrez et al. (1975) and Wang et al. (1977) for the effects of M*lb on cotton fruit bud production and shed rates, except in pea aphid, embryo production does not resume after it has terminated. The demand rate then declines until it is just the maintenance respiration rate (see 171).
The size of new embryos is also related to M*lb, but in this model, we take the simpler empirical approach [8] of Ward and Dixon (1982) who found that embryo size at birth (M,) is 4.8% the size of the reproductive adult aphid (Mi(a
>
a* = 154D0)) [see 81.M,,, = 0.048 M,. 181
In our study, the smallest progeny is assumed to be 0.12 cal, while the largest one is defined by the maximum size of adults under given environmental conditions (max M,
= 4.6 cal). The number of progeny produced per female per At equals RIM,.
The search parameter s equals unity because the aphid is on the plant, and search effort is near zero. Furthermore, since M,-, at high levels of food is usually large relative to demand, (1
-
exp( - s,M, - ,lb)) in [2] is approximately 1 and has little influence on b,. Ageing and survivorship. Gutierrez et al. (1981) also explore the effects of M*lb on ageing and survivorship. In their ageing model [9],where a is age, and a = 0.75 is the observed maximum decline in the ageing rate as modified by M*lb. Because search efficiency is imperfect, M*/b is always less than 1. Thus ageing, as measured by phenological age (i.e. molts), slows down as food becomes limiting (Baumgaertner et al. 1981 b), and can have important consequences on population
growth rates.
The maximum mortality rate (d, = 0.0045/D0) was estimated from the Randolph et al. (1975) data for days 30-40, when the aphids ceased feeding. The effects of M*lb
and age were used to modify this rate as follows:
while the proportion of the original aphid cohort surviving to age a = x (i.e. L,) equals
L,(a) = L,(a - Aa) - d,(a,M*lb). [ I l l
Tests of the Pea Aphid Model
The Randolph et al. (1975) data were used to formulate the model, hence as a min-
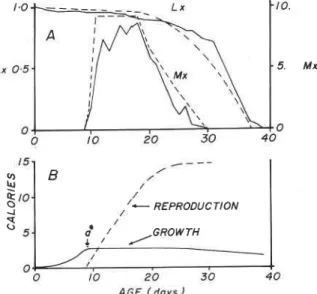
imum, the model should duplicate those results. A food level of Mi-, = 20 callday (see [3]) was selected because it was near the maximum response of the model to varying levels of food (Fig. 3). The fit of the linked models [3,9,11] to the M, and L, data (solid lines) is in general quite reasonable in view of the simplifications involved in formulating the model (Fig. 2A).
/ /
,/- REPRODUCTION
I
AGE f days )
FIG. 2. Simulation of the Randolph er al. (1975) pea aphid data (solid lines). A , L,, and M, data; B, the energetics
data.
A further test of the model is made by comparing the allocation of energy consumed to the various demands (Fig. 2B). Again, the model results are in reasonable accord with the data, and the obvious discrepancy in reproduction is due to the fact that embryo age structure was not included in our model and part of the simulated reproduction in our results was part of growth in the (Randolph et al. 1975) data, to errors in parameter
estimation by us and Randolph et al. (1975), and the fact that our model is deterministic
and the data have a stochastic element. The discrepancy could be corrected by further fine tuning the model, but we have resisted the temptation. A good test of the model must include data not used to construct the model, and two data sets are particularly valuable, Bieri et al. (in press) and Siddiqui et al. (1973). These tests are described below.
Volume 1 16 THE CANADIAN ENTOMOLOGIST
5 0 ;5 0 5 Jo
FOOD
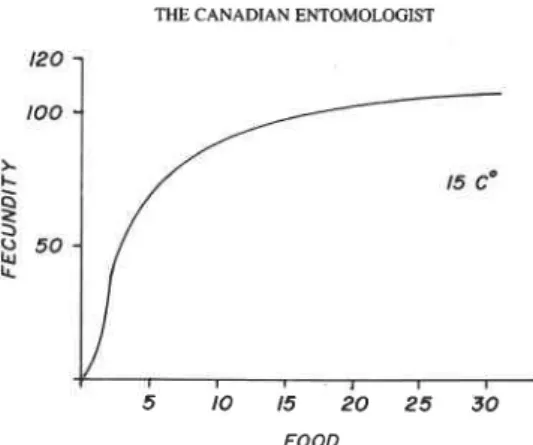
FIG. 3. Simulated calories consumed and assimilated as progeny per Plgeneration as a function of calories available (food).
Repraduction at various temperatures. Bieri et al. (in press) reared pea aphid on pea
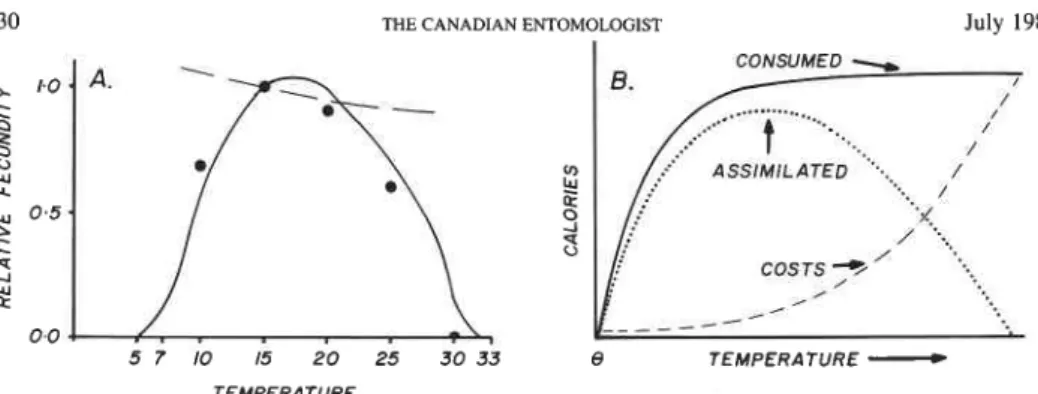
at several temperatures, and fig. 4a showed the asymmetrical normalized response of progenylfemale (i.e. R,). The simulation data were normalized to conform to the Bieri et al. data. The maximum simulated value occurs at 15"C, while zero values occur near 5" and 30°C close to the upper and lower thermal thresholds. The simulation run of progeny1 female at the 20 cal food level across the various temperatures is illustrated by the dashed line, and shows that the model, under constant food conditions, fails to simulate the data. The discrepancy may be due to the fact that net photosynthesis slows at low and high temperatures (R. Loomis, pers. comm.) because of low photosynthetic efficiency and high metabolic costs, respectively. Fitzpatrick and Nix (1970) published growth indices [eqn. 121 for temperate legumes in response to temperature (7) (i.e. TI(r)~[0,1]). This response function is used here to scale pea (Pisum sativa L.) and alfalfa (Medicago sativa L.) photosynthate production.
r
O T < 4OCwhere c, = 2.48 x 10⁵ and c, = -0.81.
With the inclusion of TI(T), the fit of the model to the Bieri et al. data is very good (solid line). The Bieri et al. data are skewed to the left because MT at a given level of food rises sharply with temperature then reaches a plateau, while Z, in theory has a shallow exponential increase with temperature, and the per unit difference MT
-
Zi produces the skewed curve (Fig. 4B). The linear relationship for Z in our model nonetheless gave reasonable results. A similar relationship between MT and Z, occurs at the plant level, and is no doubt a better description of the process than TI. The reproductive maximization seen at T = 15°C in the Bieri et al. (in press) results occurs when dM"1d.r = dZ1d.r. In other words, fecundity maximization occurs when the marginal benefits equal the marginal costs. Other attributes such as food level can be included in the maximization function above (see Gutierrez and Baumgaertner 11, this series). Similar data to those of Bieri et al. have been published by Messenger (1964) for spotted alfalfa aphid (Therioaphis trifolii Monell).Life table statistics. Siddiqui et al. data: The experimental results on developmental
times, survivorship (L,), and reproduction (M,) reported by Siddiqui et al. (1973) were estimated at temperatures from 10" to 30°C using pea aphids reared on pea plants from the same colony as those used in the Randolph et al. (1975) studies. Figure 5 compares the
5 7 10 15 2 0 25 3 0 3 3 e TEMPERATURE
-
TEMPERATUREFIG. 4. A comparison of normalized fecundity data (.) in Bieri et al. (in press) with simulated results (lines).
A, without temperature effects on the plant (---); and with temperature effects (-); B, a theoretical model
showing the responses of consumption (-), metabolic costs (---), and net assimilate (-) to temperature.
NOTE: 0 in 4B is the thermal threshold for development.
I0 20 30 40 50 AGE ( d a y s )
B
C 1.0 0.8 0.6 Lx-
0.4 0.2 10 2 0 30 AGESimulation (lines) of L, and M, data (.)
.-u.a.c*...
-
- 0... .. ..
\-.
....
\.'..
\ 15-C\ .
;7.2*2L- \ r.'
\ -1 *& \ * I x I-
\ \'
' \f.
.I.
\ L I-
-.
.>.
f.. Isimulated L, and
M,
values and the Siddiqui et al. (1973) data at 15", 20°, and 25°C. Siddiqui et al. (1973) did not obtain progeny at 30°C, while the model predicted a very small aphid adult and a very low realized fecundity.Siddiqui et al. (1973) also performed age-specific life-table analyses on the data, and as our model estimates L, and
M,
values, we performed the same analyses on the simulated data using the methods reported by them. The intrinsic rates of population growth (r,) in the Siddiqui et al. (1973) data were converted toDo
by dividing their r, values by the number of degree-days at the experimental temperature.-
r 10 8 6 4-
Mx
2 r-
5 10 15 20 25 30 ( d a y s )I at 15", 20°, and 25°C from Siddiqui et al. (1973).
ylr-r-u Y * . \ * p-1
<.
25% .I.- '
\.
I' \
I . \ J \ I . \ \ I I .I \ ' I-
' Qx \ f v l x 1 \ L. I\-.
.,.
7 . r IVolume 1 16 T I E CANADIAN ENTWMOLDGIST 93 1
A comparison of the observed and simulated r, values is shown in Fig. 6. The closed circles represent data taken from Siddiqui et al. (1973, table I), while the open circles were estimated from a regression presented in fig. 8 in the same paper. The Siddiqui et al. (1973) data are flatter than predicted by the model, but the fit is very reasonable. Varying the food (i.e. 1, 5, and 20 callday) does not affect the optimum, but does increase the lower thermal threshold and lowers the upper thermal threshold (Fig. 6). These results indicate that our model [3] may have considerable utility in demographic studies (see Gutierrez and Baumgaertner 11, this series).
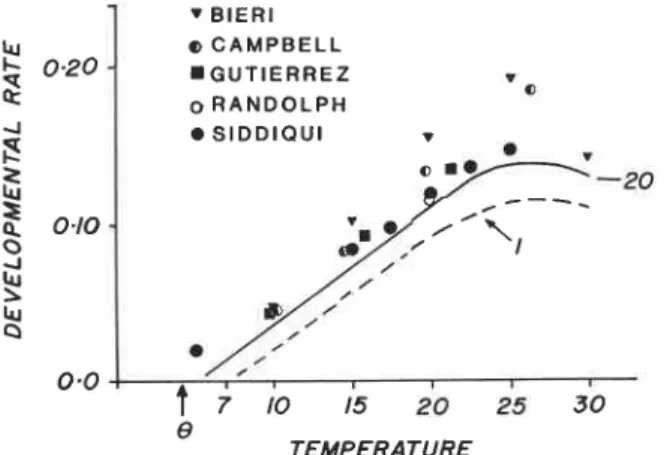
Developmental rates: Several studies, including those reported above have estimated developmental times for pea aphid (see also Campbell and Mackauer 1975, Gutierrez 1968). The developmental rates (lIT(7)) for these data sets as well as the model results are shown in Fig. 7. The Siddiqui et al. (1973), Randolph et al. (1975), and Gutierrez (1968) data compare favorably with that predicted by the model, while those data given by Campbell and Mackauer (1975) and Bieri et al. (in press) are very different (i.e. the rates are higher). The aphids used in the Siddiqui et al. (1973) and Randolph et al. (1975) experiments were from the same laboratory source (see Barlow et al. 1977), those in the Campbell and Mackauer (1975) and Bieri et al. (in press) came from western Canada and
TEMPERATURE
FIG. 6 . A comparison of empirically estimated (.) and simulated (lines) r, values from Siddiqui et al. (1973)
at 1, 5 , and 20 callaphidlday. The open circles represent data estimated from fig. 8 in Siddiqui et a[. (1973).
1
r BIER1 lu o CAMPBELL$
0-20 m G U T I E R R E Z I a o R A N D O L P H 4 S I D D I Q U I I 2I
o m-e 0.0 !t
;
;O 15 20 25 30 8 TEMPERATUREFIG. 7. A comparison of developmental rates predicted by the model and several data sets reported in the literature (see text). The dashed line represents the effects of low food availability (i.e. 1 callaphidlday) on
Switzerland respectively, while the pea aphids in the Gutierrez (1968) experiments were field-collected at Albany, California and reared on alfalfa cuttings. Suffice it to say, the model was developed using data on aphids from Barlow's laboratory colony, and the model predicts their developmental rates rather well. The fit can be improved by fine tuning equation [9] (i.e a = .8) but the discrepancy with the other data sets is likely due to biotype (see Campbell et al. 1974), nutrition effects, and differences in environmental conditions not reported or detected. Host plant and food quality have also been shown to slow developmental times in Aphis craccivora (Gutierrez et al. 1971), hence the small discrepancies in developmental times seen in the data were not unexpected. Low food levels and possibly low food quality slow developmental rates and increase the lower threshold (Fig. 7).
Discussion
The pea aphid models [2,3] above describe the growth and development of individual aphids under varying conditions of food and temperature, as well as the effects of food and temperature on age-specific life-table statistics. But the incorporation of both the search model [2] and the allocation pool model [3] into linked population models needs to be demonstrated (Gutierrez and Baumgaertner 11, this series). A general model for a coupled prey (M,)
-
predator (M,, ,) system can be written to include [2,3]:dM,+l
- - - MLl -.f+I(M,>M,+J)(l- Pl+d -
dt Zt+IMc+i - M,+I(l -.L+2(M3+1J4L+2)).
Note that MT = M,- ,(I -J;(M,-,,M,)) is the consumption rate of the ia trophic level and the death rate of the i - lth trophic level (see Lawton et al. 1975 and Hassell et al. 1976),
Z M , is the cost of respiration, and M, -
,
, M,, M, +,
and M, +, represent the energy (biomass) in four trophic levels.The model is general because parallel arguments aboutp) can be made for all trophic levels, including plants. The function describing the gross photosynthetic rate is also con- vex upward and can be written as $(I -A$,L)), where $ is calories of solar radiation per calorie of leaf (L) per unit time. In our pea aphid model, the prey for the aphid in [2] equals $(1 -K$,L)) minus plant respiration. The addition of age structure to the model complicates formulation only in a minor way. For example, Gutierrez and Baumgaertner
I1 (this series) have recently linked five trophic levels in alfalfa using these methods and simulated a very complicated data set successfully. No doubt this model form [13] will provide a fertile basis for theoretical studies of predator-prey systems.
Models [2,3,13] depart from traditional modeling paradigms in several important ways: (1) extensive data on organism energetics have been used to formulate a very simple growth and development model, (2) the functional response model has been generalized to incorporate demands motivated by species physiology, (3) the model has been suc- cessfully tested against independent sets of data on L,, M,, R,, r,, and developmental times and rates, (4) the processes of ageing and survivorship have been modeled suc- cessfully using the interplay between organism food supply+lemand, and (5) the units of intra-individual allocation of energy and inter- and intraspecific exchanges of energy are common across all trophic levels. Similar models have been used to model plant growth and development (see Gutierrez et al. 1975, Wang et al. 1977).