Annals of Oncology 24: 2657–2671, 2013 doi:10.1093/annonc/mdt301 Published online 6 August 2013
Cancer mortality in Europe, 2005
–2009, and an overview
of trends since 1980
C. Bosetti
1*, P. Bertuccio
1,2, M. Malvezzi
1,2, F. Levi
3, L. Chatenoud
1, E. Negri
1& C. La Vecchia
1,21
Department of Epidemiology, IRCCS-Istituto di Ricerche Farmacologiche‘Mario Negri’, Milan;2
Department of Clinical Sciences and Community Health, Università degli Studi di Milano, Milan, Italy;3
Institute of Social and Preventive Medicine (IUMSP), Lausanne University Hospital, Lausanne, Switzerland
Received 6 May 2013; revised 1 July 2013; accepted 2 July 2013
Background:After a peak in the late 1980s, cancer mortality in Europe has declined by∼10% in both sexes up to the early 2000s. We provide an up-to-date picture of patterns and trends in mortality from major cancers in Europe. Methods:We analyzed cancer mortality data from the World Health Organization for 25 cancer sites and 34 European countries ( plus the European Union, EU) in 2005–2009. We computed age-standardized rates (per 100 000 person-years) using the world standard population and provided an overview of trends since 1980 for major European countries, using joinpoint regression.
Results:Cancer mortality in the EU steadily declined since the late 1980s, with reductions by 1.6% per year in 2002– 2009 in men and 1% per year in 1993–2009 in women. In western Europe, rates steadily declined over the last two decades for stomach and colorectal cancer, Hodgkin lymphoma, and leukemias in both sexes, breast and (cervix) uterine cancer in women, and testicular cancer in men. In central/eastern Europe, mortality from major cancer sites has been increasing up to the late 1990s/early 2000s. In most Europe, rates have been increasing for lung cancer in women and for pancreatic cancer and soft tissue sarcomas in both sexes, while they have started to decline over recent years for multiple myeloma. In 2005–2009, there was still an over twofold difference between the highest male cancer mortality in Hungary (235.2/100 000) and the lowest one in Sweden (112.9/100 000), and a 1.7-fold one in women (from 124.4 in Denmark to 71.0/100 000 in Spain).
Conclusions:With the major exceptions of female lung cancer and pancreatic cancer in both sexes, in the last quinquennium, cancer mortality has moderately but steadily declined across Europe. However, substantial differences across countries persist, requiring targeted interventions on risk factor control, early diagnosis, and improved management and pharmacological treatment for selected cancer sites.
Key words: Europe, joinpoint analysis, mortality, neoplasms, trends
introduction
After a peak in the late 1980s, cancer mortality in Europe has declined by∼10% up to the early 2000s [1,2]. The major components of these favorable trends in men were the fall in lung and other tobacco-related neoplasms, together with the persistent decline in gastric and a more recent decline in colorectal cancer mortality rates. In women, the major contributors were the persistent decline in cervical cancer and the favorable trends in breast and colorectal cancer mortality, particularly in northern and western Europe. Favorable trends were also observed for leukemias, Hodgkin lymphoma, testicular cancer, and a few other neoplasms amenable to treatment. We have predicted that most of these trends will be maintained up to the most recent years [3].
There were, however, persistent marked differences in cancer mortality rates and trends within Europe, with generally less
favorable trends in Russia, Romania, and other central and eastern European countries, compared with western Europe [1,
4]. These unfavorable trends were in part due to a greater smoking prevalence and other unfavorable lifestyle habits in this area of the continent, but also to some delays in effective disease management, including diagnosis and therapy [5].
Monitoring of mortality patterns and trends is important for planning and evaluating programs for cancer control. Mortality is a synthetic and valid indicator which allows to assess the impact of preventive and therapeutic strategies against cancer. Moreover, it has long been available, reliable, and comparable across Europe. Thus, in order to provide an up-to-date picture of patterns and trends in mortality from major cancers in Europe, here we consider data for the quinquennium 2005– 2009, together with an overview of trends since 1980.
materials and methods
We extracted official death certification numbers for 25 cancer sites in 34 European countries for the period 1980–2009 from the World Health *Correspondence to: Dr Cristina Bosetti, Department of Epidemiology, IRCCS, Istituto di
Ricerche Farmacologiche‘Mario Negri’, Via Giuseppe La Masa 19, 20156 Milan, Italy. Tel: +39-239014-526; Fax: +39-233200231; E-mail: [email protected]
Annals of Oncology
original articles
© The Author 2013. Published by Oxford University Press on behalf of the European Society for Medical Oncology. All rights reserved. For permissions, please email: [email protected].
Organization (WHO) database as available on electronic support [6]. The European Union (EU) was defined as the 27 member states as in January 2007, with the exclusion of Cyprus, for which data were available only for a limited number of years. Data for testicular and kidney cancer in Switzerland for the years 1995–2007 were provided by the Swiss National Institute for Cancer Epidemiology and Prevention [7].
During the calendar period considered, three different revisions of the International Classification of Diseases (ICD) were used [8–10]. Classification
of cancer deaths was re-coded, for all calendar periods and countries, according to the 10th revision of the ICD. Because the change from the 8th to the 10th revision of the ICD in 1995 in Switzerland caused discontinuities in trends, Swiss data for a few neoplasms (i.e. prostate, testis, bladder, and kidney) between 1980 and 1995 were corrected using age-specific factors [11]. To improve validity and comparability of data throughout different countries, we pooled together all intestinal sites (mainly colon and rectum), all uterine cancers (cervix and corpus), all skin neoplasms (including melanoma), all non-Hodgkin lymphoma, and all connective and soft tissue sarcomas. We did not consider long-term trends in pleural mesothelioma mortality, since pleural mesothelioma was not available separately from other pleural neoplams in the 9th revision of the ICD, and the combination of the 10th ICD codes C45.0 (mesothelioma) and C38.4 (other malignant neoplasms of the pleura) is influenced by misclassification with lung cancer, thus introducing spurious trends in several countries. Neoplasms of the brain or nerves were also not considered, since for several countries it was not possible to consistently pool together subsequent revisions of the ICD. Data for liver cancer—presented only in the tables—should be taken with due caution, due to the difficulty in distinguishing primary from unspecified liver cancers in several countries [12].
In a few countries, mortality data were missing for one or more calendar years. No interpolation was made for missing data except for the definition of the EU rates, where, when data were not available for one or more years within a country, the nearest available data (i.e. generally that of the previous or subsequent year) were replicated.
We obtained estimates of the resident population, based on official censuses, from the same WHO database [6]. Population data for France in 2009 and for and Portugal and the UK in 2010 were obtained from the EUROSTAT database, since these data were not available in the WHO database [13]. From the matrices of certified deaths and resident populations, we computed age-specific rates for each 5-year age group (from 0–4 to 80–84, and≥85 years) and calendar period. We then computed age-standardized rates per 100 000 person-years (at all ages and truncated 35–64 years) using the direct method and based on the world standard population [14].
To identify significant changes in trends for the EU as a whole and 24 selected countries (excluding countries with less than 2 000 000 inhabitants and a few other entities such as Belarus, Belgium, Bulgaria, Croatia, Slovakia, because of difficulties in evaluating long-term trends), we carried out joinpoint regression analysis, which allows to identify the best-fitting points (the‘joinpoints’) where a significant change in the linear slope (in a log scale) of the trend is detected [15,16]. For each of the identified trends, we
also computed the estimated annual percent change (APC) byfitting a regression line to the natural logarithm of the rates using calendar year as a regression variable.
results
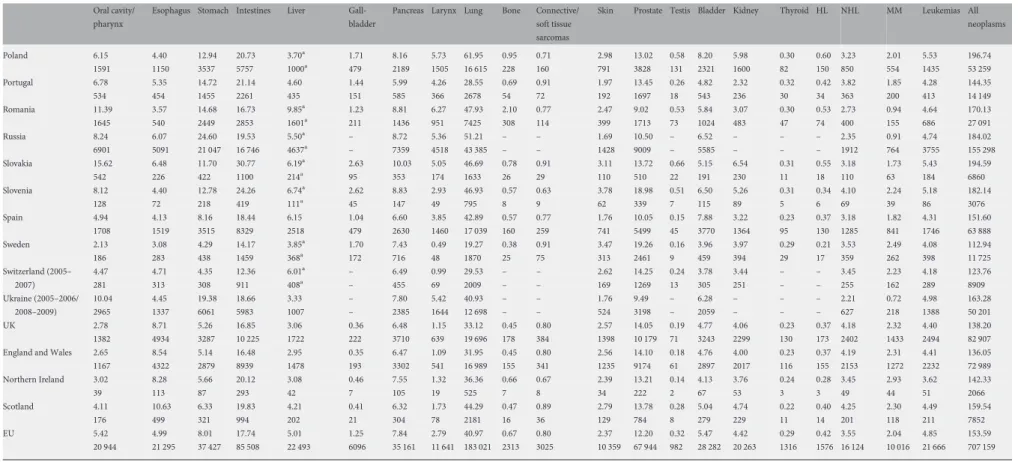
Table1gives the average annual number of deaths and the overall age-adjusted (world population) mortality rates from selected cancers per 100 000 men in 34 European countries plus the EU as a whole in 2005–2009. Male total cancer mortality rates in the EU were 153.6/100 000. The highest rates were in central and eastern European countries, including in particular
Hungary (235.2/100 000), Croatia, Poland, and Baltic countries (around 200/100 000). In Russia, total cancer mortality in men was 184.0/100 000. The highest rates in western Europe were in France, Scotland, and Denmark (around 160/100 000); other major western European countries (Spain, Italy, the UK, and Germany) had rates between 138 and 152/100 000. The lowest rates (113 to 127/100 000) were in most Nordic countries and Switzerland. With reference to major cancer sites, male mortality rates across Europe ranged from 4.3 in Sweden to 24.6/100 000 in Russia for stomach cancer, from 11.2 in Greece to 33.0/100 000 in Hungary for intestinal cancer, from 6.0 in Portugal to 11.0/100 000 in Hungary for pancreatic cancer, from 19.3 in Sweden to 72.6/100 000 in Hungary for lung cancer, and from 8.9 in Italy to 20.8/100 000 in Estonia for prostate cancer.
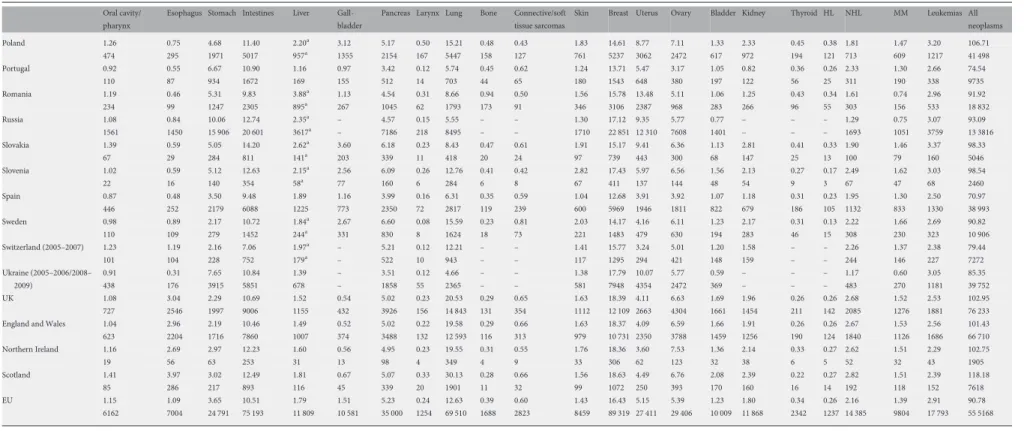
Table2gives correspondingfigures in women. Total cancer mortality rate in EU women in 2005–2009 was 90.8/100 000. The range of variation was between 71.0/100 000 in Spain and 124.4 in Denmark, but there was no clear east–west gradient. Besides Denmark, female cancer mortality rates were over 100/ 100 000 in Hungary, Poland, Ireland, the Czech Republic, the Netherlands, and the UK. The lowest rates (below 85/100 000) were in Mediterranean countries, Finland, and Belarus. Rates ranged from 1.9 in France to 10.1/100 000 in Russia for stomach cancer, from 7.1 in Switzerland to 16.6/100 000 in Hungary for intestinal cancer, from 3.5 in Belarus to 30.1/100 000 in Scotland for lung cancer, from 12.7 in Spain to 21.3/100 000 in Denmark for breast cancer, and from 3.1 in Belarus to 7.2/100 000 in the Czech Republic for pancreatic cancer.
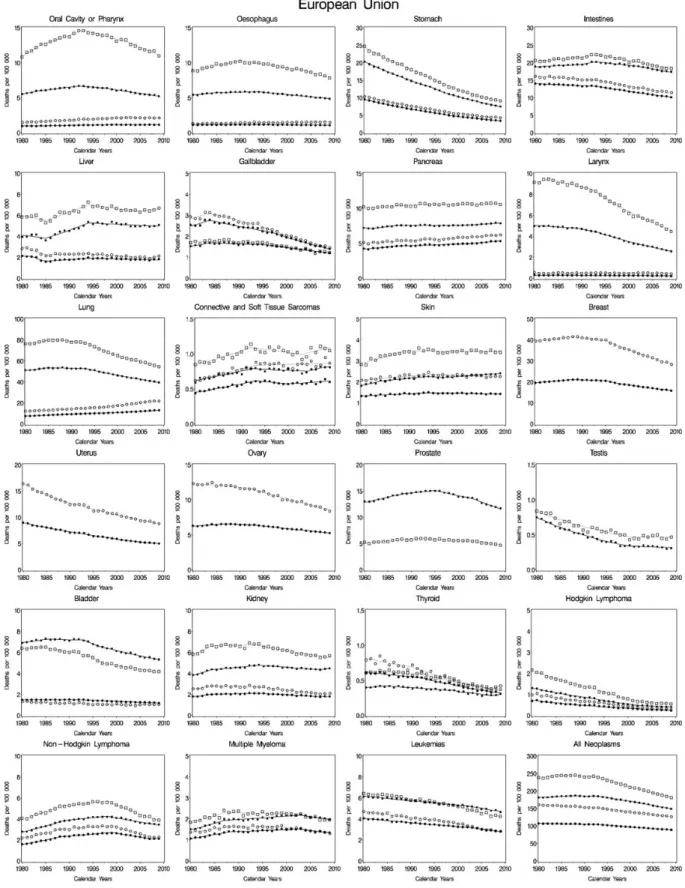
Figure1shows the joinpoint analysis of trends in mortality rates (at all ages and truncated 35 to 64 years) from 23 cancer sites plus all neoplasms in EU men and women between 1980 and 2009. Total cancer mortality in EU men reached a peak in the late 1980s and declined thereafter, with an APC of−0.1% between 1987 and 1993, of−1.2% between 1993 and 2002, and of−1.6% between 2002 and 2009 overall, and of −1.7% per year between 1993 and 2009 in middle age. In EU women, overall cancer mortality declined over most of the period considered, with an APC of about−1% between 1993 and 2009, both at all ages and in middle age. Steady declines in mortality were observed over the period 1980–2009 for stomach cancer, Hodgkin lymphoma, and leukemias in both sexes, uterine cancer in women, and testicular cancer in men. For the latter neoplasm, however, the rates tended to level off in the last decade, particularly in middle-aged men. Favorable trends were observed since the early 1990s for most other cancers
considered, with an APC of−1.3% per year between 2002 and 2009 in men and of−1.7% between 1993 and 2009 in women for intestinal cancer, of−1.8% between 1993 and 2009 for lung cancer in men, of−1.7% between 1998 and 2009 for female breast cancer, and of−2.5% between 2003 and 2009 for prostate cancer. However, mortality in the EU has still been increasing for lung cancer in women (APC = 2.2% between 2001 and 2009 at all ages, and 0.7% between 2007 and 2009 at ages 35–64), for pancreatic cancer (APC = 0.6% between 2001 and 2009 in men, and 1.2% between 2003 and 2009 in women), and for
connective and soft tissue sarcomas (APC = 1.8% between 2004 and 2009 in men, and 0.8% between 2000 and 2009 in women), while mortality has started to decline over the last years only for
original articles
Annals of OncologyTable 1. Overall age-adjusted (world population) mortality rates (first row) and average annual number of deaths (second row) from selected cancers per 100 000 men in 35 European countries plus the European Union in 2005–2009 (unless otherwise specified)
Oral cavity/ pharynx
Esophagus Stomach Intestines Liver
Gall-bladder
Pancreas Larynx Lung Bone Connective/
soft tissue sarcomas
Skin Prostate Testis Bladder Kidney Thyroid HL NHL MM Leukemias All
neoplasms ICD X C00–C14 C15 C16 C17–C21, C26 C22.0–C22.7 C23–C24 C25 C32 C33– C34 C40– C41 C47, C49 C43– C44 C61 C62 C67 C64–C66, C68 C73 C81 C82–C85, C96 C88, C90 C91–C95 C00–D48 Austria 5.29 3.88 6.64 15.87 5.81 1.35 8.86 1.76 32.35 0.39 0.96 2.94 12.37 0.35 3.77 4.04 0.41 0.36 3.53 1.91 4.96 138.33 339 264 524 1247 428 107 658 120 2338 20 62 212 1111 19 322 315 29 22 271 151 375 10 480 Belarus (2007–2009) 10.71 5.59 23.62 16.92 3.62a – 7.22 6.03 47.79 – – 1.71 12.27 – 5.03 – – – 2.47 1.36 5.89 178.04 630 330 1439 1038 214a – 433 358 2863 – – 99 783 – 320 – – – 146 82 349 10 714 Belgium 4.82 5.12 5.00 16.47 3.18 0.60 7.01 2.35 50.80 0.60 0.87 2.16 12.41 0.17 5.50 3.82 0.27 0.43 3.33 2.01 4.83 153.70 401 462 506 1742 305 67 703 209 5021 47 72 197 1474 12 608 387 26 39 331 209 466 15 425 Bulgaria 5.69 2.43 12.97 20.26 8.06 0.92 8.30 6.19 43.93 1.38 0.24 2.43 10.13 0.91 5.34 3.81 0.34 0.85 2.38 0.65 3.99 156.71 341 154 907 1456 538 67 554 380 2794 77 14 165 821 44 394 245 22 46 142 43 233 10 383 Croatia 9.48 5.02 14.05 26.97 8.27a 2.25 8.88 5.61 57.06 1.45 0.60 3.53 15.62 0.62 6.30 5.80 0.29 0.39 3.65 1.70 5.21 202.01 328 180 544 1056 313a 91 331 205 2143 46 18 123 643 16 258 212 11 13 130 66 188 7611 Czech Republic 6.77 4.48 8.46 28.67 2.80 3.00 10.75 2.92 48.10 0.70 0.73 3.24 14.39 0.55 5.75 8.75 0.32 0.43 3.24 1.83 5.39 184.01 530 365 720 2485 233 261 907 233 4036 49 52 272 1323 35 518 738 27 33 272 161 441 15 545 Denmark (2005–2006) 4.73 5.89 4.73 20.21 2.65 0.65 8.45 1.84 40.10 0.53 0.83 3.25 19.51 0.38 6.59 4.50 0.27 0.26 4.11 2.38 4.91 159.26 212 284 230 1060 123 34 413 88 2014 17 34 155 1144 14 369 223 14 11 197 126 248 8112 Estonia 8.04 5.22 17.93 20.32 4.29 1.16 10.68 3.78 54.21 1.14 0.92 3.44 20.77 0.51 6.54 7.90 0.45 0.51 2.86 2.17 6.80 198.12 72 48 172 207 42 11 103 36 533 10 7 32 224 4 70 75 5 5 29 22 66 1944 Finland 2.16 2.92 5.80 11.81 4.19 1.28 8.93 0.64 28.24 0.26 1.08 2.79 14.08 0.18 3.35 3.81 0.26 0.28 4.38 2.35 3.91 115.72 95 138 285 599 206 65 437 32 1431 10 43 134 792 5 180 188 14 10 219 122 181 5801 France 6.75 5.97 5.10 15.84 7.51 0.79 7.97 2.36 41.88 0.72 0.87 2.15 12.14 0.26 5.54 4.31 0.27 0.37 3.81 2.17 5.06 161.47 3248 3147 2997 9880 4126 507 4442 1211 22 124 321 412 1191 8996 99 3582 2551 151 168 2265 1390 3006 92 425 Germany 5.28 4.80 6.95 16.35 4.11 1.38 8.36 1.68 34.99 0.39 0.80 2.07 11.96 0.30 3.79 5.07 0.33 0.24 3.36 2.09 4.56 138.02 3713 3692 5951 14 371 3448 1222 6983 1294 29 137 221 548 1648 11 716 163 3596 4393 270 181 2873 1878 3774 116 787 Greece 1.91 1.38 6.86 11.17 8.02a 1.16 6.88 2.79 46.45 1.41 0.38 1.66 10.10 0.32 6.19 2.95 0.24 1.23 1.34 1.37 5.92 136.96 194 155 821 1455 994a 142 782 323 5202 142 38 179 1571 23 863 355 29 126 144 175 741 16 327 Hungary 18.77 7.08 12.60 33.02 6.50a 2.63 10.98 6.77 72.57 0.48 0.90 3.44 12.70 0.85 6.83 5.74 0.45 0.33 3.64 1.42 6.16 235.22 1308 514 1022 2685 502a 221 852 494 5520 29 61 269 1159 50 575 450 34 21 278 116 463 18 247 Iceland 1.42 5.28 5.05 12.60 1.58 1.29 6.83 0.51 28.17 1.01 1.24 2.24 17.23 0.75 4.53 6.03 0.80 0.76 3.05 2.10 4.30 118.34 3 12 12 31 4 3 15 2 66 2 3 5 51 1 13 14 2 2 8 6 10 293 Ireland 3.37 7.36 6.78 20.35 3.11 0.48 7.37 2.00 32.95 0.57 0.73 3.42 15.58 0.25 3.69 4.27 0.29 0.35 4.36 2.68 4.96 142.41 95 218 207 633 93 15 217 59 994 15 20 104 530 6 121 127 8 10 132 84 151 4355 Italy (2006–2009) 3.56 2.22 8.89 16.53 4.93 1.92 7.61 2.46 38.39 0.61 0.82 2.10 8.88 0.23 5.56 3.71 0.34 0.48 3.87 2.19 5.24 145.64 1963 1331 6043 11 454 3129 1352 4789 1564 25 402 270 415 1254 7473 87 4303 2430 212 237 2426 1541 3240 97 528 Latvia 7.89 5.79 19.10 19.33 4.97a 1.07 10.36 5.41 53.44 1.24 0.82 3.16 20.24 0.77 7.72 7.56 0.48 0.55 3.59 1.77 5.77 198.92 119 89 313 331 79a 17 168 84 868 17 12 49 362 10 131 121 8 8 54 29 88 3238 Lithuania 9.88 6.85 19.04 19.87 1.70 0.90 10.14 6.15 51.51 0.95 0.86 2.90 20.36 0.46 6.88 8.33 0.36 0.58 3.02 1.86 5.89 199.58 207 148 445 485 40 23 233 132 1183 19 18 64 527 9 172 191 8 12 69 44 133 4635 Luxembourg 3.62 5.21 5.28 15.81 2.02 0.66 7.56 1.85 38.10 0.35 0.99 2.13 12.21 0.32 4.28 2.19 0.32 1.17 3.20 1.51 5.57 137.85 13 19 21 62 7 3 29 6 146 1 3 8 52 1 18 9 2 4 13 6 22 535 Macedonia (2006– 2009) 3.06 1.65 15.99 15.96 8.05 1.05 7.22 6.00 45.88 1.57 0.43 4.22 9.18 0.59 5.33 2.34 0.23 0.54 1.75 0.54 4.41 151.89 41 23 231 229 116 15 101 84 636 20 6 56 137 8 79 32 3 8 22 8 57 2125 Malta 3.93 3.24 7.48 15.93 2.16 1.07 8.47 1.94 32.54 0.86 1.00 1.58 8.94 0.59 5.62 4.19 0.71 0.51 4.34 1.72 4.94 127.99 13 11 27 57 7 4 30 7 116 2 3 5 34 2 22 15 2 2 15 6 16 451 Netherlands 2.79 7.71 5.95 19.58 1.82 0.88 7.62 1.22 43.03 0.50 0.90 3.28 14.82 0.27 5.14 5.45 0.23 0.36 4.08 2.34 4.54 151.07 371 1090 881 2931 256 130 1097 172 6363 51 111 430 2420 26 808 798 33 45 580 350 626 22 210 Norway 2.29 3.23 4.55 17.51 1.69 0.67 7.28 0.77 28.66 0.33 0.57 4.72 19.35 0.31 4.60 4.02 0.33 0.16 3.82 2.91 3.85 126.82 85 131 205 796 69 29 310 33 1212 10 21 190 1063 10 237 175 14 6 167 134 164 5723 Continued Annals of Oncology
original
articles
V olume 24 | No. 10 | October 2013 doi:10.1093/annonc/mdt301 |Table 1. Continued
Oral cavity/ pharynx
Esophagus Stomach Intestines Liver
Gall-bladder
Pancreas Larynx Lung Bone Connective/
soft tissue sarcomas
Skin Prostate Testis Bladder Kidney Thyroid HL NHL MM Leukemias All
neoplasms Poland 6.15 4.40 12.94 20.73 3.70a 1.71 8.16 5.73 61.95 0.95 0.71 2.98 13.02 0.58 8.20 5.98 0.30 0.60 3.23 2.01 5.53 196.74 1591 1150 3537 5757 1000a 479 2189 1505 16 615 228 160 791 3828 131 2321 1600 82 150 850 554 1435 53 259 Portugal 6.78 5.35 14.72 21.14 4.60 1.44 5.99 4.26 28.55 0.69 0.91 1.97 13.45 0.26 4.82 2.32 0.32 0.42 3.82 1.85 4.28 144.35 534 454 1455 2261 435 151 585 366 2678 54 72 192 1697 18 543 236 30 34 363 200 413 14 149 Romania 11.39 3.57 14.68 16.73 9.85a 1.23 8.81 6.27 47.93 2.10 0.77 2.47 9.02 0.53 5.84 3.07 0.30 0.53 2.73 0.94 4.64 170.13 1645 540 2449 2853 1601a 211 1436 951 7425 308 114 399 1713 73 1024 483 47 74 400 155 686 27 091 Russia 8.24 6.07 24.60 19.53 5.50a – 8.72 5.36 51.21 – – 1.69 10.50 – 6.52 – – – 2.35 0.91 4.74 184.02 6901 5091 21 047 16 746 4637a – 7359 4518 43 385 – – 1428 9009 – 5585 – – – 1912 764 3755 155 298 Slovakia 15.62 6.48 11.70 30.77 6.19a 2.63 10.03 5.05 46.69 0.78 0.91 3.11 13.72 0.66 5.15 6.54 0.31 0.55 3.18 1.73 5.43 194.59 542 226 422 1100 214a 95 353 174 1633 26 29 110 510 22 191 230 11 18 110 63 184 6860 Slovenia 8.12 4.40 12.78 24.26 6.74a 2.62 8.83 2.93 46.93 0.57 0.63 3.78 18.98 0.51 6.50 5.26 0.31 0.34 4.10 2.24 5.18 182.14 128 72 218 419 111a 45 147 49 795 8 9 62 339 7 115 89 5 6 69 39 86 3076 Spain 4.94 4.13 8.16 18.44 6.15 1.04 6.60 3.85 42.89 0.57 0.77 1.76 10.05 0.15 7.88 3.22 0.23 0.37 3.18 1.82 4.31 151.60 1708 1519 3515 8329 2518 479 2630 1460 17 039 160 259 741 5499 45 3770 1364 95 130 1285 841 1746 63 888 Sweden 2.13 3.08 4.29 14.17 3.85a 1.70 7.43 0.49 19.27 0.38 0.91 3.47 19.26 0.16 3.96 3.97 0.29 0.21 3.53 2.49 4.08 112.94 186 283 438 1459 368a 172 716 48 1870 25 75 313 2461 9 459 394 29 17 359 262 398 11 725 Switzerland (2005– 2007) 4.47 4.71 4.35 12.36 6.01a – 6.49 0.99 29.53 – – 2.62 14.25 0.24 3.78 3.44 – – 3.45 2.23 4.18 123.76 281 313 308 911 408a – 455 69 2009 – – 169 1269 13 305 251 – – 255 162 289 8909 Ukraine (2005–2006/ 2008–2009) 10.04 4.45 19.38 18.66 3.33 – 7.80 5.42 40.93 – – 1.76 9.49 – 6.28 – – – 2.21 0.72 4.98 163.28 2965 1337 6061 5983 1007 – 2385 1644 12 698 – – 524 3198 – 2059 – – – 627 218 1388 50 201 UK 2.78 8.71 5.26 16.85 3.06 0.36 6.48 1.15 33.12 0.45 0.80 2.57 14.05 0.19 4.77 4.06 0.23 0.37 4.18 2.32 4.40 138.20 1382 4934 3287 10 225 1722 222 3710 639 19 696 178 384 1398 10 179 71 3243 2299 130 173 2402 1433 2494 82 907
England and Wales 2.65 8.54 5.14 16.48 2.95 0.35 6.47 1.09 31.95 0.45 0.80 2.56 14.10 0.18 4.76 4.00 0.23 0.37 4.19 2.31 4.41 136.05
1167 4322 2879 8939 1478 193 3302 541 16 989 155 341 1235 9174 61 2897 2017 116 155 2153 1272 2232 72 989 Northern Ireland 3.02 8.28 5.66 20.12 3.08 0.46 7.55 1.32 36.36 0.66 0.67 2.39 13.21 0.14 4.13 3.76 0.24 0.28 3.45 2.93 3.62 142.33 39 113 87 293 42 7 105 19 525 7 8 34 222 2 67 53 3 3 49 44 51 2066 Scotland 4.11 10.63 6.33 19.83 4.21 0.41 6.32 1.73 44.29 0.47 0.89 2.79 13.78 0.28 5.04 4.74 0.22 0.40 4.25 2.30 4.49 159.54 176 499 321 994 202 21 304 78 2181 16 36 129 784 8 279 229 11 14 201 118 211 7852 EU 5.42 4.99 8.01 17.74 5.01 1.25 7.84 2.79 40.97 0.67 0.80 2.37 12.20 0.32 5.47 4.42 0.29 0.42 3.55 2.04 4.85 153.59 20 944 21 295 37 427 85 508 22 493 6096 35 161 11 641 183 021 2313 3025 10 359 67 944 982 28 282 20 263 1316 1576 16 124 10 016 21 666 707 159
aIncluding unspecified liver cancers (ICD 10th C22.9 and C78.7).
HL, Hodgkin lymphoma; ICD, International Classification of Diseases; NHL, non-Hodgkin lymphoma; MM, multiple myeloma; EU, European Union.
original
articles
Annals of Oncology | Bosetti et al. V olume 24 | No. 10 | October 2013Table 2. Overall age-adjusted (world population) mortality rates (first row) and average annual number of deaths (second row) from selected cancers per 100 000 women in 35 European countries plus the European Union in 2005–2009 (unless otherwise specified)
Oral cavity/ pharynx
Esophagus Stomach Intestines Liver Gall-bladder
Pancreas Larynx Lung Bone Connective/soft tissue sarcomas
Skin Breast Uterus Ovary Bladder Kidney Thyroid HL NHL MM Leukemias All neoplasms ICD X C00–C14 C15 C16 C17–C21, C26 C22.0– C22.7 C23–C24 C25 C32 C33– C34 C40– C41 C47, C49 C43– C44 C50 C53– C55 C56– C57.4 C67 C64–C66, C68 C73 C81 C82–C85, C96 C88, C90 C91–C95 C00–D48 Austria 1.25 0.61 3.65 8.49 1.96 1.48 6.14 0.19 12.57 0.23 0.66 1.58 15.81 4.44 5.23 1.05 1.93 0.38 0.17 2.21 1.30 3.01 86.84 111 59 450 1095 219 189 712 16 1134 17 56 166 1552 439 532 160 235 48 18 271 165 340 9426 Belarus (2007–2009) 0.72 0.30 8.96 7.19 1.44a – 3.12 0.09 3.51 – – 1.46 13.88 7.70 5.18 0.47 – – – 1.36 1.17 3.48 77.00 67 34 965 803 149a – 344 9 367 – – 133 1230 681 470 63 – – – 136 119 325 7538 Belgium 1.13 1.35 2.07 10.29 1.56 0.61 5.00 0.22 13.03 0.31 0.71 1.40 19.82 4.10 5.38 1.29 1.76 0.34 0.24 2.01 1.34 3.02 89.43 121 173 322 1634 220 99 733 25 1425 32 75 167 2268 516 670 222 252 48 25 312 218 409 11 705 Bulgaria 1.26 0.39 5.85 11.86 3.51 1.09 4.37 0.29 7.46 0.76 0.23 1.39 15.81 10.37 5.79 1.11 1.32 0.31 0.36 1.43 0.49 2.80 88.06 103 36 584 1165 328 106 415 24 602 51 14 125 1272 754 448 110 115 31 22 107 40 197 7412 Croatia 0.97 0.61 5.71 13.23 3.02a 2.65 5.39 0.31 11.74 0.71 0.29 2.18 17.38 6.28 6.42 1.26 1.82 0.40 0.28 2.34 1.42 3.27 99.68 49 36 341 813 183a 165 313 15 589 32 15 113 883 320 305 84 110 24 10 123 79 164 5412 Czech Republic 1.34 0.64 4.22 13.66 1.11 4.08 7.17 0.21 13.00 0.42 0.52 1.70 15.41 7.25 6.85 1.53 3.59 0.39 0.26 2.09 1.38 3.24 105.44 139 74 524 1808 128 536 901 22 1447 40 48 198 1754 774 724 210 453 54 27 263 177 379 12 493 Denmark (2005–2006) 1.68 1.91 2.60 14.47 0.99 0.81 6.28 0.35 29.98 0.45 0.86 2.12 21.31 5.12 7.41 2.31 2.29 0.37 0.24 2.45 1.35 2.91 124.41 99 118 163 1080 60 53 408 19 1682 18 41 117 1253 300 418 176 145 23 11 164 98 200 7777 Estonia 1.17 0.43 8.37 11.22 1.81 1.39 5.80 0.17 8.09 0.30 0.65 2.41 15.65 8.13 7.01 1.07 2.56 0.48 0.23 1.69 1.40 3.84 94.08 19 8 149 229 32 27 112 3 140 5 9 39 232 124 114 24 46 11 3 33 27 66 1629 Finland 0.90 0.97 3.28 7.89 1.92 1.65 6.52 0.08 8.86 0.16 0.74 1.36 14.26 3.26 5.31 0.72 2.03 0.33 0.15 2.85 1.68 2.27 77.09 61 76 225 612 134 129 486 5 572 7 39 90 836 222 329 71 156 29 7 226 130 148 5303 France 1.17 0.97 1.90 9.13 1.69 0.72 4.79 0.22 10.33 0.38 0.64 1.30 16.95 4.25 4.71 1.04 1.47 0.26 0.20 2.17 1.39 2.87 82.04 744 747 1718 8849 1396 729 4172 141 6582 224 384 993 11 476 3067 3368 1145 1285 254 120 1997 1337 2451 64 616 Germany 1.24 1.04 3.72 10.09 1.48 1.63 5.88 0.21 12.76 0.25 0.67 1.27 17.08 3.86 5.33 1.22 2.13 0.34 0.16 2.10 1.42 2.88 89.04 1139 1124 4742 14 025 1805 2215 7408 197 12 379 192 563 1362 17 159 3985 5679 1907 2756 453 156 2673 1847 3362 102 290 Greece 0.58 0.27 3.30 7.77 3.08a 0.93 4.21 0.20 7.72 0.92 0.27 1.01 14.65 3.36 4.10 1.00 1.13 0.27 0.73 0.84 1.03 3.44 73.33 82 43 498 1266 510a 147 642 30 1010 107 29 137 1895 434 512 178 176 42 94 116 166 516 10 307 Hungary 2.92 0.96 5.70 16.56 2.27a 3.18 6.83 0.65 24.41 0.29 0.56 1.89 18.69 7.70 5.90 1.71 2.19 0.41 0.18 2.19 1.10 3.84 123.41 273 98 754 2238 293a 451 884 59 2526 26 53 222 2093 780 656 236 277 57 16 264 140 438 14 383 Iceland 1.07 1.22 2.89 8.23 1.22 0.71 5.73 – 25.34 0.48 0.50 2.06 16.36 3.00 5.21 0.77 2.34 0.61 0.24 1.80 1.51 2.14 95.21 4 4 8 26 4 3 17 – 65 1 1 5 39 8 13 3 7 2 1 5 6 6 259 Ireland 0.96 2.84 3.29 11.56 1.86 0.79 5.50 0.22 18.58 0.24 0.62 1.80 20.50 5.46 7.77 1.33 1.96 0.32 0.26 2.82 1.59 2.73 105.73 35 118 130 471 75 32 218 8 668 8 18 70 679 172 255 59 71 12 9 111 65 105 3870 Italy (2006–2009) 0.96 0.47 4.35 10.12 1.55 1.98 5.16 0.18 9.44 0.40 0.61 1.21 16.02 3.57 4.42 0.93 1.31 0.38 0.31 2.35 1.54 3.07 84.62 784 434 4347 10 183 1519 1980 5027 150 7627 221 380 934 11 945 2822 3235 1148 1259 354 188 2195 1551 2576 74 410 Latvia 1.19 0.59 7.74 11.74 1.89a 0.98 5.82 0.20 6.47 0.51 0.65 2.28 17.26 9.71 7.97 1.00 2.64 0.55 0.40 2.06 1.15 2.99 97.55 30 18 237 385 61a 34 185 5 195 11 16 64 419 248 202 42 84 18 7 56 37 88 2755 Lithuania 0.95 0.65 7.25 10.92 0.75 1.27 4.80 0.20 5.62 0.45 0.63 1.93 16.59 10.99 7.53 1.02 2.59 0.44 0.38 1.69 1.49 3.65 94.34 35 25 306 491 32 59 215 6 231 13 19 73 571 360 264 54 112 19 12 74 62 137 3659 Luxembourg 1.14 1.08 2.81 10.58 1.27 0.36 4.83 0.36 13.44 0.18 0.40 1.14 15.38 4.60 5.34 1.19 0.89 0.27 0.43 1.98 1.53 3.29 86.11 5 5 14 66 8 3 30 2 62 1 2 6 75 23 27 8 6 2 1 12 9 19 456 Macedonia (2006–2009) 0.85 0.20 7.31 10.00 4.77 1.72 4.47 0.77 8.26 0.99 0.71 2.73 16.80 7.93 4.90 1.16 1.27 0.38 0.51 1.01 0.48 2.62 89.07 14 4 125 169 79 30 74 12 129 14 9 42 260 122 75 20 19 6 8 17 7 37 1409 Malta 1.25 0.84 2.78 11.00 0.79 0.65 5.35 0.49 5.37 0.31 0.75 0.75 19.89 5.03 6.90 1.85 2.10 0.40 0.47 2.55 1.17 2.81 84.96 5 4 13 49 4 3 25 2 21 2 1 3 77 21 28 12 9 2 2 11 5 10 359 Netherlands 1.15 2.17 2.92 13.71 0.85 0.93 5.98 0.26 21.38 0.37 0.67 2.14 19.73 3.56 5.74 1.62 2.49 0.34 0.23 2.58 1.43 2.86 105.37 192 410 580 2902 154 193 1157 43 3335 46 98 335 3265 628 983 355 466 68 36 502 300 516 19 010 Norway 0.90 0.81 2.77 13.65 1.09 0.50 5.81 0.07 17.66 0.25 0.58 2.63 13.66 4.54 6.92 1.39 1.56 0.36 0.11 2.31 1.82 2.43 93.13 48 48 167 851 56 35 339 4 837 12 24 129 664 232 326 101 99 23 6 143 114 142 5097 Continued Annals of Oncology
original
articles
V olume 24 | No. 10 | October 2013 doi:10.1093/annonc/mdt301 |Table 2. Continued
Oral cavity/ pharynx
Esophagus Stomach Intestines Liver Gall-bladder
Pancreas Larynx Lung Bone Connective/soft tissue sarcomas
Skin Breast Uterus Ovary Bladder Kidney Thyroid HL NHL MM Leukemias All neoplasms Poland 1.26 0.75 4.68 11.40 2.20a 3.12 5.17 0.50 15.21 0.48 0.43 1.83 14.61 8.77 7.11 1.33 2.33 0.45 0.38 1.81 1.47 3.20 106.71 474 295 1971 5017 957a 1355 2154 167 5447 158 127 761 5237 3062 2472 617 972 194 121 713 609 1217 41 498 Portugal 0.92 0.55 6.67 10.90 1.16 0.97 3.42 0.12 5.74 0.45 0.62 1.24 13.71 5.47 3.17 1.05 0.82 0.36 0.26 2.33 1.30 2.66 74.54 110 87 934 1672 169 155 512 14 703 44 65 180 1543 648 380 197 122 56 25 311 190 338 9735 Romania 1.19 0.46 5.31 9.83 3.88a 1.13 4.54 0.31 8.66 0.94 0.50 1.56 15.78 13.48 5.11 1.06 1.25 0.43 0.34 1.61 0.74 2.96 91.92 234 99 1247 2305 895a 267 1045 62 1793 173 91 346 3106 2387 968 283 266 96 55 303 156 533 18 832 Russia 1.08 0.84 10.06 12.74 2.35a – 4.57 0.15 5.55 – – 1.30 17.12 9.35 5.77 0.77 – – – 1.29 0.75 3.07 93.09 1561 1450 15 906 20 601 3617a – 7186 218 8495 – – 1710 22 851 12 310 7608 1401 – – – 1693 1051 3759 13 3816 Slovakia 1.39 0.59 5.05 14.20 2.62a 3.60 6.18 0.23 8.43 0.47 0.61 1.91 15.17 9.41 6.36 1.13 2.81 0.41 0.33 1.90 1.46 3.37 98.33 67 29 284 811 141a 203 339 11 418 20 24 97 739 443 300 68 147 25 13 100 79 160 5046 Slovenia 1.02 0.59 5.12 12.63 2.15a 2.56 6.09 0.26 12.76 0.41 0.42 2.82 17.43 5.97 6.56 1.56 2.13 0.27 0.17 2.49 1.62 3.03 98.54 22 16 140 354 58a 77 160 6 284 6 8 67 411 137 144 48 54 9 3 67 47 68 2460 Spain 0.87 0.48 3.50 9.48 1.89 1.16 3.99 0.16 6.31 0.35 0.59 1.04 12.68 3.91 3.92 1.07 1.18 0.31 0.23 1.95 1.30 2.50 70.97 446 252 2179 6088 1225 773 2350 72 2817 119 239 600 5969 1946 1811 822 679 186 105 1132 833 1330 38 993 Sweden 0.98 0.89 2.17 10.72 1.84a 2.67 6.60 0.08 15.59 0.23 0.81 2.03 14.17 4.16 6.11 1.23 2.17 0.31 0.13 2.22 1.66 2.69 90.82 110 109 279 1452 244a 331 830 8 1624 18 73 221 1483 479 630 194 283 46 15 308 230 323 10 906 Switzerland (2005–2007) 1.23 1.19 2.16 7.06 1.97a – 5.21 0.12 12.21 – – 1.41 15.77 3.24 5.01 1.20 1.58 – – 2.26 1.37 2.38 79.44 101 104 228 752 179a – 522 10 943 – – 117 1295 294 421 148 159 – – 244 146 227 7272 Ukraine (2005–2006/2008– 2009) 0.91 0.31 7.65 10.84 1.39 – 3.51 0.12 4.66 – – 1.38 17.79 10.07 5.77 0.59 – – – 1.17 0.60 3.05 85.35 438 176 3915 5851 678 – 1858 55 2365 – – 581 7948 4354 2472 369 – – – 483 270 1181 39 752 UK 1.08 3.04 2.29 10.69 1.52 0.54 5.02 0.23 20.53 0.29 0.65 1.63 18.39 4.11 6.63 1.69 1.96 0.26 0.26 2.68 1.52 2.53 102.95 727 2546 1997 9006 1155 432 3926 156 14 843 131 354 1112 12 109 2663 4304 1661 1454 211 142 2085 1276 1881 76 233
England and Wales 1.04 2.96 2.19 10.46 1.49 0.52 5.02 0.22 19.58 0.29 0.66 1.63 18.37 4.09 6.59 1.66 1.91 0.26 0.26 2.67 1.53 2.56 101.43
623 2204 1716 7860 1007 374 3488 132 12 593 116 313 979 10 731 2350 3788 1459 1256 190 124 1840 1126 1686 66 710 Northern Ireland 1.16 2.69 2.97 12.23 1.60 0.56 4.95 0.23 19.55 0.31 0.55 1.76 18.36 3.60 7.53 1.36 2.14 0.33 0.27 2.62 1.51 2.29 102.75 19 56 63 253 31 13 98 4 349 4 9 33 306 62 123 32 38 6 5 52 32 43 1905 Scotland 1.41 3.97 3.02 12.49 1.81 0.67 5.07 0.33 30.13 0.28 0.66 1.56 18.63 4.49 6.76 2.08 2.39 0.22 0.27 2.82 1.51 2.39 118.18 85 286 217 893 116 45 339 20 1901 11 32 99 1072 250 393 170 160 16 14 192 118 152 7618 EU 1.15 1.09 3.65 10.51 1.79 1.51 5.23 0.24 12.63 0.39 0.60 1.43 16.43 5.15 5.39 1.23 1.80 0.34 0.26 2.16 1.39 2.91 90.78 6162 7004 24 791 75 193 11 809 10 581 35 000 1254 69 510 1688 2823 8459 89 319 27 411 29 406 10 009 11 868 2342 1237 14 385 9804 17 793 55 5168
aIncluding unspecified liver cancers (ICD 10th C22.9 and C78.7).
HL, Hodgkin lymphoma; ICD, International Classification of Diseases; NHL, non-Hodgkin lymphoma; MM, multiple myeloma; EU, European Union
original
articles
Annals of Oncology | Bosetti et al. V olume 24 | No. 10 | October 2013Figure 1. Joinpoint analysis of trends in age-standardized (world population) mortality rates from 23 cancer sites plus all neoplasms (malignant and benign) in the European Union, 1980–2009. Filled boxes represent men, all ages; open boxes represent men, 35–64 years; filled circles represent women, all ages; open circles represent women, 35–64 years.
Annals of Oncology
original articles
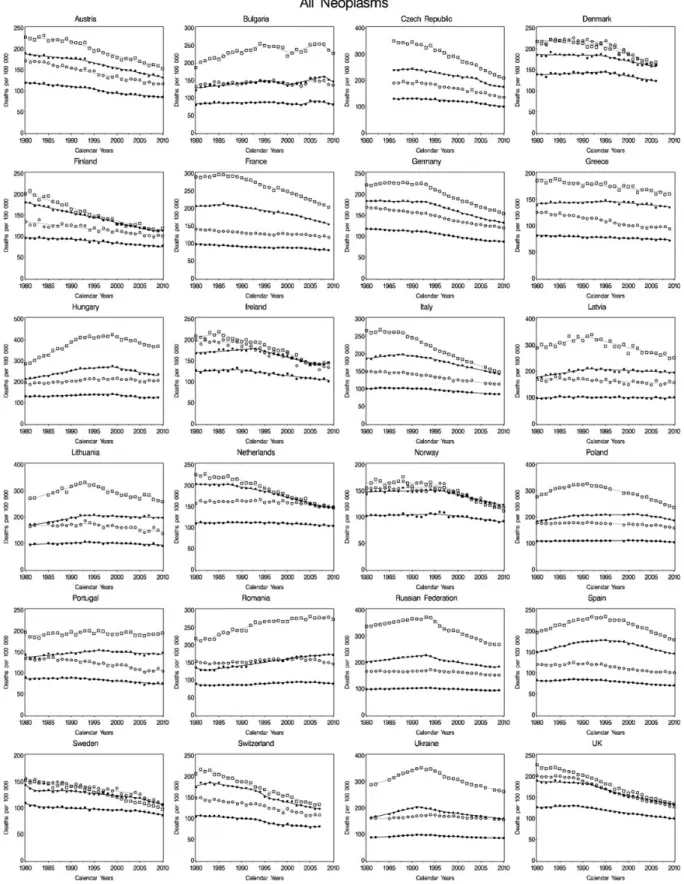
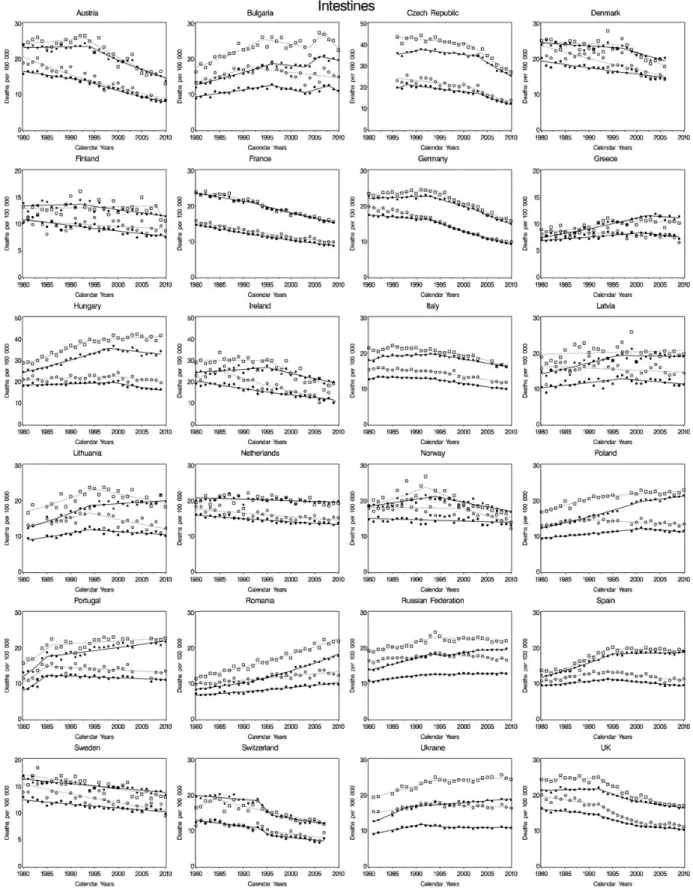
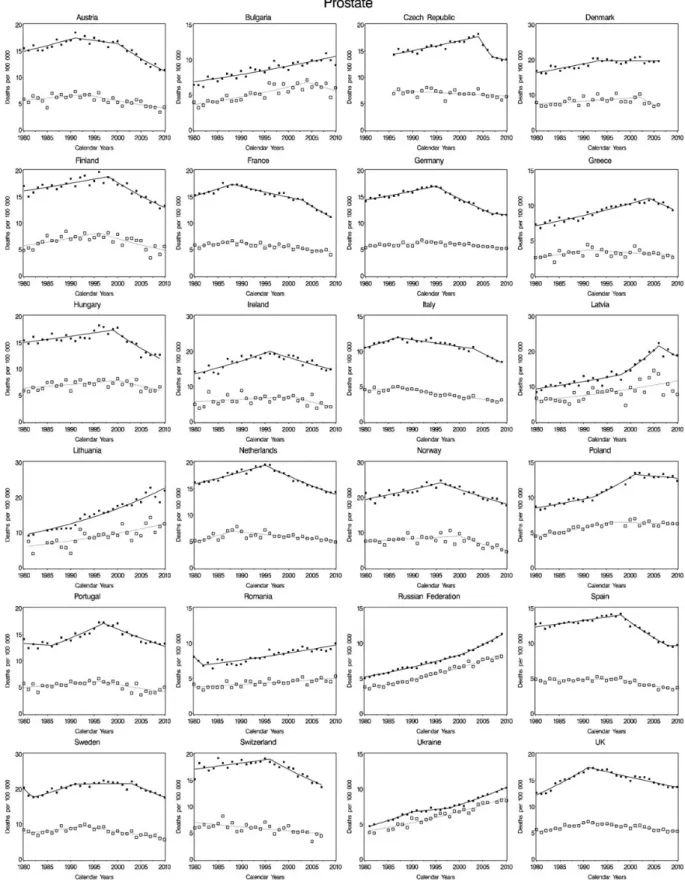
Figure 2. Joinpoint analysis of trends in age-standardized (world population) mortality rates from all neoplasms (malignant and benign) and major cancer sites (i.e. intestines, lung, breast, and prostate) in 24 selected European countries, 1980–2009. Filled boxes represent men, all ages; open boxes represent men, 35–64 years; filled circles represent women, all ages; open circles represent women, 35–64 years.
original articles
Annals of Oncologymultiple myeloma (APC =−1.6% in men and −2.1% in women between 2003 and 2009).
Figure2presents the results of the joinpoint analysis of trends in mortality rates (at all ages and truncated 35 to 64 years) from
all neoplasms (malignant and benign) and major cancer sites, i.e. intestines, lung, breast, and prostate, in 24 selected European countries between 1980 and 2009. Since the late 1980s/early 1990s, mortality from all neoplasms has been declining in most Figure 2. Continued
Annals of Oncology
original articles
European countries. The reductions started earlier (since the early 1980s) in some western and northern countries, such as Austria, Denmark, Finland, Germany, Sweden, and the UK, and more recently (since the early 2000s) in Hungary and Poland,
while in Bulgaria and Romania, mortality has been leveling off over the last years only. In most countries, trends in total cancer mortality were more favorable in middle-aged populations. Cancer mortality has been converging in men and women from Figure 2. Continued
original articles
Annals of Oncologyseveral countries, and in most recent years truncated rates in the two sexes were very similar in Nordic countries and the UK.
Mortality has been declining for cancer of the intestines (chiefly colon and rectum) since the early 1990s in most
northern and western countries, including France, Germany, Italy, and the UK, as well as in the Czech Republic, which, however, started from exceedingly high rates (Figure2). Mortality from intestinal cancer has still been increasing or only Figure 2. Continued
Annals of Oncology
original articles
leveling off over most recent calendar years, particularly in men, in some central and eastern European countries, such as Poland, Romania, and Russia, but also in Greece and Portugal, where rates were relatively low in the past. In most countries, mortality
from intestinal cancer has been more favorable in women, with earlier and larger (proportional) declines.
Mortality from lung cancer in men has long been declining in Austria, Finland, the Netherlands, Switzerland, and the UK Figure 2. Continued
original articles
Annals of Oncology(Figure2). Long-term declines in male lung cancer were observed in Sweden, too, where lung cancer has always been low. Male mortality rates had a peak in the mid/late 1980s in most other northern and western European countries and in the 1990s in several central and eastern countries, leveling off or declining thereafter. Only in Portugal and Romania, overall male lung cancer mortality was still increasing over recent years. Portuguese rates were, however, comparatively low (28.6/ 100 000). Overall and middle-age mortality from lung cancer in women increased up to recent calendar years in most European countries, the highest recent rises being in Hungary, France, and Spain. In contrast, in the Netherlands and the UK, which had high rates in the past, but also in Sweden, female lung cancer mortality has leveled off in the last few years, particularly in middle-aged women.
Mortality from breast cancer started to decline between the late 1980s and the early 1990s in most European countries, including those (Spain, Sweden, and Norway) that already had relatively low rates (below 20/100 000) in the 1990s (Figure2). The declines were generally more marked in relative terms in middle-aged women. Only in Bulgaria, Latvia, Russia, and Ukraine (which had comparatively low rates in the past) overall breast cancer rates have not declined in the last two decades, although trends were more favorable in the middle-aged. This led to a reduction of the difference in breast cancer mortality across Europe, most national overall rates being between 13 and 19/100 000 over most recent calendar years.
Mortality rates from prostate cancer have been leveling off since the mid-1990s in most countries of western Europe, including Italy, which had comparatively low rates in the past (Figure2). Declines in mortality rates have been observed more recently in the Czech Republic, Hungary, and Latvia, whereas mortality has still been rising over the most recent calendar years in other central and eastern European countries, including Poland, Romania, Russia, and Ukraine, which, however, maintained comparably low rates.
Supplementary Figure S1, available at Annals of Oncology online, gives the corresponding trends for other selected cancer sites, i.e. oral cavity or pharynx, esophagus, stomach, gall-bladder, pancreas, larynx, bone, connective and soft tissue sarcomas, skin, uterus, ovary, testis, bladder, kidney, thyroid, Hodgkin lymphoma, non-Hodgkin lymphoma, multiple myeloma, and leukemias.
discussion
In the interpretation of the data presented, problems related to random variation, which are greater in relation to smaller populations and rarer cancers, should be considered. There are also problems of death certification reliability and accuracy (validity) due to the difficulties in ascertaining and certifying the cause of death for selected cancer sites [17,18]. For some countries, coverage of the population is incomplete, and for that reason we excluded Albania, Macedonia, the Republic of Moldova, and several countries of the former Soviet Union whose national coverage was <90% [6]. Low-quality cause-of-death data have also been reported for some other countries, such as Greece, Bulgaria, and Poland [19]. However, for most countries considered, death certification is sufficiently reliable to
permit meaningful inference on trends particularly for common cancer sites, including stomach, intestines, lung, and breast particularly under age 65 years. For a few cancer sites (including bone, soft tissue sarcomas, prostate, multiple myeloma, and other lymphoid neoplasms), diagnosis and certification may be influenced by the availability of diagnostic techniques and the accuracy of death certification.
This up-to-date analysis confirms the persistence of favorable trends in mortality from cancer in most European countries [3]. Total cancer mortality in EU men reached a peak at 187/ 100 000 in1988 to decline by 20% in 2009 (149.2). Over the same calendar period, cancer mortality in women steadily declined by 16%, in the absence, however, of a peak in the late 1980s. Such a fall in cancer mortality in the EU was similar to that observed in the USA for women (−16% from 1991 to 2009), but it was smaller for men (−24%) [20].
The major contributors to the decline in total cancer mortality in men were the steady fall in lung cancer and other tobacco-related neoplasms since the late 1980s, along with the persistent decline in gastric cancer mortality, and the decline since the early 1990s in mortality from cancers of the intestines and prostate. In women, the fall in total cancer mortality has been mainly due to the decline in intestinal and breast cancer mortality since the late 1980s and the long-term reduction in mortality from cancer of the (cervix) uterus. Only mortality from female lung cancer, pancreatic cancer, and soft tissue sarcomas in both sexes was still increasing (or not declining), while mortality from multiple myeloma has started to decline in the most recent calendar years.
Trends in cancer mortality have been less favorable in central and eastern European countries, where mortality (overall and from major sites) has been increasing up to the late 1990s/early 2000s. Consequently, over recent calendar years, there still was a twofold difference between the highest rate in male cancer mortality in Hungary (253.2/100 000) and the lowest one in Sweden (112.9/100 000), and a 1.7-fold one in women (between 124.4 in Denmark and 71.0/100 000 in Spain).
The favorable trends in cancer mortality can be largely attributed to favorable changes in the exposure to specific environmental and lifestyle risk factors [1,2,21], mainly the reduction in tobacco consumption in subsequent
generations of European men (with a favorable impact on lung and other tobacco-related neoplasms) [22,23], the reduction in occupational exposure to carcinogens (lung and bladder cancer) [24], a better food conservation, and the control of Helicobacter pylori infection (gastric cancer) [25], and a more affluent and varied diet (gastric, but probably colorectal cancer) [26–28]. Alcohol consumption has been steadily declining over the last decades in countries from southern Europe, with a consequent favorable impact on oral, pharyngeal, esophageal, and laryngeal cancers in those countries. Mortality from alcohol-related cancers remains, however, exceedingly high in countries from central and eastern Europe [22,29].
Early diagnosis through opportunistic and organized screenings has likely had a role on colorectal (through fecal occult blood test,flexible sigmoidoscopy, and colonoscopy) [28,
30], breast (mammography) [31–33], and possibly prostate cancer ( prostate-specific antigen test) mortality [34,35], although the quantification of the role of diagnostic screening
Annals of Oncology
original articles
on mortality from those neoplasms (mostly for prostate cancer) is still under debate [32,36–41]. Screening has been the main responsible factor for the long-term decline in cervical cancer (through the PAP smear test and, more recently, the human papilloma virus test) particularly in countries from western and northern Europe [42], while the less widespread and/or later adoption of cervical cancer screening in central and eastern countries is likely to largely explain the less favorable trends and the persistent exceedingly high rates in those countries [4,43,44].
Improvements in disease treatment and management are likely to have appreciably contributed to the favorable trends in breast cancer (through hormonal therapies and chemotherapy, advancement in radiotherapy and surgery) [31,33,45], but also colorectal (chemotherapy and radiotherapy) [28,30] and prostate (androgen blockage, transurethral resection of the prostate, and radiotherapy) [35,41] cancer. The adoption of newer therapies has also had a marked impact toward the reduction in mortality from a few other neoplasms amenable to treatment, including testicular cancer [35,46], Hodgkin lymphoma [47], and leukemias [48]. Trends in mortality from those neoplasms have been less favorable in countries from central and eastern Europe, probably due to delays in the adoption of modern integrated therapies in those areas of the continent [5,47]. With reference to testicular cancer, in several countries of western and northern Europe where treatments for this neoplasm (namely platinum-based therapies) have been available since the 1970s and where mortality from the disease has long been declining, a leveling off in the rates has been observed in most recent calendar years, suggesting that a plateau in mortality has been reached.
The persistent increase in mortality from lung cancer in women from most European countries reflects the different pattern of tobacco smoking in women when compared with men, with a later spread in tobacco consumption [21,49]. The female lung cancer epidemic is still expanding in countries of western ( particularly France, Spain, and Switzerland) and central/eastern Europe, where smoking prevalence in women has only leveled off since the late 1990s, while the epidemic seems to have reached a plateau in the UK and the Netherlands, where smoking prevalence in women has been falling over the last few decades [50]. We predicted a persistent rise in lung cancer mortality in EU women, to reach a rate of 14.0/100 000 in 2015 [49].
The reasons for the unfavorable patterns in pancreatic cancer in Europe (as in the USA and other developed countries of the world) are not clearly understood [51,52]. Diagnostic improvements may partly or largely account for earlier rises. The reduction in male tobacco smoking prevalence (the major recognized risk factor for pancreatic cancer) [25] should have played a favorable role on mortality from this neoplasm. However, the increasing prevalence of overweight/obesity [53] and consequent type II diabetes—other two major recognized risk factors for pancreatic cancer [25]—over the last decades in many European countries have likely unfavorably influenced mortality from this neoplasm. Improved diagnosis and certification may also have contributed to the rising trends.
With the major exceptions of lung cancer in women and pancreatic cancer in both sexes, in the last quinquennium
cancer mortality has declined moderately but steadily across Europe. There are, however, persisting differences across countries which require specific attention and intervention on risk factor control, early diagnosis, and improved management.
acknowledgements
The authors thank Mrs I. Garimoldi for editorial assistance.
funding
This work was conducted with the contribution of the Italian Association for Cancer Research (AIRC Grant No. 10264) and the Swiss Leagues against Cancer, and the Swiss Foundation for Research against Cancer (KFS Grant No. 2437-08-2009).
disclosure
The authors have declared no conflicts of interest.
references
1. La Vecchia C, Bosetti C, Lucchini F et al Cancer mortality in Europe, 2000-2004, and an overview of trends since 1975. Ann Oncol 2010; 21: 1323–1360. 2. Karim-Kos HE, de Vries E, Soerjomataram I et al Recent trends of cancer in
Europe: a combined approach of incidence, survival and mortality for 17 cancer sites since the 1990s. Eur J Cancer 2008; 44: 1345–1389.
3. Malvezzi M, Bertuccio P, Levi F et al European cancer mortality predictions for the year 2013. Ann Oncol 2013; 24: 792–800.
4. Znaor A, van den Hurk C, Primic-Zakelj M et al Cancer incidence and mortality patterns in South Eastern Europe in the last decade: gaps persist compared with the rest of Europe. Eur J Cancer 2013; 49: 1683–1691.
5. Zatonski W, Didkowska J. Closing the gap: cancer in Central and Eastern Europe (CEE). Eur J Cancer 2008; 44: 1425–1437.
6. World Health Organization Statistical Information System. WHO mortality database;
http://www3.who.int/whosis/menu.cfm/(January 2013, date last accessed). 7. Lorez M, Pury P, Junker JM et al Yearly Statistics of Cancer Mortality– Urology
1988-2007. Zurich, Switzerland: University of Zurich 2010.
8. World Health Organization. International Classification of Disease: 8th Revision. Geneva: World Health Organization 1967.
9. World Health Organization. International Classification of Disease: 9th Revision. Geneva: World Health Organization 1977.
10. World Health Organization. International Classification of Disease and Related Health Problems: 10th Revision. Geneva: World Health Organization 1992. 11. Lutz JM, Pury P, Fioretta G et al The impact of coding process on observed cancer
mortality trends in Switzerland. Eur J Cancer Prev 2004; 13: 77–81. 12. Bertuccio P, Bosetti C, Levi F et al A comparison of trends in mortality from
primary liver cancer and intrahepatic cholangiocarcinoma in Europe. Ann Oncol 2013; 24: 1667–1674.
13. European Commission. Eurostat population database;http://epp.eurostat.ec. europa.eu/portal/page/portal/eurostat/home/(October 2012, date last accessed). 14. Doll R, Smith PG. Comparison between registries: age-standardized rates. In
Waterhouse JAH, Muir CS, Shanmugaratnam K et al (eds), Cancer Incidence in Five Continents, Vol. 4. IARC Science Publication No. 42. Lyon: IARC 1982; 671–675.
15. Kim HJ, Fay MP, Feuer EJ et al Permutation tests for joinpoint regression with applications to cancer rates. Stat Med 2000; 19: 335–351; Erratum in: Stat Med 2001; 20: 655.
16. National Cancer Institute. Joinpoint Regression Program, version 3.5;http://srab. cancer.gov/joinpoint/(April 2011, date last accessed).
17. Percy C, Muir C. The international comparability of cancer mortality data. Results of an international death certificate study. Am J Epidemiol 1989; 129: 934–946.
original articles
Annals of Oncology18. Percy CL, Miller BA, Gloeckler Ries LA. Effect of changes in cancer classification and the accuracy of cancer death certificates on trends in cancer mortality. Ann NY Acad Sci 1990; 609: 87–97; Discussion 97–89.
19. World Health Organization Statistical Information System. World Health Statistics 2012. Part II. Highlighted topics;http://www.who.int/gho/publications/ world_health_statistics/EN_WHS2012_Part2.pdf(June 2013, date last accessed).
20. Siegel R, Naishadham D, Jemal A. Cancer statistics, 2013. CA Cancer J Clin 2013; 63: 11–30.
21. Ferlay J, Steliarova-Foucher E, Lortet-Tieulent J et al Cancer incidence and mortality patterns in Europe: estimates for 40 countries in 2012. Eur J Cancer 2013; 49: 1374–1403.
22. World Health Organization Regional Office for Europe. Health For All Database (HFA-DB);http://data.euro.who.int/hfadb/(June 2012, date last accessed). 23. Malvezzi M, Bosetti C, Rosso T et al Lung cancer mortality in European men:
trends and predictions. Lung Cancer 2013; 80: 138–145.
24. IARC. IARC Monographs on the Evaluation of Carcinogenic Risks to Humans. Vol. 100F. A Review of Human Carcinogens: Chemical Agents and Related Occupations. Lyon: International Agency for Research on Cancer 2012. 25. Boffetta P, La Vecchia C. Neoplasms. In Detels R, Beaglehole R, Lansang MA et al
(eds), Oxford Textbook of Public Health, 5th edition. New York: Oxford University Press 2009; 997–1020.
26. World Cancer Research Fund and American Institute for Cancer Research. Food, Nutrition, Physical Activity and the Prevention of Cancer: A Global Perspective. Washington, DC: AICR 2007.
27. Malvezzi M, Bonifazi M, Bertuccio P et al An age-period-cohort analysis of gastric cancer mortality from 1950 to 2007 in Europe. Ann Epidemiol 2010; 20: 898–905.
28. Bosetti C, Levi F, Rosato V et al Recent trends in colorectal cancer mortality in Europe. Int J Cancer 2011; 129: 180–191.
29. Popova S, Rehm J, Patra J et al Comparing alcohol consumption in central and eastern Europe to other European countries. Alcohol Alcohol 2007; 42: 465–473.
30. Rougier P, Mitry E. Epidemiology, treatment and chemoprevention in colorectal cancer. Ann Oncol 2003; 14(Suppl. 2): ii3–ii5.
31. Berry DA, Cronin KA, Plevritis SK et al Effect of screening and adjuvant therapy on mortality from breast cancer. N Engl J Med 2005; 353: 1784–1792.
32. Moss SM, Nystrom L, Jonsson H et al The impact of mammographic screening on breast cancer mortality in Europe: a review of trend studies. J Med Screen 2012; 19(Suppl. 1): 26–32.
33. Bosetti C, Bertuccio P, Levi F et al The decline in breast cancer mortality in Europe: an update (to 2009). Breast 2012; 21: 77–82.
34. Bray F, Lortet-Tieulent J, Ferlay J et al Prostate cancer incidence and mortality trends in 37 European countries: an overview. Eur J Cancer 2010; 46: 3040–3052.
35. Bosetti C, Bertuccio P, Chatenoud L et al Trends in mortality from urologic cancers in Europe, 1970-2008. European Urology 2011; 60: 1–15.
36. Boyle P, Brawley OW. Prostate cancer: current evidence weighs against population screening. CA Cancer J Clin 2009; 59: 220–224.
37. Andriole GL, Crawford ED, Grubb RL, III et al Mortality results from a randomized prostate-cancer screening trial. N Engl J Med 2009; 360: 1310–1319. 38. Autier P, Boniol M, Gavin A et al Breast cancer mortality in neighbouring European
countries with different levels of screening but similar access to treatment: trend analysis of WHO mortality database. BMJ 2011; 343: d4411.
39. Beral V, Alexander M, Duffy S et al The number of women who would need to be screened regularly by mammography to prevent one death from breast cancer. J Med Screen 2011; 18: 210–212.
40. Harris R, Kinsinger LS. Less is more: not‘going the distance’ and why. J Natl Cancer Inst 2011; 103: 1726–1728.
41. Etzioni R, Gulati R, Tsodikov A et al The prostate cancer conundrum revisited: treatment changes and prostate cancer mortality declines. Cancer 2012; 118: 5955–5963.
42. Cuzick J. Long-term cervical cancer prevention strategies across the globe. Gynecol Oncol 2010; 117: S11–S14.
43. Arbyn M, Raifu AO, Autier P et al Burden of cervical cancer in Europe: estimates for 2004. Ann Oncol 2007; 18: 1708–1715.
44. Anttila A, Ronco G. Description of the national situation of cervical cancer screening in the member states of the European Union. Eur J Cancer 2009; 45: 2685–2708.
45. Jatoi I, Miller AB. Why is breast-cancer mortality declining? Lancet Oncol 2003; 4: 251–254.
46. Verhoeven RH, Gondos A, Janssen-Heijnen ML et al Testicular cancer in Europe and the USA: survival still rising among older patients. Ann Oncol 2013; 24: 508–513.
47. Bosetti C, Levi F, Ferlay J et al The recent decline in mortality from Hodgkin lymphomas in central and eastern Europe. Ann Oncol 2009; 20: 767–774. 48. Bertuccio P, Bosetti C, Malvezzi M et al Trends in mortality from leukemia in Europe: an update to 2009 and a projection to 2012. Int J Cancer 2013; 132: 427–436.
49. Bosetti C, Malvezzi M, Rosso T et al Lung cancer mortality in European women: trends and predictions. Lung Cancer 2012; 78: 171–178.
50. Pirie K, Peto R, Reeves GK et al The 21st century hazards of smoking and benefits of stopping: a prospective study of one million women in the UK. Lancet 2013; 381: 133–141.
51. Bosetti C, Bertuccio P, Negri E et al Pancreatic cancer: overview of descriptive epidemiology. Mol Carcinog 2012; 51: 3–13.
52. Jemal A, Simard EP, Dorell C et al Annual Report to the Nation on the Status of Cancer, 1975-2009, featuring the burden and trends in human papillomavirus (HPV)-associated cancers and HPV vaccination coverage levels. J Natl Cancer Inst 2013; 105: 175–201.
53. Finucane MM, Stevens GA, Cowan MJ et al National, regional, and global trends in body-mass index since 1980: systematic analysis of health examination surveys and epidemiological studies with 960 country-years and 9.1 million participants. Lancet 2011; 377: 557–567.
Annals of Oncology