Inheritance of Isoenzymes in European Beech
(Fagus sylvatica L.)
G. Muller-Starck and R. StarkeSegregation of isoenzymes was studied among 34 full-sib families of Fagus sylvatica L. by means of gel electrophoresis. Of the 16 enzyme systems analyzed, two showed substantial tissue-specific expression of isoenzymes. The remaining 14 enzyme systems are controlled genetically by at least 20 polymorphic gene loci, three of which were inferred from additional population studies. The inheritance of the com-plex system of 6PGDH is studied in detail. A 20-locus nomenclature is suggested, including 78 codominant alleles. Analyses of two-locus combinations did not reveal linkage between any of the tested gene loci.
From the Abteilung Forstgenetik und Forstpflanzen-zuchtung, Universitat Gottingen, Gottingen, Germany (Muller-Starck and Starke), and the Eidgenoss. For-schungsanstalt fur Wald, Schnee und Landschaft, CH-8903 Birmensdorf-ZH, Switzerland (Muller-Starck). The technical assistance of M. Gunther and G. Dinkel is greatly appreciated. We wish to thank F. Bergmann, H. H. Hattemer, H. R. Gregorius, M. Ziehe, and two unknown referees for very useful comments. The help of E. Gillet in the calculation of the exact levels of significance is greatly appreciated. This study was sup-ported financially by the Deutsche Forschungsge-meinschaft. Bad Godesberg, and by the Bundesminis-terium fur Forschung und Technologic Bonn. Journal of Heredity 1993;84:291-296;0022-1503/93/$5.00
European beech (Fagus sylvatica L.) cov-ers a large continuous geographic range in Europe. It is a carrier tree species of various forest ecosystems and fulfills a wide spectrum of environmental, social, and economic functions. In spite of the long tradition in silvicultural research and in the study of beech provenances, genetic characterization of beech populations started not much longer ago than one de-cade (Kim 1980). Since then, approxi-mately 300 beech populations have been studied by employing isoenzyme markers (for review see Muller-Starck et al. 1992) exclusively. Moreover, compared to many other deciduous trees or conifers, a sur-prisingly low number of gene loci has been used. There are 14 studies on genetic vari-ation in beech populvari-ations, which com-prise a total of nearly 15,000 individuals, but the majority of these individuals were genotyped on the basis of three polymor-phic loci. Two studies refer to six loci. Re-cent studies by Muller-Starck include more loci because they refer to the results of the investigation reported here.
There is little information available on the genetic control and the mode of in-heritance of isoenzymes. For the enzyme systems ACP, GOT, LAP, and PER (for no-menclature see Table 4), five enzyme cod-ing gene loci were identified by means of analysis of offspring from controlled crosses: Mendelian inheritance was ob-served for isoenzymes at the loci Acp-A and Lap-A (Kim 1979), Got, Q=Got-A in the present study), Px, (=Per-A), and Px2
(=Per-B) (Thiebaut et al. 1982). From these
five gene loci, two (Got-A, and Lap-A) re-veal tissue-unspecific expression.
Merzeau et al. (1989) analyzed segre-gation among offspring of heterozygous trees and inferred genetic control and in-heritance with respect to the loci Mdh-1,
6Pgd-l, Pgi-1 (=Mdh-B, 6Pgdh-A, Pgi-B), and
Sod-1 (SOD = superoxide dismutase). Ev-idence for other loci QAcp-1, Idh-1, Px-3, Skdh-1) could not explicitly be tested.
The objective is to proceed in verifying the inheritance of isoenzymes in beech and thus to contribute to a better use of gene markers in forest genetic studies.
Materials and Methods
Controlled Crosses
During 1980 and 1986, we performed crosses among intensively flowering trees in parks of Gottingen or its vicinity. For each crossing, a minimum of 80 cross-fer-tilized and 120 self-fercross-fer-tilized female flow-ers were isolated using water-resistant but air-permeable bags. Pollen donor trees were chosen on the basis of their isoen-zyme phenotypes (carriers of rare variants were preferred). We collected branches with male flowers a few days before pollen shedding. In order to avoid contamination by external pollen, these branches were rinsed in the greenhouse and kept sepa-rate from each other. For ripening of pol-len, temperature was 25°C and humidity was greater than 50% to prevent the break-down of the ripening process of pollen. Pollination was performed twice with
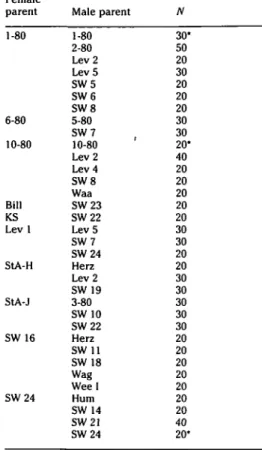
Table 1. Survey of 34 full-sib families with at least 20 analyzed embryos per cross (A)"
Table 2. Survey of electrophoretlc methods used for verification of isoenzymes in embryos, buds, young leaves, and pollen
Female parent 1-80 6-80 10-80 Bill KS Lev 1 StA-H StA-J SW 16 SW24 Male parent 1-80 2-80 Lev 2 Lev 5 SW5 SW6 SW8 5-80 SW7 10-80 Lev 2 Lev 4 SW8 Waa SW23 SW22 Lev 5 SW7 SW24 Herz Lev 2 SW19 3-80 SW 10 SW22 Herz SW 11 SW 18 Wag Weel Hum SW 14 SW21 SW24 N 30 50 20 30 20 20 20 30 30 20 40 20 20 20 20 20 30 30 20 20 30 30 30 30 30 20 20 20 20 20 20 20 40 20
Enzyme system" Buffer" Enzyme system Buffer Enzyme system Buffer
° Asterisks indicate offspring from self-fertilization.
elusion of self-fertilization and reciprocal crossings.
We collected beech nuts at the end of September and stored them for 4-6 weeks at a temperature of 3°C-5°C to overcome dormancy dependent inhibition of enzyme activity. Preliminary studies on the ger-mination capability indicated low germi-nation percentages (40%-80%). To avoid bias in the genetic analyses due to viability selection following germination, we geno-typed seeds (embryos) instead of seed-lings.
Table 1 shows the full-sib families sur-veyed with a minimum of 20 analyzed in-dividuals. Sample sizes are small because female flowers tend to be scattered in low density over the upper and outside parts of beech crowns so that crosses are ex-tremely laborious. Besides that, extraction of pollen from anthers and determination of duration of receptivity of female flowers are difficult and are not generally per-formed (Nielsen and Schaffalitzky de Muckadell 1954). Finally, losses caused by
seed parasites (Laspeyresia grossana
Haworth) cannot be avoided.
ACP ACO DIA EST GDH GOT' 1,2 3 4,3 1,2 3 2 IDH LAP MDH NDH PER 4,5 1 4,5 4,5 2 PEPCA* 6PGDH PGI PGM SKDH 4,5 3,4 1 4 4",5
No. Electrode buffer/pH Gel bufler/pH 1 0.05 M LiOH—0.19 M boric acid/8.1
2 0.06 M NaOH—0.30 M boric acid/8.0 3 0.14 M Tris—0.04 M citric acid/7.8 4 0.14 M Tris—0.04 M citric acid/7.0 5 0.14 M Tris—0.04 M citric acid/7.0
0.05 M Tris—0.01 M citric acid/8.1 (with 10% electrode buffer) (Source: Lundkvist, 1979)
0.07 M Tris—0.02 M HCI/8.7 (Source: Poulik, 1957, modified)
Diluted electrode buffer (2.5:1) Diluted electrode buffer (2.5:1)
0.04 M Tris 0.001 M EDTA and 0.05 M histidine HC1/5.7 " For designation of enzyme systems and EC no., see Table 4.
6 Electrode and gel buffers used for starch gel electrophoresis:
c = Aspartate aminotransferase (AAT).
•"Bergmann and Scholz (1989). ' Embryos.
Electrophoretic Methods
We separated enzymes from crude ho-mogenate of embryos, buds, young leaves, or pollen by standard horizontal starch gel electrophoresis. For the extraction meth-od, see Muller-Starck (1985, 1989). For composition of buffers and enzyme sys-tems see Table 2. Starch gel-concentration is 11% (microwave-supported prepara-tion), voltage distribution is 20-30 V/cm, and bridge distance is 12 cm. For DIA and PER the high-resolution power of isoelec-tric focusing (IEF) is favorable: 6% poly-acrylamide gels with mixed carrier am-pholytes (80% pH 3.5-10, 20% pH 3.5-5). Desalting of the crude extracts is sug-gested. Buffers are 0.5 M H3PO4 for the
anode and 0.5 M NaOH for the cathode. The run is started at 160 V (0.5 h prefo-cusing) and stopped after 2.5 h at approx-imately 2500 V.
For buffer formulations for enzyme stains, see Muller-Starck (1985). By omit-ting enzyme substrates parallel to the reg-ular stains, we checked for each enzyme system whether the isoenzyme variants in the zymogram in fact referred to the en-zyme system under consideration or if substrate unspecificity occurred. Tissue-specific expression of isoenzymes was studied with respect to pollen, bud, and leaf samples of 33 parental trees (see Ta-ble 1).
Segregation Studies
We verified the mode of inheritance of iso-enzymes by testing the hypothesis of
con-formity of the segregation observed among the embryos from controlled crosses with the expected Mendelian segregations. Iso-enzyme variants that followed Mendelian segregations were considered to repre-sent an allele at one of the enzyme-coding gene loci and thus to be applicable as a species-specific gene marker. Recombi-nation was tested by utilizing full-sibs with at least one double heterozygote parent. Four hypotheses were tested: regular seg-regation of (1) both locus types; (2) the single-locus types at the first gene locus; (3) the single-locus types at the second gene locus; and (4) the summed "recom-binant" and the summed "nonrecombi-nant" genotypes.
For each cross, we compared statisti-cally the observed and expected genotyp-ic segregations by determining the exact level of significance (modeled after R. A. Fischer's Exact Test of a 2 x 2 contingency table): each possible distribution of ge-notypes of the same size is generated, and its probability under the given hypothesis is calculated. All probabilities less than or equal to the probability of the observed genotypic distribution are added up to give the exact level of significance P. The hy-pothesis is rejected if P is less than or equal to a certain set value. In accordance with common usage, P > .05 is considered nonsignificant, while smaller values of P are significant with the usual number of asterisks (* = P < .05, ** = P < .01, *** = P < .001). As its name implies, this test calculates the exact level of significance
that is only approximated—for small sam-ple sizes rather poorly—by asymptotic tests of goodness-of-fit, such as x2- a nd
log-likelihood-ratio (G) tests.
Two-locus genotypes, which could not be distinguished from each other, were pooled. The number of different identifi-able two-locus genotypes was relevant for the calculation of the exact significance levels. If both parents were double het-erozygous, statistical tests were calculated for each parent separately.
Survey of Isoenzyme Polymorphism
Because the available full-sibs represent only a portion of the isoenzyme polymor-phism in beech populations, two classes of isoenzymes were surveyed: (1) isoen-zymes represented in full-sib families (see arrows in Figure 1) and (2) isoenzymes monitored in 19 beech populations, which includes 2,381 individuals (samples of air-polluted juvenile and adult populations; see Muller-Starck 1989; Muller-Starck and Ziehe 1991). Genetic types are designated by letters for gene loci and by numbers for alleles. As in Figure 1, the letter A in Table 3 and Table 6 refers to that locus, the alleles of which are apparent within the zone of the zymogram with the largest relative mobility. Succeeding letters des-ignate the following zones in decreasing order of relative mobility. The letter A is also used for enzyme systems that are ap-parently represented in the zymogram by only one zone.
Results and Discussion
Tissue-specific Expression of Isoenzymes
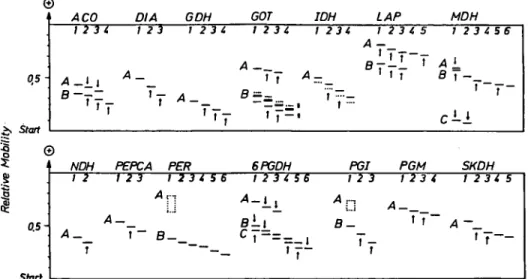
Acid phosphatases (ACP) and esterases (EST) can show variation in the isoenzyme patterns between buds, leaves, and pollen of one and the same individual to such an extent that genotyping is questionable. The same holds for embryos and succeeding seedling stages. Therefore, both systems are not generally subjects of inheritance studies. In the case of peroxidases (PER), only the fast migrating zone (Per-A) be-longs to this category, while the slow mi-grating zone (Per-B, see Figure 1) is ex-pressed tissue unspecific in buds, leaves, and seedlings, but shows very weak activ-ity in embryos.
Among the remaining enzyme systems, alterations in the expression of isoen-zymes occur as follows: the zone Lap-B (see Figure 1) is very weakly expressed in buds and leaves; Skdh-B is weakly ex-pressed also in embryos (not included in
© 0,5-£> Start
1 ©
A B A CO 12 3 4 —il~
TTr
1 i DIA 1 2 3 A _ ' 7 GDH 1 2 3 A-' 7 4 7 A B GOT 1 2 7 ~= i 3 4 7 — T~ A I t IDH 1 234 - _ A B LAP 1 2 3 t~7~~
~~7 s 7 A B C MDH ? 2 3 1 * 1L±
4 56 _ 1 i Of-Vrrf NDH 1 2 A-T PEPCA PER A-t ~ B-~— 6PGDH s i , CT = = - , 1 t A B PGI 1 2 3 t ' f PGM 12 3 4 A-t A-t ~ SKDH 12 3 4 5 A ~'
7~~
Figure 1. Isoenzyme polymorphism among full-sib families (embryos) and population samples (buds, young leaves) of Fagus sylvatica. Isoenzymes in full-sibs are marked by arrows. LAP-B is very weakly expressed in buds and leaves, PER-B in embryos. For 6PGDH see Figure 2. The scale indicates relative mobility of bands after a 4-h run under t4-he given electrop4-horetic conditions. In population studies (see Materials and Met4-hods), t4-he most frequent types were the following:
ACO: A2, DIA: A2 GDH: A3 GOT: A,, ft ft IDH: A3 LAP: A2, B2 MDH: B5, G NDH: A2 PEPCA: A2 PER: Bt 6PGDH: A2, PGI: ft ft, Q(;C,, ft) PGM: SKDH ^ 3 :A2 * = artifacts in embryos.
Figure 1). In the case of GOT, artifacts ap-pear in embryos within Got-B (see Figure 1) and weakly stained bands between this zone and the start. These bands might re-fer to a third zone, which is active only in embryos. The available material did not allow inferences on the inheritance of iso-enzymes within this Got zone. The other enzyme systems do not show tissue-spe-cific expression of isoenzymes as far as embryos, buds, leaves, and pollen tissues are concerned.
Mode of Inheritance of Isoenzymes
The available full-sib families did not re-veal segregation with respect to PEPCA and NDH. Contrary to embryo tissue, Per-B isoenzymes are clearly expressed in bud and leaf tissue of parental trees and cor-respond to the ones described by Thie-baut et al. (1982), although three more sin-gle bands were found in beech populations in Germany (Muller-Starck 1989 and un-published data).
In Figure 1, the isoenzyme
polymor-B C Alleles 1 2 3 4 — _ 5 6 — Genotypes II 12 22 11 11 22 33 II — 22 12 23 11
in
23 22 33 12 22 33 44 11 — 22 13 24 II m 24 33 44 13 — 22 44 55 II •— 22 14 25 II — 25 44 55 14 — 8 C e* c* 22 22 26 11 12 12 12 12 12 12 12 12 12 12 12 22 22 23 B 55 15 55 13 33 13 31 U 14 Al 55 15 51 45 54 45 35 15 C 66 26 66 n ii is 56 46 26 B* 11 11 12 C*Figure 2. Survey of isoenzyme patterns at 6Pgdh-B and 6Pgdh-C in fagus sylvatica and suggested genetic interpretation. Asterisks indicate alternative interpretation as a consequence of B and C bands in identical position. Brackets indicate two-locus types, where difierent associations of the respective genes in gametes result in different band patterns.
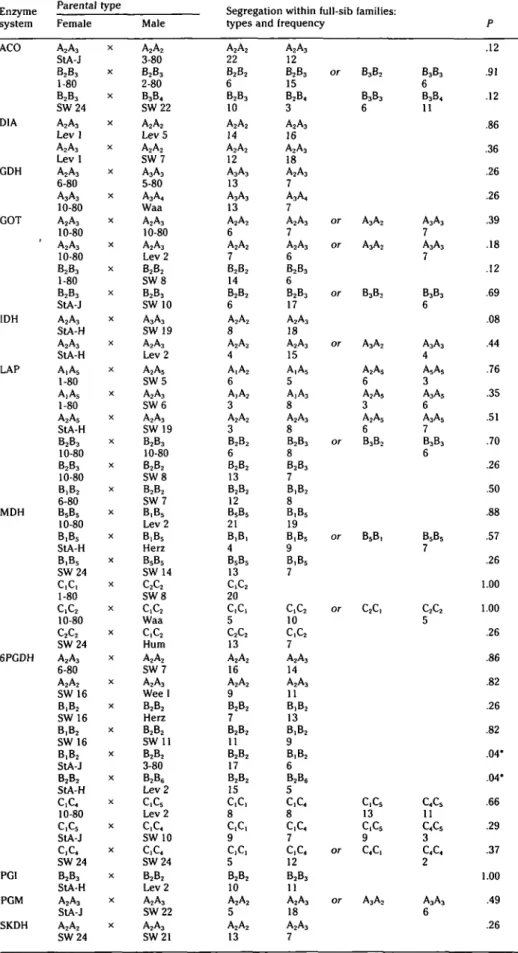
Table 3. Pbenotypes of parents and segregation among full-sib families at the embryo stage Enzyme system ACO D1A GDH GOT IDH LAP MDH 6PGDH PGI PGM SKDH Parental type Female A2A3 StA-J B2B3 1-80 B2B3 S W 2 4 A2A3 L e v l A2A3 L e v l A2A3 6-80 A3A3 10-80 A2A3 10-80 A2A3 10-80 B2B3 1-80 B2B3 StA-J A2A3 StA-H A2A3 StA-H A,A5 1-80 A,A5 1-80 A2A5 StA-H B2B3 10-80 B2B3 10-80 B,B2 6-80 B5B5 10-80 B,B5 StA-H B,B5 S W 2 4 c,c, 1-80 c,c2 10-80 c2c2 S W 2 4 A2A3 6-80 A2A2 S W 1 6 B,B2 S W 1 6 B,B2 SW 16 B,B2 StA-J B2B2 StA-H c,c4 10-80 c,c5 StA-J c,c4 S W 2 4 B2B3 StA-H A2A3 StA-J A2A2 S W 2 4 X X X X X X X X X X X X X X X X X X X X X X X X X X X X X X X X X X X X X Male A2A2 3-80 B2B3 2-80 B3B4 S W 2 2 A2A2 Lev 5 A2A2 SW7 A3A3 5-80 A3A4 Waa A2A3 10-80 A2A3 Lev 2 B2B2 S W 8 B2B3 S W 1 0 A3A3 SW 19 A2A3 Lev 2 A2A5 SW5 A2A3 SW6 A2A3 SW 19 B2B3 10-80 B2B2 SW8 B2B2 SW7 B,B5 Lev 2 B,B5 Herz B5B5 SW 14 c2c2 S W 8 c,c2 Waa C,C2 Hum A2A2 SW7 A2A3 W e e l B2B2 Herz B2B2 SW 11 B2B2 3-80 B2B6 Lev 2 c,c5 Lev 2 c,c4 SW 10 c,c4 SW24 B2B2 Lev 2 A2A3 SW22 A2A3 SW21
Segregation within full-sib families: t y p e s a n d A2A2 22 B2B2 6 B2B3 10 A2A2 14 A2A2 12 A3A3 13 A3A3 13 A2A2 6 A2A2 7 B2B2 14 B2B2 6 A2A2 8 A2A2 4 A,A2 6 A,A2 3 A2A2 3 B2B2 6 B2B2 13 B2B2 12 BSB5 21 B,B, 4 B5B5 13 c,c2 20 c,c, 5 C2C2 13 A2A2 16 A2A2 9 B2B2 7 B2B2 11 B2B2 17 B2B2 15 c,c, 8 c,c, 9 c,c, 5 B2B2 10 A2A2 5 A2A2 13 frequency A2A3 12 B2B3 15 B2B4 3 A2A3 16 A2A3 18 A2A3 7 A3A4 7 A2A3 7 A2A3 6 B2B3 6 B2B3 17 A2A3 18 A2A3 15 A,A5 5 A,A3 8 A2A3 8 B2B3 8 B2B3 7 B,B2 8 B,B5 19 B,B5 9 B,B5 7 c,c2 10 c,c2 7 A2A3 14 A2A3 11 B,B2 13 B,B2 9 B,B2 6 B2B6 5 c,c4 8 c,c4 7 c,c4 12 B2B3 11 A2A3 18 A2A3 7 or or or or or or or or or or B3B2 B3B3 6 A3A2 A3A2 B3B2 A3A2 A2A5 6 A2A5 3 A2A5 6 B3B2 B5B, C2C, c,c5 13 c,c5 9 c4c, A3A2 B3B3 6 B3B4 11 A3A3 7 A3A3 7 B3B3 6 A3A3 4 A5AS 3 A3A5 6 A3A5 7 B3B3 6 B5B5 7 C2C2 5 c4c5 11 c4c5 3 c4c4 2 A3A3 6 P .12 .91 .12 .86 .36 .26 .26 .39 .18 .12 .69 .08 .44 .76 .35 .51 .70 .26 .50 .88 .57 .26 1.00 1.00 .26 .86 .82 .26 .82 .04* .04* .66 .29 .37 1.00 .49 .26 • P < .05.
T h e s u p p o s e d g e n e loci a r e designated b y capital letters, t h e s u p p o s e d alleles b y n u m b e r s (for n o m e n c l a t u r e s e e Figure 1).
phism among full-sib families is accom-plished by isoenzymes that were moni-tored in population studies (see legend). The inheritance of the latter is suggested because each of these isoenzymes appears in single bands or combinations of bands, which does not refute the hypothesis of a phenotypic representation of homozy-gotes (single bands) or heterozyhomozy-gotes (double bands in monomeric systems, ad-ditional hybrid band(s) according to the enzyme structure) at single loci. This also holds for all combinations between the identified alleles and the suggested ones. There is no contradiction between the present interpretation and the inheritance of those systems in other tree species (see analogous segregation analyses in decid-uous trees such as poplars (Miiller-Starck 1992) and oaks (Muller-Starck and Hat-temer 1990).
Peculiarities of Enzyme Systems
Artifacts are expressed in Got-B (embry-os) and Idh-A (see Figure 1). In the case of Lap-A, former studies monitored four different isoenzyme bands (e.g., Kim 1980; Muller-Starck 1985; Thiebaut et al. 1982) instead of five. The reason is the very close location of A4 (very rare) and A5, which therefore might have been pooled in earlier investigations. MDH-A is monomorphic until now in Fagus syluatica but polymor-phic in other species (e.g., Miiller-Starck 1992). The system of PEPCA is faintly stained. PGI-A is excluded from further in-terpretation because of insufficient sub-strate specificity. Skdh-B is omitted be-cause faint staining intensity and very closely located isoenzyme variants sub-stantially impede the genetic interpreta-tion. There is an overlap between Skdh-A and Skdh-B. Under the given electropho-retic conditions, Skdh-A is intensively stained so that Skdh-B will not interfere.
Interpretation of the 6PGDH System
The most complex system is 6PGDH, be-cause 6Pgdh-B and 6Pgdh-C form inter-locus hybrids (heterodimers) and show substantial overlap. The present interpre-tation of the 6PGDH polymorphism is based on both segregation among full-sibs and population data. Figure 2 shows prob-lems related to genotyping at the loci 6Pgdh-B and 6Pgdh-C. These problems are caused by the fact that bands expressed by these loci can be located in the zy-mograms in identical or nearly identical position. Therefore, in several cases,
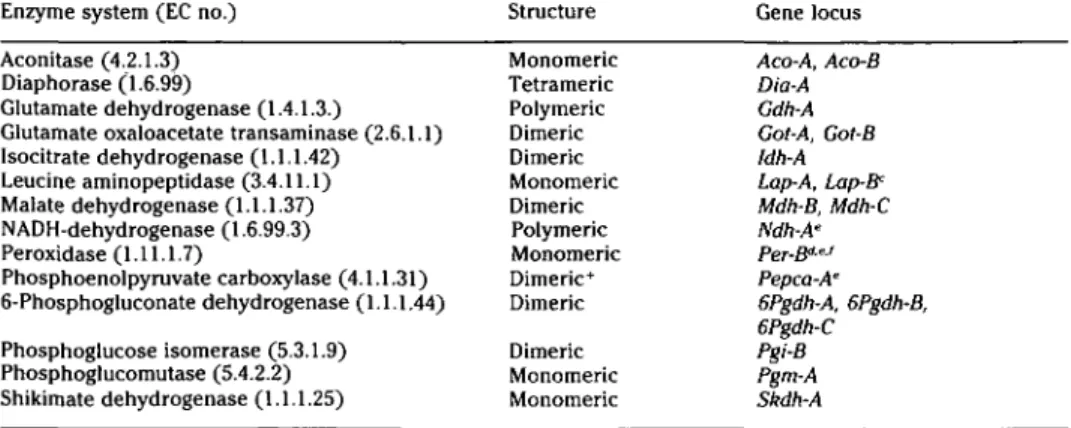
zy-Table 4. Enzyme system, enzyme structure, and enzyme coding gene loci in embryos, buds, young leaves, and pollen of Fagus sylvatica L. (ACP,° EST'', and monomorphic zones excluded)
Enzyme system (EC no.) Aconitase (4.2.1.3) Diaphorase (1.6.99)
Glutamate dehydrogenase (1.4.1.3.)
Glutamate oxaloacetate transaminase (2.6.1.1) Isocitrate dehydrogenase (1.1.1.42) Leucine aminopeptidase (3.4.11.1) Malate dehydrogenase (1.1.1.37) NADH-dehydrogenase (1.6.99.3) Peroxidase (1.11.1.7) Phosphoenolpyruvate carboxylase (4.1.1.31) 6-Phosphogluconate dehydrogenase (1.1.1.44) Phosphoglucose isomerase (5.3.1.9) Phosphoglucomutase (5.4.2.2) Shikimate dehydrogenase (1.1.1.25) Structure Monomeric Tetrameric Polymeric Dimeric Dimeric Monomeric Dimeric Polymeric Monomeric Dimeric+ Dimeric Dimeric Monomeric Monomeric Gene locus Aco-A, Aco-B Dia-A Gdh-A Got-A, Got-B Idh-A Lap-A, Lap-Be Mdh-B, Mdh-C Ndh-A' Per-B?" Pepca-A' 6Pgdh-A, 6Pgdh-B, 6Pgdh-C Pgi-B Pgm-A Skdh-A "Acid phosphatase (3.1.3.2). "Esterase (3.1.1.1). cOnly in embryos. " Not in embryos.
' Inferred from population studies (no segregation among full-sibs).
' = Px2 (Thiebaut et al. 1982).
mograms can be interpreted in two differ-ent ways. The respective alternative for genotyping at these two loci is indicated in Figure 2 by asterisks.
The given genetic interpretation of com-plex band patterns is strongly suggested because of clearly visible differences in staining intensities. This is evident partic-ularly with respect to the three-banded isoenzymes (see upper right and lower left part of Figure 2). The different intensities are a consequence of the overlap of single bands and appear clearly in the zymo-grams. The designation of the remaining band patterns follows these interpreta-tions. Visualization of zymograms was test-ed separately by employing gels with 20-cm migration distance. The segregations
in Table 3 and five other segregations within 6Pgdh-B and 6Pgdh-C (not includ-ed in Table 3 due to lack of space) did not reveal significant deviations from the ex-pected Mendelian proportions.
In Figure 2 band patterns monitored in each of the studied beech populations are surveyed. Many other two-locus combi-nations can be expected but seem to be extremely rare in beech populations. We never found two-locus types that com-prised more than eight single bands. It ap-pears that the expression of the diploid two-locus genotype is not independent from the association of the respective genes in gametes. In Figure 2 such cases are indicated by brackets. Linkage can be expected to account for this phenomenon
Table 5. Survey of tested two-locus combinations and number of available full-sib families (deviations are statistically not significant)
Gene locus Aco . Dia Gdh A A A Got . Idh A A Lap Mdh 6Pgdh Pgi Pgm Skdh C B A A Aco-A Aco-B Dia-A Gdh-A Got-A Got-B Idh-A Lap-A Lap-B Mdh-B Mdh-C 6Pgdh-A 6Pgdh-B 6Pgdh-C Pgi-B Pgm-A Skdh-A 1 1 2 11 3
but could not be tested explicitly because of the lack of heterozygous two-locus com-binations among the parental trees.
Segregation among Full-sib Families In Table 3, for each enzyme system except
NDH, PEPCA, and PER, a set of segrega-tions is listed of those isoenzyme bands marked by arrows in Figure 1. The given examples include all cases in which de-viations from the expected Mendelian seg-regations were at maximum.
With two exceptions (6PGDH-B: StA-J x 3-80, StA-H x Lev 2, see Table 3), all test-ed segregations were in statistical agree-ment with the expected Mendelian ones. If all tests are taken into account (Table 3 surveys 37 of more than 100), one would expect more than two tests to yield values less than .05 just by chance. Besides that, viability selection in early life stages can-not be excluded. Lacking viability of em-bryos may account for the weak expres-sion of bands of a few embryos so that zymograms could not unequivocally be in-terpreted. This is why the actual sample sizes of one and the same full-sib family can vary slightly among enzyme systems. All other segregations do not refute the hypothesis of a one-locus control for those isoenzyme bands that appear within the same zone in the zymograms (for 6PGDH, see the preceding discussion). It can be concluded that in all studied enzyme sys-tems homozygotes are represented in the zymograms by single bands; heterozy-gotes are represented by combinations of double bands in the case of monomeric enzyme systems, by three-banded types in dimeric systems (one hybrid band), by five-banded types in tetrameric systems (three hybrid bands), and by multibanded types in case of polymeric systems. All alleles appear to be expressed codomi-nantly. Lack of activity (null alleles) was not apparent in full-sibs but cannot be ex-cluded (for LAP, see Kim 1979).
Table 4 show 17 polymorphic loci that are part of segregation studies and three more loci (Ndh-A, Per-A, Pepca-A) in which the variation is inferred from population studies. At present, the total number of genes (alleles) monitored at these 20 loci in full-sib families and population studies is 78, or 3.9 per locus. This value exceeds the corresponding values of many other tree species (see Miiller-Starck et al. 1992).
Recombination Studies
The available two-locus combinations and the results of a testing of uniformity of the
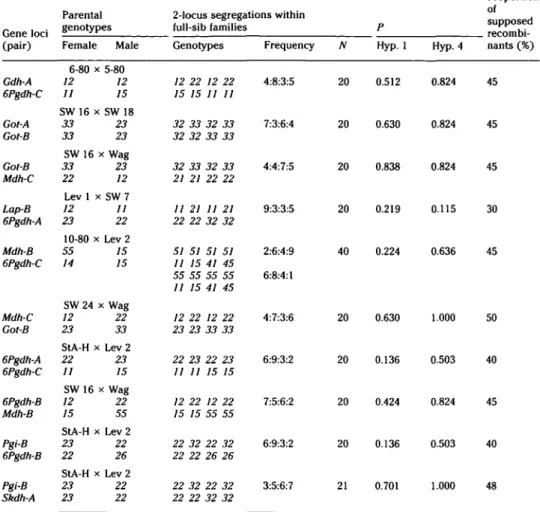
Table 6. Segregation among two-locus genotypes and results of a statistical testing of hypotheses 1 and 4
Parental
Gene loci (pair)
2-locus segregations within full-sib families
Female Male Genotypes Frequency N
Proportion of „ supposed
recombi-Hyp. 1 recombi-Hyp. 4 nants (%)
Gdh-A 6Pgdh-C Got-A Got-B Got-B Mdh-C Lap-B 6Pgdh-A Mdh-B 6Pgdh-C Mdh-C Got-B 6Pgdh-A 6Pgdh-C 6Pgdh-B Mdh-B Pgi-B 6Pgdh-B Pgi-B Skdh-A 6-80 x 5-80 12 12 11 15 SW 16 x SW 18 33 23 33 23 SW 16 x Wag 33 23 22 12 Lev 1 x SW 7 12 11 23 22 10-80 x Lev 2 55 15 14 15 SW 24 x Wag 12 22 23 33 StA-H x Lev 2 22 23 11 15 SW 16 x Wag 12 22 15 55 StA-H x Lev 2 23 22 22 26 StA-H x Lev 2 23 22 23 22 12 22 12 22 15 15 11 11 32 33 32 33 32 32 33 33 32 33 32 33 21 21 22 22 11 21 11 21 22 22 32 32 51 51 51 51 11 15 41 45 55 55 55 55 11 15 41 45 12 22 12 22 23 23 33 33 22 23 22 23 11 11 15 15 12 22 12 22 15 15 55 55 22 32 22 32 22 22 26 26 22 32 22 32 22 22 32 32 4:8:3:5 7:3:6:4 4:4:7:5 9:3:3:5 2:6:4:9 6:8:4:1 4:7:3:6 6:9:3:2 7:5:6:2 6:9:3:2 3:5:6:7 20 20 20 20 40 20 20 20 20 21 0.512 0.630 0.838 0.219 0.224 0.630 0.136 0.424 0.136 0.701 0.824 0.824 0.824 0.115 0.636 1.000 0.503 0.824 0.503 1.000 45 45 45 30 45 50 40 45 40 48
Alleles are printed in italics, observed frequencies in boldface.
two-locus genotypes are given in Table 5. A set of examples is given in Table 6.
Hypotheses 1 and 4 refer to the fre-quency distribution of all two-locus types and of the recombinant and the nonre-combinant types (see Materials and Meth-ods). For tests on hypotheses 2 and 3 see Table 3.
Because there was no two-locus segre-gation to reject hypothesis 4, recombina-tion values could not be calculated. There-fore, Table 6 shows the proportion of supposed recombinants. In most cases this value is close to 50%. Only 75 of the pos-sible 136 two-locus combinations (17 gene loci) could be analyzed, however, due to the homozygous condition of the parental trees. The main problem is the lack of hap-loid material so that, in many cases, re-ciprocal types cannot be distinguished and must be pooled. Moreover, small sample sizes severely limit the information pool of the present material.
Linkage is not indicated in the present material. A study on recombination with respect to Acp-A and Lap-A in beech (Kim 1979,1980) results in the same conclusion. As in beech, linkage could not be verified in full-sib families of Quercus petraea and Q. robur (Miiller-Starck and Hattemer 1990); this study referred to 15 loci that are also the subject here. To our knowl-edge, there are no other studies on recom-bination in the genera Fagus, Castanea, or
Quercus (n = 12 chromosomes). By em-ploying Ap-A,B,C (Ap = aminopeptidase) and Got-B, Linares Bensimon (1984) ob-served linkage between Ap-A and Ap-B in Alnus glutinosa (n = 14 chromosomes). In populations of Alnus crispa, Bousquet et al. (1987) studied the frequency of gametes in the pollen pool with respect to eight polymorphic loci (excluding Lap-A,E). A significant nonrandom association of al-leles at two-locus combinations could not be verified.
As in many other tree species, in beech further investigations are required to study recombination in more detail. At present, there is no evidence for a clustered loca-tion of the analyzed gene loci at single chromosomes.
References
Bergmann, F and Scholz F, 1989. Selection effects of air pollution in Norway spruce QPicea abies) popula-tions. In: Genetic aspects of air pollutants in forest tree populations (Scholz F, Gregorius HR, and Rudin D, eds). Berlin: Springer-Verlag; 143-160.
Bousquet JJ, Cheliak WM, and Lalonde M, 1987. Allo-zyme variation in natural populations of green alder
[Alnus crispa (Ait.) Pursh.] in Quebec. Genome
29:345-352.
Kim ZS, 1979. Inheritance of leucine aminopeptidase and acid phosphatase isoenzymes in beech (Fagus
syl-vatica L.). Silvae Genet 28:68-71.
Kim ZS, 1980. Veranderungen der genetischen Struktur von Buchenpopulationen durch Viabilitatsselektion im Keimlingsstadium. Gottingen Res Notes Forest Genet 3:1-88.
Linares Bensimon C, 1984. Versuche zur Viabilitats-selektion an Enzym-Genloci bei Alnus glutinosa (L.) Gaertn. Gottingen Res Notes Forest Genet 7:1-13. Lundkvist K, 1979. Allozyme frequency distribution in four Swedish populations of Norway spruce QPicea abies K.). Hereditas 90:127-143.
Merzeau D, Di Giusto F, Comps B, Thiebaut B, Letouzey J, and Cuguen J, 1989. Genetic control of isoenzyme systems and heterogeneity of pollen contribution in beech (_Fagus sylvatica L.). Silvae Genet 38:195-201. Muller-Starck G, 1985. Genetic differences between "tolerant" and "sensitive" beeches {Fagus sylvatica L.) in an environmentally stressed adult forest stand. Sil-vae Genet 34:241-247.
Muller-Starck G, 1989. Genetic implications of envi-ronmental stress in adult forest stands of Fagus
syl-vatica L. In: Genetic aspects of air pollutants in forest
tree populations (Scholz F, Gregorius H-R, and Rudin D, eds). Berlin: Springer-Verlag; 127-142.
Muller-Starck G, 1992. Genetic control of isoenzymes in poplars of the Tacamahaca section and hybrids. Silvae Genet 41:87-95.
Muller-Starck G, Baradat Ph, and Bergmann F, 1992. Genetic variation in European tree species. New For-ests 6:23-47.
Muller-Starck G, and Hattemer HH, 1990. Genetics and breeding of oaks. Final Report, MA 1B-0012-D. Brus-sels: Commission European Communities, DG XII. Muller-Starck G and Ziehe M, 1991. Genetic variation in populations of Fagus sylvatica L., Quercus robur L., and Quercus petraea Liebl. in Germany. In: Genetic variation in European populations of forest trees (Muller-Starck G, and Ziehe M, eds). Frankfurt: Sauer-lander's Verlag; 125-140.
Nielsen P and Schaffalitzky de Muckadell M, 1954. Flower observation and controlled pollinations in
Fa-gus. Silvae Genet 3:6-17.
Poulik M, 1957. Starch gel electrophoresis in a dis-continuous system of buffers. Nature 180:1477-1478. Thiebaut B, Lumaret R, and Vernet Ph, 1982. The bud enzymes of beech QFagus sylvatica L.): genetic dis-tinction and analysis of polymorphism in several French populations. Silvae Genet 31:51-60.