HAL Id: hal-00297645
https://hal.archives-ouvertes.fr/hal-00297645
Submitted on 8 Oct 2007
HAL is a multi-disciplinary open access
archive for the deposit and dissemination of
sci-entific research documents, whether they are
pub-lished or not. The documents may come from
teaching and research institutions in France or
abroad, or from public or private research centers.
L’archive ouverte pluridisciplinaire HAL, est
destinée au dépôt et à la diffusion de documents
scientifiques de niveau recherche, publiés ou non,
émanant des établissements d’enseignement et de
recherche français ou étrangers, des laboratoires
publics ou privés.
grasslands
C. M. J. Jacobs, A. F. G. Jacobs, F. C. Bosveld, D. M. D. Hendriks, A.
Hensen, P. S. Kroon, E. J. Moors, L. Nol, A. Schrier-Uijl, E. M. Veenendaal
To cite this version:
C. M. J. Jacobs, A. F. G. Jacobs, F. C. Bosveld, D. M. D. Hendriks, A. Hensen, et al.. Variability of
annual CO2 exchange from Dutch grasslands. Biogeosciences, European Geosciences Union, 2007, 4
(5), pp.803-816. �hal-00297645�
www.biogeosciences.net/4/803/2007/ © Author(s) 2007. This work is licensed under a Creative Commons License.
Biogeosciences
Variability of annual CO
2
exchange from Dutch grasslands
C. M. J. Jacobs1, A. F. G. Jacobs2, F. C. Bosveld3, D. M. D. Hendriks4, A. Hensen5, P. S. Kroon5, E. J. Moors1, L. Nol1,
A. Schrier-Uijl6, and E. M. Veenendaal6
1Alterra, P.O. Box 47, 6700 AA Wageningen, The Netherlands
2Wageningen University, P.O. Box 47, 6700 AA Wageningen, The Netherlands 3KNMI, P.O. Box 201, 3730 AE De Bilt, The Netherlands
4Free University, De Boelelaan 1085, 1081 HV Amsterdam, The Netherlands 5ECN, Westerduinweg 3, 1755 LE Petten, The Netherlands
6Wageningen University, Nature Conservation and Plant Ecology Group, P.O. Box 47, 6700 AA Wageningen, The Netherlands
Received: 5 April 2007 – Published in Biogeosciences Discuss.: 10 May 2007
Revised: 21 August 2007 – Accepted: 27 September 2007 – Published: 8 October 2007
Abstract. An intercomparison is made of the Net Ecosystem
Exchange of CO2, NEE, for eight Dutch grassland sites: four natural grasslands, two production grasslands and two mete-orological stations within a rotational grassland region. At all sites the NEE was determined during at least 10 months per site, using the eddy-covariance (EC) technique, but in differ-ent years. The NEE does not include any import or export other than CO2. The photosynthesis-light response analy-sis technique is used along with the respiration-temperature response technique to partition NEE into Gross Primary Pro-duction (GPP) and Ecosystem Respiration (Re)and to obtain the eco-physiological characteristics of the sites at the field scale. Annual sums of NEE, GPP and Reare then estimated using the fitted response curves with observed radiation and air temperature from a meteorological site in the centre of The Netherlands as drivers. These calculations are carried out for four years (2002–2005). Land use and management histories are not considered. The estimated annual Re for all individual sites is more or less constant per site and the average for all sites amounts to 1390±30 gC m−2a−1. The narrow uncertainty band (±2%) reflects the small differences in the mean annual air temperature. The mean annual GPP was estimated to be 1325 g C m−2a−1, and displays a much higher standard deviation, of ±110 gC m−2a−1(8%), which reflects the relatively large variation in annual solar radia-tion. The mean annual NEE amounts to –65±85 gC m−2a−1. From two sites, four-year records of CO2 flux were avail-able and analyzed (2002–2005). Using the weather record of 2005 with optimizations from the other years, the stan-dard deviation of annual GPP was estimated to be 171– 206 gC m−2a−1(8–14%), of annual Re227–247 gC m−2a−1 (14–16%) and of annual NEE 176–276 gC m−2a−1. The
Correspondence to: C. M. J. Jacobs
inter-site standard deviation was higher for GPP and Re, 534 gC m−2a−1 (37.3%) and 486 gC m−2a−1 (34.8%), re-spectively. However, the inter-site standard deviation of
NEE was similar to the interannual one, amounting to
207 gC m−2a−1. Large differences occur due to soil type. The grasslands on organic (peat) soils show a mean net re-lease of CO2 of 220±90 g C m−2a−1 while the grasslands on mineral (clay and sand) soils show a mean net uptake of CO2of 90±90 g C m−2a−1. If a weighing with the frac-tion of grassland on organic (20%) and mineral soils (80%) is applied, an average NEE of 28 ±90 g C m−2a−1is found. The results from the analysis illustrate the need for regionally specific and spatially explicit CO2emission estimates from grassland.
1 Introduction
Grasslands cover about 20% of the world’s land area (Hadley, 1993) and about 22% of the EU-25 land area (EEA, 2005). They not only constitute an important socio-economic and environmental resource, but they also affect the atmospheric energy, water and carbon budgets. Currently, it is sug-gested that grasslands demonstrate the same CO2 accumu-lation rates as forests (Hu et al., 2001). If this is correct on a long-term basis, this is of great interest in light of the dis-cussions on global warming. As such, grassland areas con-tribute significantly to the terrestrial greenhouse gas (GHG) balance (Soussana et al., 2007b). Thus, realistic estimates of greenhouse gas budgets require reliable estimates of emis-sions from grasslands.
The Net Ecosystem Exchange of CO2, NEE, usually is the largest component in the surface-atmosphere exchange of GHG at the field scale. It is commonly taken to be the starting
point in the construction of more complete GHG balances at the farm level (Soussana et al., 2007a) as well as in national GHG inventories (Brandes et al., 2007). Full accounting of the GHG balance then requires to take into account contribu-tions from other GHG, like nitrous oxide and methane, and carbon import and export by management. These contribu-tions may be included as separate subsequent steps in the construction of such a balance (see, Soussana et al., 2007a and Veenendaal et al., 2007 for examples). In this paper, we focus on the first step in the construction of GHG balances of temperate grasslands on regional to national scale, that is, an analysis of the NEE of CO2.
In national inventory reports such as required under the Kyoto Protocol by the United Nations Framework Conven-tion on Climate Change (UNFCCC) all grasslands are usu-ally shared under one so-called source/removal category with one emission factor (IPCC, 2003). Similarly, in global or re-gional carbon budget models land cover is often prescribed in terms of biomes such as “temperate grassland” with only one set of vegetation parameters (see, e.g., Friedlingstein et al., 2006). This implies that at regional to national scales, grassland is considered as one homogeneous ecosystem with a single yearly NEE. However, even within relatively small regions with uniform climatic conditions large variability in
NEE from grasslands may be expected due to differences
in soil type and water- and land-management practice (Am-mann et al., 2007; Gilmanov et al., 2007; Soussana et al., 2007a). Insight into emission variability is necessary to sup-port uncertainty estimates in inventories as well as in mod-elling studies. Identification of corresponding factors leading to such variability would even more improve the estimate by reducing the uncertainty.
The large variability of CO2 exchange of grasslands has recently been investigated on a European scale by Gilmanov et al. (2007). These authors compared data from 20 Euro-pean grasslands, covering a large range of ecophysiologi-cal and climatic conditions. Their datasets each represent 1–2 years of flux observations. Annual NEE was found to vary between a net uptake of 655 gC m−2 and a release of 164 gC m−2. Net release was observed in 4 cases, associated with organic soils.
In this paper we analyse the CO2 emission variability of grasslands in The Netherlands. About 50% of the agricul-tural land in the Netherlands consists of grassland, where ro-tational grazing is the most common land use (CBS, 2007). Grassland on organic soils plays a special role in the GHG budget from land sources in The Netherlands. A relatively large fraction of about 20% of the production grasslands in The Netherlands is located on peat soils (CBS, 2007). In the national inventory report of The Netherlands grassland is defined as all managed grasslands, natural grasslands and grasslands for recreation. The contribution of grassland to the national greenhouse gas budget is expressed by means of a single emission factor, amounting to 519 gC m−2a−1. This number includes the emission from drained organic soils
(peat soils). It has been derived from belowground carbon stock changes in such soils, as affected by water manage-ment (Brandes et al., 2007). Clearly, this emission factor is much larger than the maximum yearly emission reported by Gilmanov et al. (2007) for organic soils. It neglects inter-annual variability as well as the possible uptake of CO2by grasslands on mineral soils and in waterlogged areas. There-fore, while analysing the emission variability of Dutch grass-lands, we also attempt to analyse interannual emission vari-ability and the difference in the emission factor between or-ganic and mineral soils.
Emission variability analysis requires continuous observa-tions of GHG exchange during prolonged periods of time and for various sites to address both spatial as well as tem-poral variability of emission factors. Thanks to the gradu-ally increasing number of sites with long-term flux obser-vations based on the eddy covariance (EC) technique (Bal-docchi et al., 2001) such analyses are now within reach for carbon dioxide (CO2). In the present study eight datasets of quasi-continuous CO2 flux measurements covering at least 10 months are analysed. The datasets are all obtained in the past decade, using the EC technique. They represent con-trasting grassland sites in The Netherlands, ranging from in-tensively managed grassland to natural grassland. In contrast with Gilmanov et al. (2007), there is much less variation in the climatic conditions among the sites.
In our analysis, we first investigate CO2emission variabil-ity by establishing ecophysiological differences between the grasslands, based on the construction of ecosystem response curves, notably the photosynthesis-light and the respiration-temperature response characteristics. The contributions from ecosystem respiration Reand photosynthesis (gross primary production, GPP) can then be distinguished. To date, this approach is commonly used to analyse NEE and has proven to offer a valuable analysis tool for the detection of ecophys-iological differences among different locations (Gilmanov et al., 2007). We then estimate annual emissions using data from a meteorological station in the centre of The Nether-lands to drive the fitted ecosystem responses of the sites. This methodology may be viewed as a normalisation of the annual CO2budget with respect to climatic conditions. It allowed us to better assess the influence of ecophysiological differences between the grasslands, and to pay special attention to the difference between organic and mineral soils. Datasets from two extensively managed grassland sites covered a period of four consecutive years. Based on these data, we also esti-mated the interannual variability relative to ecophysiological differences.
Table 1. Site characteristics of the eight Dutch grassland sites. OC (%) is the organic carbon fraction in the upper 20 cm of the soil.
Name Type Soil (FAO) OC-content Fertilizer Use Land Use Year (%)
Haarweg WMO-Grassland Eutric gleyic Fluvisol 3 No Mowing 2002–2005 Cabauw WMO-Grassland Eutric Fluvisol 5 No Grazing sheep 2002–2005 Horstermeer Grassland/Wetland Eutric Histosol 20 No Semi-natural permanent 2005
grassland
Fochterloo¨erveen Natural Grassland Eutric Histosol 50 No Natural grassland 1994–1995 Haastrecht Production Grassland Eutric Fibric Histosol n/a Yes Intensively managed
per-manent grassland
2003(July)– 2004(May) Oukoop Production Grassland Fibric Eutric Histosol 15 Yes Intensively managed
per-manent grassland
2005 Stein Meadow Bird Reserve Fibric Eutric Histosol 15 No Natural grassland 2005 Lelystad Production Grassland Calcaric Eutric Fluvisol 3 Yes
(6 times a year)
Intensively managed per-manent grassland
2004
2 Materials and methods
2.1 Study sites
The Netherlands, a midlatitude coastal country, has a high frequency of rain events that are more or less evenly dis-tributed during the year. The long-term mean precipitation ranges between 730 mm a−1 (South West) and 750 mm a−1 (East) and occurs during 190±26 days a year (Jacobs et al., 2006). The long-term mean annual temperature ranges between 8.9◦C (North) and 9.5◦C (South) and the long-term mean incoming solar radiation ranges between 3400 MJ m−2a−1(Centre) and 3850 MJ m−2a−1(West).
CO2 exchange of 8 grassland sites distributed over the Netherlands is analyzed. The geographical locations of these sites are shown in Fig. 1. All sites have a so-called long po-tential growing season (above 260 days), in which the mean air temperature is above 5◦C. For example, the most eastern and coldest grassland site had a potential growing season of 305±12 days in the years 2002–2005, which is the period analyzed here.
In order the measure the CO2 fluxes, all stations are equipped with EC systems, consisting of a fast response sonic anemometer and a fast response CO2– H2O analyzer. General principles of the EC flux measurement methodol-ogy as well as processing of the data required to obtain high-quality flux estimates are described by Aubinet et al. (2000, 2003). For all sites included in this study, data treatment and quality control closely followed the guidelines in these pa-pers.
In addition to the EC devices at each site a weather sta-tion is installed, which provides 30-min averages of global radiation (Rin), net radiation, air temperature (Ta), vapour pressure, wind speed, wind direction and precipitation. The agro-meteorological station “Haarweg” in the centre of the Netherlands is equipped with an independent double meteo-rological measurement system in order to avoid gaps in the data. This makes the meteorological data from this station
suitable to estimate annual CO2budgets from the ecosystem responses (see Sects. 2.2 and 2.3).
Below a brief description is given of the various grassland sites included here. Moreover, the main characteristics of the sites are listed in Table 1. For more detailed information on the EC measurements, the reader is referred to the cited literature.
2.1.1 Haarweg station
The meteorological observatory of the Wageningen Univer-sity, Haarweg Station, is located in the centre of the Nether-lands (lat. 51◦ 58′N, long. 5◦ 38′E, altitude +7 m a.s.l.; www.met.wau.nl). The dominating plant species in this perennial grassland area are rye grass (Lolium perenne) and rough blue grass (Poa trivialis). The soil at the site is pre-dominantly heavy clay resulting from the back-swamps of the river Rhine.
Because the site is a meteorological station, the one-sided Leaf Area Index, LAI, of the terrain is kept constant as good as possible and has a numerical value of 2.9±0.3. Because there is a unique relation between the grass height and LAI (Keuning, 1988), this is done by checking the mean grass height (about 10 cm) daily, with a special grass height meter (Eijkelkamp, model NMI). About monthly the LAI is mea-sured by a plant analyzer (CID-Inc. model CI-110). During the growing season (1 May–1 November), the grass cover is mowed weekly, but keeping the minimum required LAI of 2.6. If the LAI as derived from the observed grass height ex-ceeds the maximum value of 3.2 within a week, the grass is mowed more frequently. At the measurement site the mowed grass is not removed but evenly spread over the area. CO2 flux measurements from the period 2002–2005 are analyzed here. More details about the site can be found in Jacobs et al. (2003a).
Fig. 1. Geographical distribution of the Dutch grassland study sites: 1 – Haarweg, 2 – Cabauw, 3 – Horstermeer, 4 – Fochteloo¨erveen, 5 –
Haastrecht, 6 – Oukoop, 7 – Stein, 8 – Lelystad. Shaded areas denote peat soils.
2.1.2 Fochteloo¨erveen
The Fochteloo¨erveen area is a disturbed raised bog in the north of the Netherlands (lat. 53◦00′N, long. 6◦24′E, alti-tude +11 m a.s.l.). The vegetation is a natural tussock grass-land, with an average height of approximately 0.4 m. A layer of 0.1 m of dead organic material from the previous grow-ing seasons covered the tussocks and the hollows in between. The dominating plant species is Molina caerulea (>75%) but also species like Eriophorum vaginatum, Calluna vulgaris and Erica tetralix could be found. The green LAI has a max-imum of about 1.7 in August. Throughout the seasons, the water table depth varied, depending on the weather, from 0 to 0.2 m below the tussock soil interface but the soil remained saturated. CO2fluxes were measured between June 1994 and October 1995. More details about this site can be found in Nieveen et al. (1998) and Jacobs et al. (2003b).
2.1.3 Cabauw
The Cabauw site is located on grassland in the centre of the Netherlands (lat. 51◦ 57′N, long. 4◦ 54′E, altitude – 0.7 m a.s.l.). The dominating plant species in this perennial
grassland area are Lolium perenne (40%), Poa trivialis (20%) and Alopecurus genculatus (10%). The grass is maintained by grazing of sheep and the mean LAI is about 3. The soil is a 0.7 m thick clay layer on peat. Ditches occupy 10% of the aerial surface. The water level in the ditches is kept constant during the winter half year and the summer half year respec-tively. Horizontal transport of water from the grassland to the ditches is limited. This results in considerable changes in ground water level at the central parts of the grassland throughout the year.
CO2fluxes from four consecutive years (2002–2005) are analysed here. With westerly wind, the footprint of the flux observation is partly over a neighbouring field which is bare soil in winter and maize during summer. Results from the wind direction from this area, between 177 and 317 degrees, are therefore ignored in the present study. More details about this site can be found in Beljaars and Bosveld (1997). 2.1.4 Horstermeer
The Horstermeer site is a grassland/wetland polder of a for-mer agricultural land in a drained natural lake in the centre of the Netherlands (lat. 52◦02′N, long. 5◦04′E, altitude –
2.2 m a.s.l.). The site has been taken out of agricultural pro-duction more than 10 years ago, and has developed into semi-natural grassland. The two meter thick soil consists of peat, overlain with organic-rich lake deposits and is overlying eo-lian sands of Pleistocene age. After the site has been taken out of agricultural production, the ditch water table has been raised to approximately 10 cm below the land surface. Large parts of the Horstermeer polder are subject to strong ground-water seepage from surrounding lake areas and Pleistocene ice pushed ridges. At the measurement location seepage is largely reduced and even infiltration occurs as a result of the high water table. The surface of the research area consists for 10% of ditches, for 20% of land that is saturated year-round (mostly alongside the ditches) and for 70% of relatively dry land with a fluctuating water table (between 0 to 40 cm be-low the soil surface) and an aerated top-layer. Management consists only of regulation of the ditch water table; no cattle grazing or harvesting takes place, the only removal of vegeta-tion consists of sporadic grazing by roe deer. Vegetavegeta-tion con-sists of different types of grasses (dominant species Holcus
lanatus, Phalaris arundinacea, Glyceria fluitans), horsetail
(Equisetum palustre, fluviatile) reeds (Phragmites australis,
Typha latifolia) and high forbs (Urtica diocia, Cirsium ar-vense, palustre). Measurements of CO2fluxes from the year 2005 are included in the present study. More details about this site can be found in Hendriks et al. (2007).
2.1.5 Haastrecht
The Haastrecht site is a grassland polder in the centre of the Netherlands (lat. 52◦00′N, long. 4◦48′E, altitude −1.4 m a.s.l.). The dominating plant species in this perennial grass-land area are Lolium perenne and Poa trivialis. The soil at the site is predominantly a peat soil. The water table is kept constant with a level of –1.6 m during the summer season and –1.8 m during the winter season. The grass at the measure-ment site is maintained by grazing of sheep.
CO2 flux measurements were performed from July 2003 until May 2004. Eddy covariance devices were mounted at a height of 4 m. Windspeed was measured using a sonic anemometer (Gill R3-50). Air temperature was also derived from this instrument. CO2concentration was measured with an open path H2O/CO2sensor (LICOR, Li-7500). Support-ing measurements include observations of incomSupport-ing short-wave radiation, using a pyranometer (Kipp & Zonen, CM21). The direct surroundings of the measurement site are agricul-tural grasslands with rotational grazing by cows and sheep. The fetch in the direction of the prevailing winds (South-West to (South-West) is about 5 km.
2.1.6 Stein
The Stein site is a polder in the west of the Netherlands (lat. 52◦ 01′N, long. 4◦ 46′E, altitude –1.6 m a.s.l.). The polder was used as grass production land and during the past
20 years the area has gradually become a meadow bird re-serve. The dominating plant species in this perennial grass-land area are Lolium perenne and Poa trivialis. Vernal grass
(Anthoxantum odoratum) and sour dock (Rumex acetosa),
however, are becoming more abundant. The soil at the site is a clayey peat or peaty clay of about 25 cm thickness on a 12 m thick peat layer. About 15% of the area is open wa-ter (ditches or low parts in the landscape). CO2 flux mea-surements were conducted from 2004 onwards. More details about this site can be found in Veenendaal et al. (2007). 2.1.7 Oukoop
The Oukoop site is a grassland polder in the west of the Netherlands (lat. 52◦ 02′N, long. 4◦ 47′E, altitude – 1.8 m a.s.l.). The grassland site is part of an intensive dairy farm with rotational grazing during the summer period (mid-May–mid-September). The dominating plant species in this perennial grassland area are Lolium perenne and Poa
trivi-alis. Manure and fertilizers are applied two or three times
a year, but not during winter time. The area is about 4 km South-West of the Stein location and has the same soil characteristics. CO2 flux measurements started in 2004. More details about this site can be found in Veenendaal et al. (2007).
2.1.8 Lelystad
The Lelystad site is a grassland site in the centre of the Netherlands (lat. 52◦31′N, long. 5◦35′E, altitude 0 m a.s.l.). The site is located in the Flevopolder, an area reclaimed from Lake IJssel in 1965. The soil consists of young sea clay. The groundwater table is maintained at about 1 m below the ground surface, but it can be higher during periods of rain. The grassland site is part of an experimental farm “De Wai-boerhoeve” with intensive management with 5-6 harvests a year. Grass was removed from the field either by cutting or by grazing. The farm has a total number of 400 cows and 500 sheep. Manure and fertilizers are applied about six times a year, but not during winter time. CO2flux observations from the period July 2003 until June 2004 are analyzed here. More details about this site can be found in Gilmanov et al. (2007). 2.2 Net Ecosystem Exchange (NEE) and Ecosystem
Res-piration (Re)
The Net Ecosystem Exchange, NEE, is the result of photo-synthetic uptake, GPP, and the ecosystem respiration, Re. Using the ecological sign convention with photosynthetic up-take defined positive, we have:
N EE = GP P − Re (1)
During nighttime, only respiration occurs which enables analyses based on a distinction between daytime (downward
solar radiation Rin>0) and nighttime (Rin=0) fluxes. For nighttime Eq. (1) reduces to:
N EE = −Re= −Rnight (2) Temperature is an important driving variable of respiration. This relation is usually expressed by means of, for example, an Arrhenius-type relation. Here, we apply the following equation to analyze the response of respiration to tempera-ture (Lloyd and Taylor, 1994):
Re=R10exp(Ea( 1 10 − T0 − 1 T − T0 )) (3)
where R10 (µmol m−2s−1)is the reference respiration at a reference temperature of 10◦C (the numerical value appear-ing in the equation), T (◦C) is temperature, Ea (K) is a the so-called ecosystem activation energy or sensitivity coeffi-cient, and T0=−46.02◦C is the zero respiration temperature, denoting the temperature below which there is no respira-tion anymore. Temperature T in (3) may be soil temperature
Ts or air temperature Ta. Usually, Ts is chosen to be the driving variable in (3). However, Reoriginates from the soil and the vegetation, representing a complex interplay between various aboveground and belowground processes. Photosyn-thesis and some of the processes contributing to ecosystem respiration may be intimately linked at various time and spa-tial scales (Hartley et al., 2006). Because photosynthesis is driven by aboveground temperatures, it need not be surpris-ing that the fraction of variance in Reexplained by (3) using either Taor Tsdoes usually not differ much. For forest in par-ticular, even slightly better correlations have been reported using Ta (Reichstein et al., 2005; Ruppert et al., 2006). Moreover, Van Dijk and Dolman (2004) found that using Ta gives much more consistent results in inter-site comparisons, which they suggested to be due to problems and inconsisten-cies in the measurement of Ts. Although they analysed Re of forest, the latter argument applies to other ecosystems as well. Because of the aforementioned arguments we decided to use Ta instead of Ts. In contrast with Ta that is readily observed, Ts is not available at all sites. Therefore, using
Taassures an analysis that is similar for all sites, that is, an analysis based on the same driving variables for all sites.
From the nighttime flux data we excluded those ob-tained during precipitation events. Furthermore, it was re-quired that friction velocity u∗>0.1 m s−1. During relatively calm stable nights turbulence is suppressed and the eddy-covariances become ill-defined since these conditions are non-stationary and non-homogeneous. It appears that the cri-terion u∗≤0.1 m s−1is an appropriate threshold for not ap-plying the eddy-covariance technique (Van de Wiel et al., 2003). Indeed, analysis of the Haarweg data showed that the uncertainty in Re due to uncertainty in the fitted pa-rameters was less than 3% for 3 out of 4 years as long as
u∗>0.1 m s−1, but only increased to about 7% in one case (2003).
To determine the responses of Reto temperature, the data from one entire year were averaged in Tabins with an equal number of data. Equation (3) was then fitted to the bin aver-ages, by optimizing the reference respiration, R10 as well as
Ea(Ruppert et al., 2006). Annual sums of the respiration are then estimated by applying Eq. (3), with observed Ta from Haarweg as the driving variable.
The base respiration R10and sensitivity coefficient Eaare probably influenced by soil moisture as well (Reichstein et al., 2005). Similarly, changes in ecosystem characteristics may affect Re. To deal with these effects, the optimization may be carried out for separate, shorter periods of time. Tests with separate optimizations per period of half a month for the year 2005 showed that the effect on the annual sums of
Re varies from minor (48 gC m−2a−1 or 3% in the case of Cabauw) to considerable (205 gC m−2a−1or 22% in the case of Lelystad). However, the numbers are then based on some-times meaningless fits, with negative or very low correlations between model and data, with sometimes spurious behavior of R10. Furthermore, for some sites gaps of a few months per year occurred, which implies additional uncertainty in inter-site comparisons, with results that cannot be compared any-more. Considering our goal, that is, to provide an estimate of the differences at an annual basis, it may therefore be ar-gued that such a refined analysis does not necessarily imply a more reliable result. Therefore, it was decided to restrict our analyses to periods of one entire year.
2.3 Photosynthetic uptake (GPP)
There are two major light-use efficiency characteristics used in literature; the physiological one and the ecological one. Here we use the ecological light-use efficiency because these characteristics match the scale of our analysis (Gilmanov et al., 2007). The daytime data (Rin>0) are used to make an as-sessment of the light-response curves at the ecosystem scale. Again, data during episodes of precipitation are discarded. The data were stratified in Taclasses of 5◦C and per temper-ature class the data were binned into 10 light intensity classes of equal numbers of data. Light response curves were then fitted to the light-bin averages, using the rectangular hyper-bola (Goudriaan and Van Laar, 1994):
N EE + Re =GP P=
αRinGP Pmax
αRin+GP Pmax
(4) where Rin(W m−2)is the incoming short wave radiation, α (µmol J−1)is the actual light conversion factor and GPPmax (µmol m−2 s−1) is the maximum gross assimilation rate.
GPPmax is an asymptotic value that varies during the sea-sons and for different ecosystems. However, it often does not saturate within a realistic range of radiation intensities, espe-cially in cases where the response tends to be linear, or if no observations are available beyond the quasi-linear section of the curves. In such cases, the fitted GPPmaxis not a realistic measure of maximum gross assimilation rates. Therefore, in
order to obtain a more realistic comparison between differ-ent sites we follow Ammann et al. (2007) and use GPP1000 instead. This parameter denotes the gross assimilation rate at a solar light intensity of Rin=1000 W m−2, derived from the fitted response function (4). As such, GPP1000can be inter-preted as a measure of the so-called light saturation point for the various ecosystems. An alternative would be to reformu-late (4) in terms of GPP1000(Falge et al, 2001).
The stratification in temperature classes accounts for the effect of temperature on the photosynthesis. In addition pho-tosynthesis may be affected by the humidity of the air, due to stomatal closure under dry atmospheric conditions. How-ever, humidity deficit and temperature are strongly corre-lated in particular at the upper temperature ranges above the photosynthetic temperature optimum. Consequently, at the ecosystem scale, accounting for humidity differences as well has only a small effect on the annual sums in practice, in particular if the temperature bins are reduced. Similarly, as suggested by Ruppert et al. (2006) ecosystem characteristics affecting the light response may be correlated with temper-ature at seasonal timescales. In particular LAI may have an impact on the light response of the grasslands, which appears to be a linear impact for the Stein and Oukoop sites (Veenen-daal et al., 2007). Therefore, at sites with significant cuts in LAI that are independent of temperature we assumed that only the uncertainty of the average light response curves will be increased. However, at the longer timescales considered here, for sites with less intensive management, LAI may also show some correlation with temperature as well. Yet some other sites have almost constant LAI at seasonal time scales. Therefore, and because our data did not allow further stratifi-cation in LAI for all the sites, we decided to only stratify our data in temperature classes. Tests were performed with tem-perature bins reduced to 2 K. The scatter in the fitted param-eters increased, but differences of <1% (∼15 gC m−2a−1)
were found with respect to the annual sums of GPP. There-fore, Tabins of 5 K were used.
3 Results and discussion
3.1 Respiration characteristics
First, the nighttime fluxes of all grassland stations are ana-lyzed in order to obtain the reference respiration, R10, and the activation energy, Ea. Figure 2 shows the results from this analysis for the individual sites, as well as the mean pa-rameter value from all the sites. In the case of Haarweg and Cabauw, the mean of 4 years has been plotted. Error bars denote the standard deviation.
It can be seen that the Stein and Oukoop locations be-have more or less similar in their respiration characteris-tics. Both stations are situated in the same area and have nearly the same history. Only during the past 20 years the Stein site is gradually subjected to a changing management
0 1 2 3 4 5 6 Cab auw Foch telo oërv een Haa rweg Haa stre cht Hor ster mee r Lely stad Ouk oopStein Mea n R1 0 ( µ m o l m -2 s -1 ) 0 100 200 300 400 500 600 Cab auw Foch telo oërv een Haa rweg Haa stre cht Hor ster mee r Lely stad Ouk oopStein Mean Ea (K )
Fig. 2. The reference respiration, R10, and the ecosystem activation energy, Ea, for the various grassland stations. For the Haarweg and Cabauw sites, the standard deviations have been indicated for the four measurement years.
regime, from intensively managed grassland into a meadow bird reserve. Apparently, this change has hardly affected the respiration characteristics until today. Second, we infer from Fig. 2 that the Fochteloo¨erveen and Horstermeer grass-land/wetland locations deviate most from all other locations. The Fochteloo¨erveen area is a natural bog area. In sum-mertime only, there is green vegetation with a very low LAI (about 1.7) and with a relatively high water table ranging be-tween −0.0 m (wintertime) and –0.2 m (summertime) below the tussock soil interface. The Horstermeer area is a grass-land/wetland area that is taken out of production for more than 10 years and has been developed into a semi-natural grassland/wetland. Also here the water table is relatively high and ranges between −0.4 (summertime) and −0.0 m (wintertime). As a consequence, at both locations the aer-ation of the uppermost soil layer is probably reduced, which then limits the respiration. In peat areas where the water ta-ble is usually close to the ground surface, this phenomenon may then result in a close relation between the water table
0 5 10 15 20 0 5 10 15 20 25 Air Temperature (oC) R e ( μ m o l m -2 s -1) Mean Haarweg (r^2 = 0.20) Cabauw1 (r^2 = 0.26) Horstermeer (r^2 = 0.17) Oukoop (r^2 = 0.34) Stein (r^2 = 0.34) Fochtelooerveen (r^2 = 0.28) Haastrecht (r^2 = 0.21) Lelystad (r^2 = 0.13) 5
Fig. 3. The air temperature dependency of the respiration of all
grassland locations along with the averaged values and standard de-viations. For each site, the goodness of fit (r2)of the respiration model (3) to the individual data points has been indicated in the legend (rˆ2).
depth and respiration (Lloyd, 2006). In places with a less direct coupling between soil moisture content of the upper layer and the depth of the groundwater table, such a relation may be very weak or absent (Lafleur et al., 2005; Nieveen et al., 2005).
For the Haarweg and Cabauw sites, observations from four complete years (2002–2005) are available. To get insight into the interannual variation of R10and Ea, their standard devia-tions have been calculated for both sites and plotted in Fig. 2 as well. These standard deviations can then be compared with the standard deviation from the average of all sites. In the case of Haarweg, the standard deviation in R10 amounts to 0.66 µmol m−2s−1(15% of the average from four years), while it is 39 K in Ea(18%). For Cabauw, the standard devia-tions are 0.46 µmol m−2s−1(14%) and 39 K (13%), respec-tively. This is much less than the standard deviations from all sites: 1.37 µmol m−2s−1for R10(31%) and 125 K (41%) for Ea, respectively. Assuming similar variability character-istics for all sites, these estimates of interannual variability imply an error of ∼15% in estimates of annual respiration if we apply the respiration characteristics calculated from 1 year observations to all other years (also see Sect. 3.3).
To have some idea of the mutual respiration differences be-tween all eight grasslands, the fitted respiration curves of all sites have been plotted in Fig. 3 as function of the air temper-ature along with the averaged tempertemper-ature dependency and their standard deviations. The goodness of fit of the respira-tion model (3) to the individual datapoints, indicated in the legend of Fig. 3, is rather low. Apart from the fact that the low r2values may reflect some uncertainty in the measure-ments, this is also assumed to be related to the fact that fac-tors other than temperature, such as soil moisture, probably exert important controls on respiration as well. Yet, the fits to the smoothed functions were quite reasonable (with r2 be-tween 0.80 and 0.96, except for Lelystad where r2=0.58),
0 10 20 30 40 50 0 5 10 15 20 25 30 35
Air Temperature Class (o
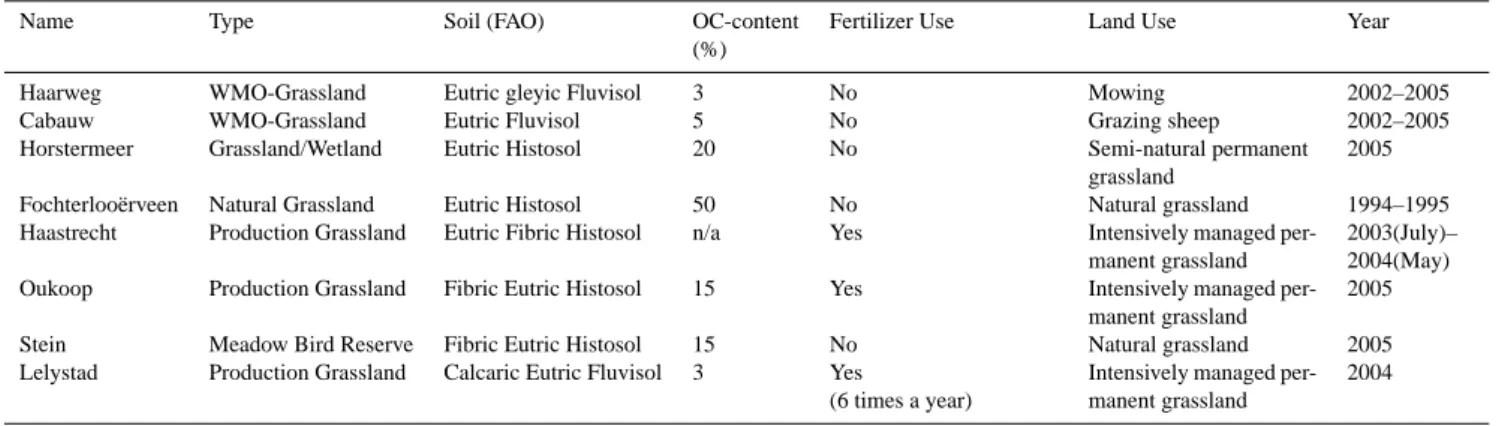
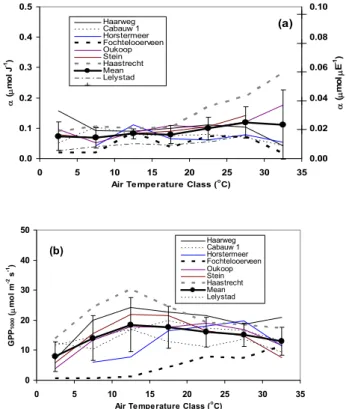
C) G P P 1 0 0 0 ( μ m o l m -2 s -1) Haarweg Cabauw 1 Horstermeer Fochtelooerveen Oukoop Stein Haastrecht Mean Lelystad (b) 0.0 0.1 0.2 0.3 0.4 0.5 0 5 10 15 20 25 30 35
Air Te mpe rature Class (o
C) α ( μ m o l J -1) 0.00 0.02 0.04 0.06 0.08 0.10 α ( μ m o l μ E -1) Haarweg Cabauw 1 Horstermeer Fochtelooerveen Oukoop Stein Haastrecht Mean Lelystad (a)
Fig. 4. The air temperature dependency of the light conversion
fac-tor, α, (top frame) and gross assimilation rate at an incoming short wave radiation of 1000 W m−2, GPP1000, (bottom frame) of all grassland locations along with the averaged value and their stan-dard deviations.
showing that on average and for the purpose of construct-ing annual sums the respiration model (3) may perform quite satisfactorily.
Clearly, it can be inferred from Fig. 3 that both grass-land/wetland locations, Horstermeer and Fochteloo¨erveen, reveal relatively low respiration rates at low temperatures, but their high temperature sensitivity compensates for the lower base respiration at the higher temperatures. Considering the response curves over the entire range, these two sites cause the relatively large standard deviations from the mean value. Moreover, from Fig. 3 it can be observed that the Haastrecht site shows a relatively high base respiration rate. The Haas-trecht site is a peat soil area and has a lower water table than the Fochteloo¨erveen and Horstermeer sites which ranges be-tween –0.2 (summertime) and –0.4 m (wintertime). Probably both reasons (peat soil and lower water table) are responsible for the relatively high base respiration rate at the Haastrecht site. However, the temperature sensitivity is much less than at Horstermeer and Fochteloo¨erveen, which tends to reduce the overall respiration rate at the higher temperatures. The Lelystad site reveals a similar low temperature sensitivity. However, in this case the base respiration is much like the average one, resulting in relatively large deviations from the average at higher temperatures.
3.2 Light responses
Figure 4 depicts the characteristics of the light response curves of all eight grassland sites as a function of the tem-perature. The temperature taken is central in the 5-degrees temperature bins defined in the analysis. This is very close to the bin-averaged temperature. In the case of Cabauw and Haarweg, the values from 2005 have been plotted. The vari-ability of the parameters during the period 2002–2005 will be further investigated below.
In the top panel of Fig. 4, all the light conversion factors
αare plotted along with the average from all sites and the standard deviations per temperature bin. It can clearly be seen that on average α is nearly a constant for all temper-ature classes, with a value somewhat below 0.1 µmol J−1. The Fochteloo¨erveen area has a very low LAI, especially dur-ing the start and the end of the growdur-ing season (LAI<<1). It must be expected that this is the reason for a relatively low light conversion factor for this area in particular for the low temperature classes. On the other hand, α at the Haastrecht site is rather high at higher temperatures. This causes the largest part of the standard deviation in the tem-perature classes >20◦C. Since the Haastrecht site generally also shows the highest values of the gross maximum assimi-lation rate (see below) this may be an effect of a high LAI in this area. Effects of LAI on the light conversion factor and on the assimilation rate at saturating light intensity has been demonstrated at the Oukoop and Stein sites by Veenendaal et al. (2007). However, note that part of the large standard deviation at high temperatures is due to uncertainty in the fits caused by low numbers of data in these temperature classes. The bottom panel of Fig. 4 shows the gross assimilation rate at a solar light intensity of Rin=1000 W m−2, GPP1000 as derived from the fitted response functions. It must be ex-pected that for an ecosystem with a low LAI, the light satura-tion is reached at lower irradiasatura-tion than for an ecosystem with a high LAI (Goudriaan and Van Laar, 1994) and GPP1000 will be higher for ecosystems with higher LAI. Figure 4 clearly reflects that for the Fochteloo¨erveen site, which has the lowest maximum LAI (LAImax≈1.7). Similarly, Haas-trecht presumably has the highest LAI. Although there are no direct observations, at locations near the Haastrecht site LAI values up to about 10 have been observed.
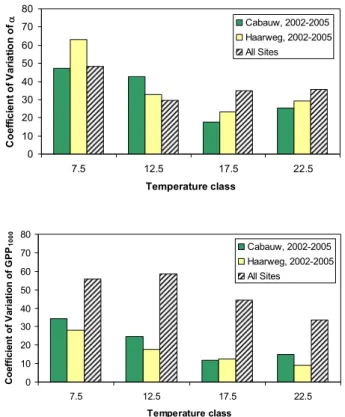
Observations from four complete years (2002–2005) at Haarweg and Cabauw are further analyzed to get insight into the interannual variation of α and GPP1000, relative to the variation between sites. We consider the temperature classes between 5 and 25◦C because the fits in these classes are most reliable and are available for all years. These variations can then be compared with the standard deviation from the aver-age of all sites. Figure 5 shows as a function of the middle temperature of the bins the coefficient of variation (CV, stan-dard deviation relative to the mean value) of α and GPP1000 for the Haarweg and Cabauw averages in the period 2002– 2005, and for the individual years of all sites (2005 in the
0 10 20 30 40 50 60 70 80 7.5 12.5 17.5 22.5 Temperature class C o e ff ic ie n t o f V a ri a ti o n o f α Cabauw, 2002-2005 Haarweg, 2002-2005 All Sites 0 10 20 30 40 50 60 70 80 7.5 12.5 17.5 22.5 Temperature class C o e ff ic ie n t o f V a ri a ti o n o f G P P1 0 0 0 Cabauw, 2002-2005 Haarweg, 2002-2005 All Sites
Fig. 5. Coefficient of variation per temperature class of α, (upper
frame) and GPP1000(lower frame). The temperature class is in-dicated by the middle temperature of the class. The CV from of interannual variability (Haarweg and Cabauw, 2002–2005) is com-pared to CV from the intersite variability (year 2005).
case of Haarweg and Cabauw). The interannual variability of α is comparable or even larger than the inter-site vari-ability, with CV values between 18 and 63%. In contrast, the interannual variability of GPP1000is clearly less than the inter-site variability. CV values range between 12 and 35% for the interannual variability, and between 34 and 59% for the inter-site variability. At the lower and higher Taclasses, the uncertainty tends to be larger because there are less data in the bins. Also, because temperature and irradiation are correlated, high Rin is underrepresented at low Ta and the reverse.
Because the values of α and GPPmax(or GPP1000)from the fits tend to be negatively correlated, the estimated vari-ability in the annual GPP is much less. Based on the ob-served meteorological conditions at Haarweg in the year 2005, the CV of annual GPP amounts to about 9 and 14% for Haarweg and Cabauw, respectively, while it is nearly 38% for the inter-site variability. Thus, again assuming similar vari-ability characteristics for all sites, these estimates imply an error of ∼15% in estimates of annual GPP if we apply the light-response characteristics calculated from 1 year of ob-servations to all other years (also see Sect. 3.3).
Table 2. Estimated mean and standard deviation of annual GPP, Reand NEE for all sites in the year 2005 and for Haarweg and Cabauw over the period 2002–2005.
Re σRe GPP σGPP NEE σNEE (gC m−2a−1) (gC m−2a−1) (gC m−2a−1) (gC m−2a−1) (gC m−2a−1) (gC m−2a−1) Cabauw (2002–2005) 1458 227 (15.6%) 1466 206 (14.1%) 8 276 (3422%) Haarweg (2002–2005) 1803 247 (13.7%) 2011 171 (8.5%) 208 176 (84.8%) All sites (2005) 1396 486 (34.8%) 1432 534 (37.7%) 36 207 (575%) Figure 6 0 500 1000 1500 2000 2500 3000 2002 2003 2004 2005 Year Σ R e (g C m -2 a -1 ) Haarweg Cabauw Horstermeer Lelystad Fochtelooerveen Haastrecht Oukoop Stein (a) 0 500 1000 1500 2000 2500 3000 2002 2003 2004 2005 Year Σ G P P ( g C m -2 a -1 ) Haarweg Cabauw Horstermeer Lelystad Fochtelooerveen Haastrecht Oukoop Stein (b) -600 -400 -200 0 200 400 600 800 2002 2003 2004 2005 Year Σ N EE (g C m -2 a -1 ) Haarweg Cabauw Horstermeer Lelystad Fochtelooerveen Haastrecht Oukoop Stein (c)
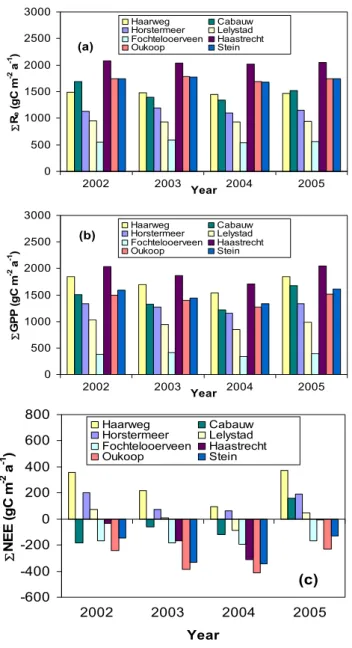
Fig. 6. The individual cumulative Re(a), GPP (b) and NEE (c) of all grassland stations for 2002 until 2005.
3.3 Annual CO2exchange
Figure 6 contains the individual annual sums of Re, GPP and
NEE for the eight different locations and the four selected
years. The sums have been computed using the observed meteorological conditions (Taand Rin)at Haarweg as driver of the response functions. Because the response functions used are the same in each year, the interannual variability revealed in Fig. 6 reflects differences in the main climatolog-ical drivers.
The respiration does not show large interannual differ-ences for all eight individual sites. This is to be expected because the driving variable of the respiration model is Ta, which does not vary much on the annual timescale, in the period considered here. For example, at the Haarweg site the long-term mean annual air temperature is 9.4±0.7◦C (Jacobs et al., 2006). The average Re for all sites is 1390±30 gC m−2a−1, where the +/– ranges mean the inter-site variability. The average GPP for all inter-sites amounts to 1325±110 gC m−2a−1, which displays a much higher vari-ability (8%) than the respiration (3%). GPP depends on Rin in combination with Ta. In particular Rin can vary much between the years. For example, the long-term Rin for the Haarweg site is 3400±300 MJ m−2a−1.
Obviously, the NEE, being the difference of GPP and Re, shows a much larger variation (see Fig. 6c). On average, the annual NEE amounts to –65±85 gC m−2a−1, which means that on average our grasslands emit CO2, with a relatively large standard deviation.
We next assess the interannual variation of the carbon ex-change components due to eco-physiological differences (see Sects. 3.1 and 3.2). To this end, annual sums are computed for the Cabauw and Haarweg sites for the year 2005, using the fits of each individual year in the period investigated. The average of the four sums and the standard deviation are then compared with the average and standard deviation from all sites, using the respective model fits of the specific year of the observations (2005 in the case of Cabauw and Haarweg), again driven with Ta and Rin from Haarweg in 2005. Re-sults are shown in Table 2. It can be seen that the abso-lute and relative variation in GPP and Redue to the interan-nual differences in ecophysiological characteristics are much smaller than the intersite variation (10–15% versus 35–37%,
Table 3. The mean annual sums of Re, GPP, and NEE, for the organic and mineral soil types for 2002 until 2005.
Organic soils Mineral soils Re(gC m−2a−1) 1520±30 1260±50 GPP (gC m−2a−1) 1300±100 1350±120 NEE (gC m−2a−1) –220±90 90±90
respectively). However, the standard deviation of the site-average is similar to the one of the period-site-average (207 ver-sus 176–276 gC m−2a−1). Note that the CV of NEE given in the table shows a spurious behavior due to the small aver-ages.
Variability in grassland emissions due to meteorological conditions and to ecophysiological conditions will not be in-dependent in reality. Our analysis suggests that the interan-nual variability due to meteorological conditions may rela-tively small as compared to the variability due to ecophysi-ological differences, the difference being at least a factor of two for the sites investigate here. This illustrates the impor-tance of long-term continuous observations that allow eval-uation of the connection between meteorological conditions and ecophysiological characteristics. It also underlines the fact that interannual variability of CO2exchange cannot be evaluated using only climatic records with fixed ecophysio-logical conditions.
Depending on hydrology and management practices, grasslands on organic soils (e.g. peat) are often found to be sources for carbon dioxide (Nieveen et al., 1998; Nieveen et al., 2005; Lloyd, 2006; Veenendaal et al., 2007), while grasslands on mineral soils (for example, clay and sand) of-ten show a net uptake for carbon dioxide (Gilmanov et al., 2007). Clearly it can be observed that the Fochteloo¨erveen, Haastrecht, Oukoop and Stein sites follow this rule for or-ganic soils and the Haarweg and Horstermeer sites for min-eral soils. An exception appears to be the Cabauw site, which has a clay soil which sometimes reveals a net release of CO2(2002, 2003, 2004) and sometimes shows a net uptake (2005). Presumably, much of the variability of NEE of or-ganic soils is caused by differences in management practices and hydrology of the areas.
To make a distinction between both soil types, the sums of the annual carbon fluxes are plotted separately for both soil types in Fig. 7 along with their standard deviations. From Fig. 7 we conclude that the annual standard deviations for all fluxes of the organic soils are much higher than those for the mineral soils. In our case this larger standard deviation is mainly caused by the Fochteloo¨erveen bog site, which be-haves quite differently from the other organic grassland sites. Second, we conclude that for both soil types the interannual differences in Re are small in comparison to the interannual differences in GPP and as a consequence the interannual
dif--1000 0 1000 2000 3000 2002 2003 2004 2005 Year F lu x ( g C m -2 a -1 ) Re GPP NEE
organic soils
-1000 0 1000 2000 3000 2002 2003 2004 2005 Year F lu x ( g C m -2 a -1 ) Re GPP NEEmineral soils
Fig. 7. The mean annual sums of Re, GPP and NEE, for the or-ganic and mineral soil types during 2002 until 2005. Oror-ganic sites: Fochteloo¨erveen, Oukoop, Stein, Haastrecht. Mineral sites: Haar-weg, Cabauw, Lelystad, Horstermeer.
ferences in NEE are large as well. This also can be concluded from Table 3 where for both soil types the mean of the whole selected period has been given.
On average we conclude from Table 3 that the annual
NEE amounts 90±90 gC m−2a−1 for the mineral soils and
–220±90 gC m−2a−1for the organic soils. As stated earlier, about 80% of the Dutch grasslands are on mineral soils and about 20% on organic soils. The weighed mean for the Dutch grasslands is 28±90 gC m−2a−1, indicating that, on average, the Dutch grasslands show a net uptake of CO2. Our results are in strong contrast with the emission factor used in the na-tional inventory. Admittedly, our weighted average may be viewed as a rather simplistic upscaling method, but it puts the Dutch emission factor of 519 gC m−2a−1into perspec-tive. The difference is due partly to the much smaller average release we found for the organic soils, in addition to the fact that uptake of grasslands on mineral soils was taken into ac-count here. However, additional research is required to fully resolve the discrepancy.
Our results suggest that within small regions with rel-atively uniform climatic conditions the variability may be similar to the one observed at much larger scales with a large range of climatic conditions. At the European scale, Gilmanov et al. (2007) found the annual GPP to vary between 464 and 1881 gC m−2a−1, Re between 572 and 1636 gC m−2a−1 and NEE between an uptake of 655 gC m−2 a−1 and a release of 164 gC m−2 a−1. These numbers are based on gapfilled timeseries of observations. Our ranges in GPP and Re are similar to the one re-ported by Gilmanov et al. (2007): annual GPP varies be-tween 391 and 2109 gC m−2a−1, and Re between 560 and 2047 gC m−2a−1. We find the NEE to vary between a net uptake of 307 gC m−2a−1and a release of 250 gC m−2a−1. Our results are based on ecosystem characteristics derived from on-site quality-controlled observations, extrapolated using response functions at the yearly timescale to the cli-matological conditions of one site. We feel that this method works satisfactorily for intersite-comparison and enables es-timates of the relative contribution of climatological and eco-physiological conditions to the variability of CO2exchanges of grassland. Finally, comparison of the ranges in annual CO2 exchange at the European and National (Dutch) scale, suggests that in order to properly assess regional GHG bal-ances there is a need for detailed, regionally specific and spa-tially explicit CO2emission factors at the field scale. These are then the starting point to construct more complete as-sessments of the GHG balance. Such balances should in-clude emissions of methane and nitrous oxide as well, and should take management factors and factors such as water table depth into account.
4 Summary and conclusions
For eight Dutch grassland sites, CO2fluxes were determined using the Eddy Covariance technique during periods of at least 10 months per site. The measurement sites, four natural grasslands, two production grasslands and two meteorolog-ical stations within a rotational grassland region, are more or less distributed over the grassland areas in The Nether-lands. The photosynthesis-light response analysis technique is used along with the respiration-temperature response tech-nique to partition NEE among Gross Primary Production (GPP) and Ecosystem Respiration (Re)and to obtain the eco-physiological characteristics of the sites a the field scale. To assess annual sums of NEE, R10, GPP and their variability, calculations using the fitted response curves were then car-ried out for four years (2002–2005). Air temperature and solar radiation observed at the Haarweg meteorological sta-tion in the centre of The Netherlands were used as drivers of the response models. The main conclusions of this study are summarized as follows:
1. The annual NEE is estimated to be –65±85 gC m−2a−1. A distinction can be made between the
grass-lands on mineral soils, with a mean net uptake of 90±90 gC m−2a−1, and those on organic soils with a mean net release of 220±90 gC m−2a−1. The mean
NEE weighed with the fraction of grasslands on organic
(20%) and mineral soils (80%) is 28±90 gC m−2a−1. 2. The main characteristics of the respiration-temperature
response curves, R10 and Ea, of individual sites show an interannual variability which is much lower than the inter-site variability, with a variability coefficient of
∼15% versus ∼35%, respectively. The resulting corre-sponding variabilities in annual Reare similar. The vari-ability due to interannual differences in weather condi-tions is much smaller, ∼2%.
3. The intersite-variability of the light conversion factor,
α, is found to be about equal to the interannual variabil-ity of this parameter. It ranges from ∼20 to ∼60 %, de-pending on the air temperature. In contrast, the inter-site variability of GPP1000 is clearly larger than the inter-annual variability. The standard deviation of GPP1000 is ∼10 to ∼40% of the four-year averages and ∼40 to
∼60% of the means from all sites, again depending on the air temperature. The corresponding coefficients of variation for annual GPP derived from the fits are ∼10 to 15% for the annual variability and ∼37% for the in-tersite variability. Variability due to climatology is as-sessed to be ∼8%.
4. The standard deviation of annual NEE due to interan-nual and intersite variability of ecophysiological differ-ences is estimated to be 176–276 gC m−2a−1 in both cases, as compared to 85 gC m−2a−1for variability due to meteorological conditions. The latter number does not account for possible correlations between ecophys-iological and meteorological factors. This, along with the differences between the two sources of variability underline the need for long-term flux observations. 5. Our variability estimates are similar to those on a much
larger, European scale. This suggests that in order to properly assess regional GHG balances there is a need for detailed, regionally specific and spatially explicit CO2emission factors at the field scale.
Acknowledgements. This research project is performed in the framework of the Dutch National Research Programme Climate Changes Spatial Planning (www.klimaatvooruimte.nl). It is co-funded by the Dutch Ministry of Agriculture, Nature and Food Quality. B. Heusinkveld (WU-METAQ), J. Elbers and W. Jans (Alterra) are thanked for carrying out the field work. We acknowledge the two anonymous reviewers for their valuable suggestions to improve the manuscript.
References
Ammann, C., Flechard, C. R., Leifeld, J., Neftel, A., and Fuhrer, J.: The carbon budget of newly established temperate grassland depends on management intensity, Agric. Ecosyst. Environ., 121, 5–20, 2007.
Aubinet, M., Grelle, A., Ibrom, A., Rannik, J., Moncrieff, T., Fo-ken, T., JKowalski, A. S., Martin, P. H., Grunwald, T., Morgen-stern, K., Pilegaard, K., Rebmann, C., Snijder, W., Valentini, W., and Vesala, T.: Estimates of the annual net carbon and water ex-change of forests: The EUROFLUX methodology, Adv. Ecol. Res., 30, 113–175, 2000.
Aubinet, M. Heinesch, B., and Yermaux, M.,:Horizontal and verti-cal CO2 advection in a sloping forest, Bound.-Layer Meteorol., 108, 397–417, 2003.
Baldocchi, D., Falge, E., Gu, L., Olson, R., Hollinger, D., Running, S., Anthoni, P., Bernhofer, C., Davis, K., Evans, R., Fuentes, J., Goldstein, A., Katul, G., Law, B., Lee, X., Malhi, Y., Meyers, T., Munger, W., Oechel, W., Paw, K. T., Pilegaard, K., Schmid, H. P., Valentini, R., Verma, S., Vesala, T., Wilson, K., and Wofsy, S.: FLUXNET: A New Tool to Study the Temporal and Spa-tial Variability of Ecosystem-Scale Carbon Dioxide, Water Va-por, and Energy Flux Densities, Bull. Am. Meteorol. Soc., 82, 2415–2434, 2001.
Beljaars A. C. M. and Bosveld, F. C.: Cabauw data for the validation of land surface parameterization schemes, J. Climate, 10, 1172– 1193, 1997.
Brandes, L. J., Ruyssenaars, P. G., Vreuls, H. H. J., Coenen, P. W. H. G., Baas, K., van den Berghe, G., van den Born, G. J., Guis, B., Hoen, A., te Molder, R., Nijdam, D. S., Olivier, J. G. J., Peek, C. J., and van Schijndel, M. W.: Greenhouse Gas Emis-sions in the Netherlands 1990–2005, National Inventory Report 2007, MNP Report 500080006, Netherlands Environmental As-sessment Agency (MNP), Bilthoven, Netherlands, 218 pp., 2007. CBS, Central Dutch Statistical Bureau: www.cbs.nl, 2007. EEA: The European environment. State and outlook 2005.
Euro-pean Environment Agency, 576 pp., 2005.
Falge, E., Baldocchi, D., Olson, R., Anthoni, P., Aubinet, M., Bern-hofer, C., Burba, G., Ceulemans, R., Clement, R., Dolman, H., Granier, A., Gross, P., Grunwald, T., Hollinger, D., Jensen, N. O., Katul, G., Keronen, P., Kowalski, A., Lai, C.T., Law, B. E., Meyers, T., Moncrieff, H., Moors, E., Munger, J. W., Pilegaard, K., Rannik, U., Rebmann, C., Suyker, A., Tenhunen, J., Tu, K., Verma, S., Vesala, T., Wilson, K., and Wofsy, S.: Gap filling strategies for defensible annual sums of net ecosystem exchange, Agric. For. Meteorol., 107, 43–69, 2001.
Friedlingstein, P., Cox, P., Betts, R., Bopp, L., von Bloh, W., Brovkin, V., Cadule, P., Doney, S., Eby, M., Fung, I., Bala, G., John, J., Jones, C., Joos, F., Kato, T., Kawamiya, M., Knorr, W., Lindsay, K., Matthews, H. D., Raddatz, T., Rayner, P., Reick, C., Roeckner, E., Schnitzler, K.-G., Schnur, R., Strassmann, K., Weaver, A. J., Yoshikawa, C., and Zeng, N.: Climate-Carbon Cycle Feedback Analysis: Results from the C4MIP Model Inter-comparison, J. Climate, 19, 3337–3353, 2006.
Gilmanov, T. G., Soussana, J.-F., Allards, A. L., Ammann, C., Balzarolo, M., Barza, Z., Bernhofer, C., Campbell, C. L., Cescatti, A., Clifton-Brown, J., Dirks, B. O. M., Dore, S., Eu-gster, W., Fuhrer, J., Gimenco, C., Gruenwald, C., Haszpra, L., Hensen, A., Ibrom, A., Jacobs, A. F. G., Jones, M. B., Laurila, G., Lohila, A., Manca, G., Marcolla, B., Nagy, Z., Pilegaard,
K., Pinter, K., Pio, C., Raschi, A., Rogiers, N., Sanz, M. J., Ste-fani, P., Sutton, M., Tuba, Z., Valentini, R., Williams, M. L., and Wohlfahrt, G.: Partitioning European grassland net tem CO2 exchange into gross primary productivity and ecosys-tem respiration using light response function analysis, Agric. Ecosyst. Environ., 121, 93–120, 2007.
Goudriaan, J. and Van Laar, H. H.: Modelling Potential Crop Growth Processes. Kluwer Ac. Publ., Dordrecht, 238 pp., 1994. Hadley, M.: Grasslands for sustainable ecosystems, in: Grasslands
for our world, edited by: Baker, M. J., SIR publishing, Welling-ton, New Zealand, 12–18, 1993.
Hartley, I. P., Armstrong, A. F., Murthy, R., Barron-Gafford, G., Ineson, P., and Atkin, O. K.: The dependence of respiration on photosynthetic substrate supply and temperature: integrating leaf, soil and ecosystem measurements, Global Change Biol., 12, 1954–1968, 2006.
Hendriks, D. M. D., Van Huissteden, J., Dolman, A. J., and Van der Molen, M. K.: The full greenhouse gas balance of an abandoned peat meadow, Biogeosci., 4, 411–424, 2007.
Hu, S., Chapin III, F. S., Firestone, M. K., Field, C. B., and Chiariello, N. R.: Nitrogen limitation of microbial decomposi-tion in a grassland under elevated CO2, Nature, 409, 188–190, 2001.
IPCC: Good Practice Guidance for land Use, Land-Use Change and Forestry. IPCC, Cambridge, UK, 2003.
Jacobs, A. F. G., Heusinkveld, B. G., and Holtslag, A. A. M.: Car-bon dioxide and water vapour flux densities over a grassland area in the Netherlands, Int. J. Climatol., 23, 1663–1675, 2003a. Jacobs, A. F. G., Ronda, R. J., and Holtslag, A. A. M.: Water vapour
and carbon dioxide fluxes over bog vegetation, Agric. Forest Me-teorol., 116, 103–112, 2003b.
Jacobs, A. F. G., Heusinkveld, B. G., and Wichink Kruit, R. J.: Contribution of dew to the water budget of a grassland area in the Netherlands, Water Resour. Res., 42, W03415, doi:10.1029/2005WR004055, 2006.
Keuning, J. A.: Grashoogtemeter hulpmiddel voor schatting grashoeveelheid. Meststoffen, 1, 1–3. (in Dutch), 1988. Lafleur, P. M., Moore, T. R., Roulet, N. T., and Frolking, S.:
Ecosys-tem respiration in a cool Ecosys-temperate bog depends on peat Ecosys- temper-ature but not water table, Ecosyst., 8, 619–629, 2005.
Lloyd, J. and Taylor, J. A.: On the temperature dependence of soil respiration, Funct. Ecol., 8, 315–323, 1994.
Lloyd, C. R.: Annual carbon balance of a managed wetland meadow in the Somerset Levels, UK, Agric. Forest Meteorol., 138, 168–179, 2006.
Nieveen, J. P., Jacobs, C. M. J., and Jacobs, A. F. G.: Diurnal and seasonal variation of carbon dioxide exchange from a former true raised bog, Global Change Biology, 4, 823–833, 1998.
Nieveen, J. P., Campbell, D. I., and Schipper, L. A.: Carbon ex-change of grazed pasture on a drained peat soil, Global Change Biol., 11, 607–618, 2005.
Reichstein, M., Falge, E., Baldocchi, D., Papale, D., Aubinet, M., Berbigier, P., Bernhofer, C., Buchmann, N., Gilmanov, T., Granier, A., Grunwald, T., Havrankova, K., Ilvesniemi, H., Janous, D., Knohl, A., Laurila, T., Lohila, A., Loustau, D., Mat-teucci, G., Meyers, T., Miglietta, F., Ourcival, J. M., Pumpanen, J., Rambal, S., Rotenberg, E., Sanz, M., J., Seufert, G., Vaccari, F., Vesala, T., Yakir, D., and Valentini, R.: On the separation of net ecosystem exchange into assimilation and ecosystem
respira-tion: review and improved algorithm, Global Change Biol., 11, 1424–1439, 2005.
Ruppert, J., Mauder, M., Thomas, C., ane Luers, J.: Innovative gap-filling strategy for annual sums of CO2 net ecosystem exchange, Agric. For. Meteorol., 138, 5–18, 2006.
Soussana, J.-F., Allard, V., Pilegaard, K., Ambus, P., Ammann, C., Campbell, C., Ceschia, E., Clifton-Brown, J., Dominques, R., Flechard, C., Fuhrer, J., Hensen, A., Horvath, L., Jones, M., Kasper, G., Martin, C., Nagy, Z., Neftel, A., Raschi, A., Rees, R. M., Skiba, U., Manca, G., Sutton, M., Tuba, Z., and Valen-tini, R.: A full accounting of the greenhouse gas (CO2, N2O, CH4)budget of nine European grassland sites, Agric. Ecosyst. Environ., 121, 121–134, 2007a.
Soussana, J.-F., Fuhrer, J., Jones, M., and Van Amstel, A.: The greenhouse gas balance of grasslands in Europe, Agric. Ecosyst. Environ., 121, 1–4, 2007b.
Van de Wiel, B. J. H, Moene, A. F., Hartogensis, O. K., De Bruin, H. A. R., and Holtslag, A. A. M.: Intermittent turbulence in the stable boundary layer over land. Part III: a classification for an-nual sums of CO2net ecosystem exchange, J. Atmos. Sci., 60, 2509–2522, 2003.
Van Dijk, A. and Dolman, A. J.: Estimates of CO2uptake and re-lease among European forests based on eddy covariance data, Global Change Biol., 10, 1445–1459, 2004.
Veenendaal, E. M., Kolle, O., Leffelaar, P., Schrier, A., Van Huis-steden, K., Van Walsum, J., Moller, F., and Berendse, F.: Land use dependent CO2exchange and carbon balance in two grass-land sites on eutropic drained peat soils. Biogeosci. Discuss., 4, 1633–1671, 2007.