HAL Id: hal-00616771
https://hal.archives-ouvertes.fr/hal-00616771
Submitted on 24 Aug 2011HAL is a multi-disciplinary open access archive for the deposit and dissemination of sci-entific research documents, whether they are pub-lished or not. The documents may come from teaching and research institutions in France or abroad, or from public or private research centers.
L’archive ouverte pluridisciplinaire HAL, est destinée au dépôt et à la diffusion de documents scientifiques de niveau recherche, publiés ou non, émanant des établissements d’enseignement et de recherche français ou étrangers, des laboratoires publics ou privés.
Christine Erhel, Mathilde Guergoat-Larivière
To cite this version:
Christine Erhel, Mathilde Guergoat-Larivière. Job quality and labour market performance. 2010. �hal-00616771�
Job quality and labour market
performance
CEPS Working Document No. 330/June 2010
Christine Erhel and Mathilde Guergoat-Larivière
Abstract
Job quality is a multidimensional concept that can be defined using four main dimensions and measured through indicators such as the so-called ‘Laeken’ indicators. The empirical analysis of job quality in Europe leads to three main types of result. First, it reveals important differences across countries, with four main regimes prevalent in Europe. Second, it supports the hypothesis that a higher level of job quality is associated with better labour market and economic performance. Finally, it emphasises the heterogeneity of quality across social groups, especially according to gender, age, and education.
CEPS Working Documents are intended to give an indication of work being conducted within CEPS research programmes and to stimulate reactions from other experts in the field. Unless otherwise indicated, the views expressed are attributable only to the authors in a personal capacity and not to any institution with which they are associated.
ISBN 978-94-6138-036-4
Available for free downloading from the CEPS website (http://www.ceps.eu) © Centre for European Policy Studies, 2010
Contents
1. Introduction: How to define job quality ... 1
2. Mapping job quality in the EU27 ... 2
3. Job quality and job quantity: Is there a trade-off? ... 7
4. The heterogeneity of job quality by social groups... 9
4.1 Lower quality jobs for young workers in Europe ... 10
4.2 Is job quality gender-biased in the European Union? ... 11
4.3 Do high initial education levels ensure against low quality jobs? ... 13
4.4 Contractual variety and job quality ... 14
4.5 Heterogeneity of job quality by sectors: some early results... 15
5. Conclusion ... 17
Appendix 1- Variables included in the Principal Components Analysis ... 18
Appendix 2- The variables included in the synthetic index of job quality... 20
References ... 21
List of Figures Figure 1. A map of job quality in the EU27 (2005-2006) ... 3
Figure 2. Some Laeken key indicators ... 5
Figure 3. Some Laeken context indicators ... 5
Figure 4. Job quality and some public policy indicators, by cluster ... 7
Figure 5. Job quality index and employment rates, EU countries, 1983-2004 ... 8
Figure 6. Job quality index and long-term unemployment rates, EU countries, 1983-2004... 9
Figure 7. Job quality index and NAIRU, EU countries, 1995-2004 ... 9
Figure 8. Participation in training and education by age class ... 11
Figure 9. Access to further training by education level (% of the adult population (25-64 years)) ... 14
List of Tables Table 1. Job quality and some public policy indicators, by cluster... 6
Table 2. Correlations between quality indicators and the employment rate for EU countries, 1983-2004 ... 8
Table 3. Job quality indicators by age (in %, in 2006-2007) ... 10
Table 4. Access to further training by age (% of the adult population) ... 11
Table 5. Job quality indicators by gender (in % in 2006-2007, except wages in euro, 2002)... 12
Table 6. Job quality indicators by education level (in % in 2006-2007, except wages in euro, 2002) ... 13
Table 7. Job quality indicators by type of work contract (in euro, 2002) ... 15
Table 8. Job quality indicators by economic activity (in % in 2006-2007, except wages in €, 2002) ... 15
| 1
J
OB QUALITY AND LABOUR MARKET
PERFORMANCE
CEPS
W
ORKING
D
OCUMENT
N
O
.
330/J
UNE
2010
C
HRISTINEE
RHEL ANDM
ATHILDEG
UERGOAT-L
ARIVIÈRE*1.
Introduction: How to define job quality
In labour economics, job quality was traditionally understood as being represented by the wage level, while in some sociological or industrial relations studies, it was related to working conditions. But recent developments in economics and socio-economic approaches propose additional dimensions to the definition of job quality.
Developments in human capital theory recognise the heterogeneity of both jobs and workers, and one step can be made to differentiate job quality according to the skills involved in particular jobs or the skill-match between workers and jobs. At the macro level, market failures can lead to underinvestment in human capital, so that investment and participation in education and training activities could be seen as an indicator of employment quality.
In the recent framework of the “economics of happiness” (Layard, 2005), the approach to job quality is enriched by the consideration of workers’ points of view through the development of surveys into job satisfaction and workers’ well-being. Such surveys make it possible to determine the dimensions of job quality by asking people what is more important to them. For instance, according to ISSP data (Clark, 2005), “job security” and an “interesting job” are “very important” for a majority of people, and seem to prevail over items like “being allowed to work independently”, “good opportunities for advancement”, and “high income”. According to such studies, it appears that the absolute wage level is not so important. Comparison effects and habit effect dominate: workers are unhappy if they are paid less than their colleagues or peers (other things being equal), and wage rises only have a transient effect. These results suggest that decent living standards, wage equity, and good wage mobility could be taken as indicators of employment quality. A modern definition of job quality should also include the impact of employment on other spheres of life. Indeed, the possibility of reconciliation between work and family life appears to be a very important dimension of job quality according to workers’ responses to the European Social Survey. This is also consistent with policy-oriented approaches, like the “transitional labour market” perspective (Schmid and Gazier, 2002; Schmid, 2006), which stresses the importance of out-of-work quality dimensions, such as the right to training, to occupational redeployment or retraining, to family life, and to decide one’s working hours throughout the life cycle.
The recent framework suggested by Green (2006) integrates these results and recognises the multi-dimensional character of job quality. Indeed, this author studies job quality through the evolution of different dimensions – including skills, work effort and intensification, workers’ discretion, wages, risk and job insecurity, and workers’ well-being – and thus takes into account the multidimensional nature of job quality.
*
Christine Erhel is a researcher at the French Centre d’Etudes de l’Emploi and Associate Professor at the University Paris 1 Panthéon-Sorbonne. Mathilde Guergoat-Larivière is a doctoral student at University Paris 1- Panthéon Sorbonne, and a Junior Research Fellow at CEE.
In 2001, the European Union created a set of job quality indicators in order to monitor and compare the performances of member states in this field, which are known as the “Laeken indicators”.
Although most socio-economic approaches build on multidimensional definitions of job quality, there is still a debate about whether we should account for several constitutive dimensions or summarise job quality by a single variable, which would be the wage level according to traditional neo classical economics, or job satisfaction according to happiness economics. In a recent study, the Dublin Foundation defines job quality on the basis of the hourly wage (Eurofound, 2008).
In the present Working Document, we use a multivariate approach to job quality that seems consistent with the indicators defined in the Laeken perspective and with the discussions between member states. We will follow the lines of previous research and the report for DG Employment (Davoine, Erhel, 2008; Davoine, Erhel, Guergoat, 2008a and b; Employment in Europe 2008 Chapter 4) and define job quality using four main components:
• socio-economic security (i.e. decent wages and secure transitions); • skills and training opportunities;
• working conditions;
• ability to combine work and family life, and promotion of gender equality.
Socio-economic security is composed of indicators on wages and contracts, but also of some subjective indicators, such as job satisfaction. The second dimension is about education and training, and gathers indicators on both initial and continuous education. The third dimension is for working conditions (accidents, work intensity, long working hours, health at risk etc.). The last dimension encompasses indicators on gender equality (such as the gender employment gap and pay gap) and on work-family reconciliation (childcare structures etc.). Each of these four dimensions comprises some Laeken indicators, but also some complementary indicators to illustrate certain dimensions of job quality that were missing in the Laeken definition.
This paper uses and develops this approach to job quality. After a presentation of the main existing results in section 2 (based on Davoine et al., 2008a and b), we present new evidence concerning the positive correlations between job quality and labour market analysis, as well as a disaggregated approach by social groups, showing inter-individual heterogeneity in job quality indicators.
2.
Mapping job quality in the EU27
Comparative studies show the existence of several regimes of job quality in Europe. In Davoine et al. (2008a and b), the 27 EU member states divide into four clusters. The methodology that is used in this research is based first on Principal Components Analysis (PCA) and second on classification.1 Figure 1 maps job quality in Europe in the first two dimensions of the PCA. Furthermore, the cluster analysis divides the 27 EU member states into four clusters. Figures 2 and 3 show the position of each cluster according to some main indicators of job quality.
In this analysis (Davoine et al., 2008b), a northern cluster includes Sweden, Denmark, Finland, the Netherlands and the United Kingdom. A southern cluster is composed of Spain, Italy, Portugal, Greece and Malta. A continental cluster groups Germany, France, Belgium, Luxembourg, Austria, Ireland, Slovenia and Cyprus. The New Member States (NMS) are thus
1
mainly in a fourth cluster composed of Estonia, Latvia, Lithuania, Czech Republic, Slovakia, Poland, Hungary, Bulgaria and Romania.
In contrast to the standard results encountered in the institutionalist comparative literature (Amable, 2003, Esping-Andersen, 1990),2 the so-called liberal model disappears: the United Kingdom is included in the northern cluster, while Ireland joins the continental cluster. This counter-intuitive result reflects the existence of functional equivalences across different institutions and/or policies that are equally successful in improving job quality.
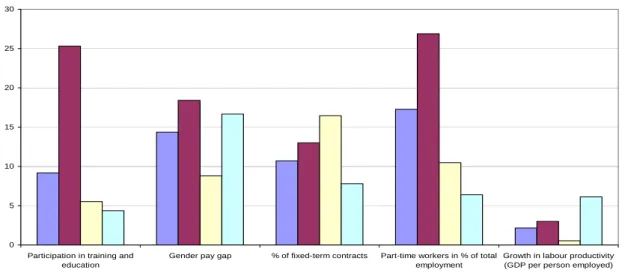
The northern cluster is on the right hand side of Figure 1, being characterised by high participation rates in education and training and high employment rates, already close to (or even above) the EES targets for 2010. Mean wages are relatively high compared to the European average and job satisfaction is also higher than in other countries: almost 90% of workers are satisfied with their working conditions. Childcare facilities are very well developed in these countries compared to the rest of Europe and part-time work is more developed in this cluster, particularly in the Netherlands. These characteristics are illustrated by the descriptive figures presented below. However, there is one specific point on which countries from this cluster are slightly worse-off compared to the EU average: the intensity of work (tight deadlines, very high speed) is higher than in other clusters.
Figure 1. A map of job quality in the EU27 (2005-2006)
Source: Labour Force Survey, Davoine et al., 2008b, Employment in Europe 2008, chapter 4.
2
Esping-Andersen’s typology distinguishes three main clusters: the liberal model, the social democratic model, and the conservative model. Amable’s typology, which is based on a larger set of variables, identifies five models of capitalism: Liberal, Nordic, Continental, Mediterranean, and Asian.
The southern cluster is characterised by a high proportion of early school leavers (Figure 3). These countries exhibit wide male–female employment gaps (except Portugal) but little segregation, and narrow gender pay gaps. Their relative performance on education and training is poor, although Spain does somewhat better in this respect. Southern countries are also characterised by a relatively high in-work poverty risk and a lack of dialogue between employers and workers on work organisation.
The continental cluster comes close to the EU average on most of the indicators considered. For example, the countries in this group have average values for participation in education and training, the proportion of early school leavers, and the proportion of people who have attained the ISCED3 level of education. Furthermore, this cluster is characterised by relatively good performances in terms of wages (through both objective and subjective indicators). High productivity and significant differences in employment rates between older people and the rest of the population are also remarkable in this cluster. However, there is also some heterogeneity within this group of countries. For example, Austria tends to be closer to the northern cluster. This can be explained by its relatively high participation rates in education and training compared to those of the other continental countries. Slovenia falls in the continental cluster in this PCA because of its relatively good performances on employment rates, and education and training, compared to the other new member states.
Although Ireland and the UK have many common features – such as low rates of long-term and youth unemployment, limited use of fixed-term contracts and high job satisfaction – they do not belong to the same group. This is due mainly to their markedly different performances on education and training: the United Kingdom is characterised by a high rate of participation in training, at 26.6%, as against only 7.5% in Ireland.
In the New Member States’ cluster, working conditions are rather poor (long working days, health at risk because of work) even if the intensity of work is lower than elsewhere in Europe. Socio-economic security measured through wage levels and perception of “being well paid” or having “some good prospects for career advancement” is low. Contrary to older member states, new forms of employment such as part-time work and temporary contracts do not contribute to explain socio-economic insecurity as they are not very developed in NMS. Rates of participation in training are low and long-term unemployment is particularly high in some countries (Poland, Slovakia). New Member States are also characterised by very low levels of productivity alongside high rates of productivity growth, which is typical of countries engaged in a catching-up process. Workers in this group of countries are less satisfied than their counterparts in other countries.
As regards initial education, the performance of the new Member States is very good: they have a low proportion of early school leavers and a rather high proportion of people who achieve the ISCED3-level of education. Bulgaria and Romania, however, perform less well on this indicator than the other countries in the group.
Figure 2. Some Laeken key indicators 0 5 10 15 20 25 30
Participation in training and education
Gender pay gap % of fixed-term contracts Part-time workers in % of total employment
Growth in labour productivity (GDP per person employed) CONTI NORTH SOUTH NMS
Source: Eurostat, LFS.
Figure 3. Some Laeken context indicators
0 10 20 30 40 50 60 70 80 90 100
Early school leavers Long-term unemployment rate
Job satisfaction Occupational segregation Childcare <3 years old
CONTI NORTH SOUTH NMS
Source: Eurostat, LFS.
All things considered, this analysis confirms that there is a significant degree of heterogeneity across the EU27 as regards job quality, (see also Gallie, 2007). As suggested by the institutional complementarity framework (e.g. Amable, 2003), different institutional settings can at times lead to similar performances, i.e. there might be functional equivalence. For instance, the United Kingdom is close to Nordic countries, despite having different institutions. This suggests that there are two pathways to high job quality, which is consistent with the findings of other recent analyses of labour market performance, based on more quantitative indicators (OECD, 2006). Of course a more detailed analysis of the different components of job quality would show differences between the UK and the Nordic countries. The level of social protection is higher in the Nordic countries, wage inequalities are lower, whereas in the UK there are higher inequalities between social groups, as well as more poverty in work. Nevertheless, these results show that several institutions may lead to a rather good level of job quality. Besides, it is also clear from these clusters that job quality and employment performances are positively related: over the 1990s and beginning of the 2000s, Nordic countries as well as the UK experienced
decreasing unemployment and high employment rates, whereas continental countries had more mitigated labour market outcomes.
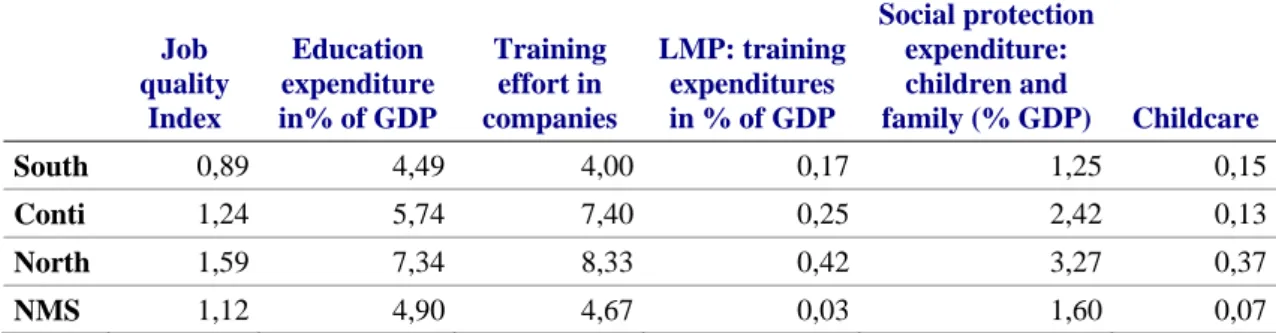
The results of the synthetic index proposed in Davoine, Erhel, Guergoat-Larivière (2008a), and in the Employment in Europe report (European Commission, 2008), confirm these differences in job quality between countries and clusters. They are likely to be explained by some particular policies or institutions, like education and further training policy, childcare and social dialogue, for example. In order to test this hypothesis, we have tried to relate the job quality index to some policy indicators that are available: the level of spending on education, variables of vocational training effort, and indicators of investment in childcare and family policy. This analysis was performed on the basis of the clusters presented above. The results confirm that job quality seems to be positively influenced by education and further training policies, as well as by childcare effort.3
Table 1. Job quality and some public policy indicators, by cluster
Job quality Index Education expenditure in% of GDP Training effort in companies LMP: training expenditures in % of GDP Social protection expenditure: children and family (% GDP) Childcare South 0,89 4,49 4,00 0,17 1,25 0,15 Conti 1,24 5,74 7,40 0,25 2,42 0,13 North 1,59 7,34 8,33 0,42 3,27 0,37 NMS 1,12 4,90 4,67 0,03 1,60 0,07
Notes: Training effort in companies = hours invested in vocational training per 1000 hours worked; Childcare = percentage of children aged under 3 cared for outside the family for more than 30 hours a week/ Source: Eurostat; Compendium, authors’ calculations.
Source: Eurostat; Compendium and Davoine et al. (2008a), authors’ calculations.
3
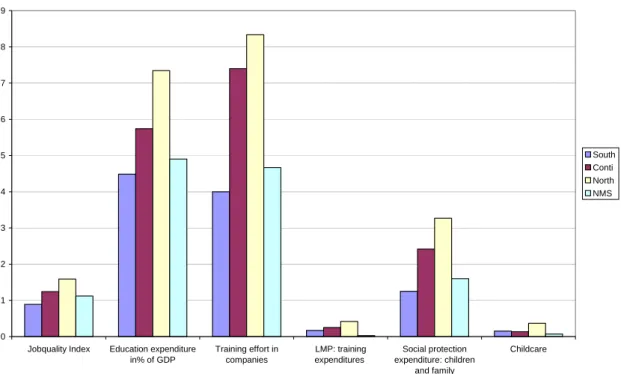
Figure 4. Job quality and some public policy indicators, by cluster 0 1 2 3 4 5 6 7 8 9
Jobquality Index Education expenditure in% of GDP Training effort in companies LMP: training expenditures Social protection expenditure: children and family Childcare South Conti North NMS
Source: Eurostat; Compendium, authors’ calculations.
3.
Job quality and job quantity: Is there a trade-off?
Beyond this close relationship between employment performances and job quality clusters, there are both theoretical and additional empirical arguments positively linking job quality and employment rates or more general labour market performances. As far as economic literature is concerned, such a positive relationship operates through several channels:
First, there are a number of well-known arguments linking human capital and economic growth. Endogenous growth models show that human capital accumulation increases the growth rate (Lucas, 1988). Investment in training and education yields increasing returns, generating positive externalities, i.e. a higher level of education not only increases individual productivity, but also the productivity of co-workers. There are also network effects, making a given amount of training all the more effective as there are positive spill-over effects affecting other workers in the network.
Second, there are also some links between workers’ security and economic growth. Security must be understood here in a broad perspective, including job protection, but also safe working conditions, fair wages and access to social protection. All these components of security in work may increase productivity and labour market participation, and therefore favour growth and labour supply. In addition, many security mechanisms work as automatic stabilisers, which are particularly helpful during economic downturns. Increasing economic security in general – and that of workers, in particular – can foster productivity growth. Thus, the various dimensions of job quality can increase workers’ productivity and have a positive influence on economic growth and employment creation.
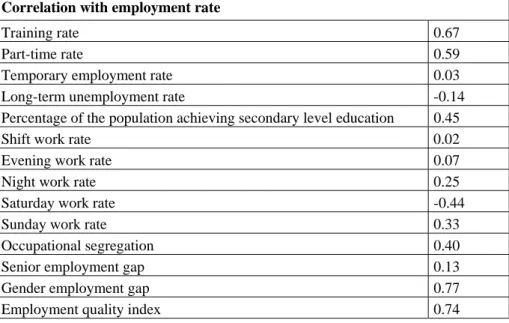
Our empirical results tend to validate this positive view of the link between job quality and quantity. The correlation between employment rates and some components of job quality is positive and significant when longitudinal European data are used (see Table 2). In particular, the employment rate is correlated with participation in education and training through the life
cycle, as well with a small differential between male and female employment rates. The correlation rate with the synthetic job quality index that was constructed in a previous study (Davoine, Erhel, Guergoat-Larivière, 2008a; European Commission, 2008) is also positive and high, as confirmed by Figure 5.
Table 2. Correlations between quality indicators and the employment rate for EU countries, 1983-2004
Correlation with employment rate
Training rate 0.67
Part-time rate 0.59
Temporary employment rate 0.03
Long-term unemployment rate -0.14
Percentage of the population achieving secondary level education 0.45
Shift work rate 0.02
Evening work rate 0.07
Night work rate 0.25
Saturday work rate -0.44
Sunday work rate 0.33
Occupational segregation 0.40
Senior employment gap 0.13
Gender employment gap 0.77
Employment quality index 0.74
Source: Davoine, Erhel, Guergoat-Larivière (2008a), LFS 1983-2004, authors’ calculations, 138 observations (one observation corresponds to one year for a given country; annual data, number of countries included depending on data availability, 6 in 1983 to 21 in 2004).
Figure 5. Job quality index and employment rates, EU countries, 1983-2004
0,4 0,45 0,5 0,55 0,6 0,65 0,7 0,75 0,8 0,2 0,4 0,6 0,8 1 1,2 1,4 1,6 1,8 2
Job quality index
Em pl o y m en t r a te
Source: LFS 1983-2004, authors’ calculations; one observation corresponds to one year for a given country.
The job quality index is also related to other labour market indicators, like the unemployment rate. We provide two figures representing the relationship with long-term unemployment (Figure 6) and with the NAIRU (Figure 7). A higher level of job quality is associated with lower long-term unemployment and a lower NAIRU.
Figure 6. Job quality index and long-term unemployment rates, EU countries, 1983-2004 0 0,1 0,2 0,3 0,4 0,5 0,6 0,7 0,8 0 0,2 0,4 0,6 0,8 1 1,2 1,4 1,6 1,8 2
Job quality index
Long t e rm une m pl oy m en t
Source: LFS 1983-2004, authors’ calculations; one observation corresponds to one year for a given country.
Figure 7. Job quality index and NAIRU, EU countries, 1995-2004
0 2 4 6 8 10 12 14 16 18 20 0 0,2 0,4 0,6 0,8 1 1,2 1,4 1,6 1,8 2
Job quality index
N
A
IR
U
Source: Eurostat, LFS 1983-2004, authors’ calculations; one observation corresponds to one year for a given country.
These results are consistent with other studies that also display a positive relationship between quantitative labour market performances and job quality indicators (Leschke and Watt, 2008; Eurofound, 2008).
4.
The heterogeneity of job quality by social groups
The aim of our analysis in this part is to have an overview of disparities in terms of job quality across age groups, economic activities and education levels. We will then try to see which social groups are the most affected by low-quality jobs and if these groups are likely to accumulate bad features in all dimensions of job quality.
Our main focus will be the ‘socio-economic security’ dimension, which mainly includes indicators on wages and types of work contracts (part-time vs. full-time, temporary vs. long-term contract). Concerning working conditions it appears to be more difficult to break down data by criteria of age, gender, activity etc. as they generally stem from rather small samples (1000 individuals per country in the Fourth European Working Conditions Survey). Yet Eurostat’s Labour Force Survey data on asocial working hours is available at finer levels and
can give a first picture of the heterogeneity of working conditions. Training and education are partly covered: the European Commission provides data by categories on participation to training and education through the Compendium. Finally, the dimension of gender equality and conciliation can be observed through differences between men and women for all the indicators mentioned above.
We present data at different geographical levels EU15, New Member States, EU25 or EU27, as patterns in job quality heterogeneity may not be exactly the same in EU older members and in New Member States (NMS). We will present data broken down by age, gender, education level, type of working contract and economic activity.
4.1 Lower quality jobs for young workers in Europe
When looking at job quality indicators broken down by age, we observe a rather strong heterogeneity and it appears that workers below 25 years old are particularly penalised. Young people have lower socio-economic security than middle-aged and older people. While around 15% of employed people have temporary contracts in the EU25 countries, this proportion rises to more than 40% for young people. Data on part-time work also reflect disparities among age classes. Part-time work is much less developed in New Member States (6.9%) than in the EU15 (20.3%) but young people are more affected in both regions (respectively 13.5% and 28.2%). It is interesting to note that part-time work is more often involuntary in New Member States and particularly for middle-age workers (35.7% in NMS vs. 22.7% in EU15). Actually, this difference is mainly due to the smaller proportion of middle-age women declaring involuntary part-time in the EU15.
Indicators on what Eurostat calls “asocial working hours” give a first picture of differences in working conditions across age classes. These figures display quite different patterns in terms of heterogeneity in EU15 and in New Member States. In EU15, people under 25 are more affected than middle-age and older people by work at weekends, whereas in New Member States people are equally concerned by work on Saturdays and Sundays, whatever their age. On the whole, night work remains limited in Europe but it seems that older workers are a bit less exposed to this kind of atypical working hours.
Table 3. Job quality indicators by age (in %, in 2006-2007)
Age class Sunday work Saturday work Night work Temporary
Employment Rate Part-time rate
Involuntary part-time rate EU 15 15-24 16,4 34,5 8,3 42,1 28,2 23,6 EU 15 25-49 13,1 27,6 8,7 12,5 18,5 22,7 EU 15 50-64 13,1 27,1 6,7 6,3 21,6 18,6 EU 15 15-64 13,5 28,2 8,2 14,7 20,3 21,8 EU 25 15-24 15,7 32,9 8,1 42,0 26,2 23 EU 25 25-49 12,9 26,6 8,3 12,9 16,4 23,1 EU 25 50-64 13 26,2 6,5 7,0 19,8 18,2 EU 25 15-64 13,2 27,2 7,8 15,0 18,2 21,8 EU 27 15-24 15,7 33,1 8 40,8 25,6 24 EU 27 25-49 13,1 26,9 8,2 12,3 15,7 23,9 EU 27 50-64 13,3 26,6 6,4 6,7 19,2 18,5 EU 27 15-64 13,4 27,5 7,8 14,4 17,6 22,5
NMS 10 15-24 11,5 22,2 6,4 41,9 13,5 23
NMS 10 25-49 11,7 21,4 6,3 14,4 5,1 35,7
NMS 10 50-64 12,8 21,1 5,1 10,1 9,5 16,9
NMS 10 15-64 11,9 21,4 6 16,2 6,9 27,6
Source: LFS (2006 for NMS, 2007 for EU15).
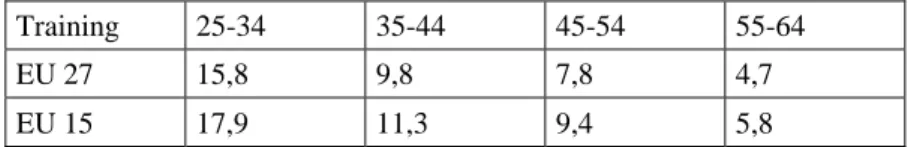
We do not present figures on wages by age class as it is quite well known that wages increase with age. All in all, the indicators presented here show a rather negative picture of the youth situation in terms of job quality. However, there is one point on which young people are in a somehow better position than other workers: namely the participation in further training. The proportion of people undergoing training periods in Europe differs slightly between EU15 and New Member States but everywhere we witness a bias in favour of younger workers. Training rates progressively decrease with age from 15.8% participation for people between 25 and 34 years old to 4.7% for people aged between 55 and 64 years old.
Table 4. Access to further training by age (% of the adult population)
Training 25-34 35-44 45-54 55-64
EU 27 15,8 9,8 7,8 4,7
EU 15 17,9 11,3 9,4 5,8
Source: Compendium (2009).
Figure 8. Participation in training and education by age class
0 2 4 6 8 10 12 14 16 18 20 25-34 35-44 45-54 55-64 EU 27 EU 15 Source: Compendium (2009).
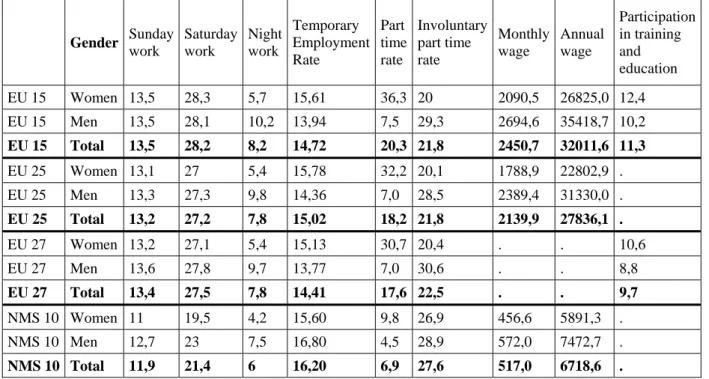
4.2 Is job quality gender-biased in the European Union?
One of the four main components of job quality concerns gender equality and conciliation between working and family life. This dimension is particularly emphasised in the European definition of job quality if we consider the proportion of Laeken indicators devoted to this aspect of job quality. It is thus interesting to compare the jobs of men and women in reference to a certain number of available job quality indicators.
Table 5. Job quality indicators by gender (in % in 2006-2007, except wages in euro, 2002) Gender Sunday work Saturday work Night work Temporary Employment Rate Part time rate Involuntary part time rate Monthly wage Annual wage Participation in training and education EU 15 Women 13,5 28,3 5,7 15,61 36,3 20 2090,5 26825,0 12,4 EU 15 Men 13,5 28,1 10,2 13,94 7,5 29,3 2694,6 35418,7 10,2 EU 15 Total 13,5 28,2 8,2 14,72 20,3 21,8 2450,7 32011,6 11,3 EU 25 Women 13,1 27 5,4 15,78 32,2 20,1 1788,9 22802,9 . EU 25 Men 13,3 27,3 9,8 14,36 7,0 28,5 2389,4 31330,0 . EU 25 Total 13,2 27,2 7,8 15,02 18,2 21,8 2139,9 27836,1 . EU 27 Women 13,2 27,1 5,4 15,13 30,7 20,4 . . 10,6 EU 27 Men 13,6 27,8 9,7 13,77 7,0 30,6 . . 8,8 EU 27 Total 13,4 27,5 7,8 14,41 17,6 22,5 . . 9,7 NMS 10 Women 11 19,5 4,2 15,60 9,8 26,9 456,6 5891,3 . NMS 10 Men 12,7 23 7,5 16,80 4,5 28,9 572,0 7472,7 . NMS 10 Total 11,9 21,4 6 16,20 6,9 27,6 517,0 6718,6 .
Source: LFS (2006 for NMS, 2007 for EU15), European Structure of Earnings Survey (2002).
Temporary employment is rather equally shared out between men and women in Europe even if women are a bit more concerned than men in EU15 countries (15.6% vs. 13.9%). On the other hand, part-time work is much more concentrated on women and this is particularly true in the EU15 where more than a third of women (36.3%) work part-time. The proportion of women working part-time is twice as high as men’s in the New Member States whereas it is five times as high as men’s in EU15. This large difference is partly explained by the lower participation of women in the labour market in the New Member States. The original form of the ‘male breadwinner/female carer’ model may be more present in NMS while it has evolved to a slightly different version in the EU15, where more women work but often part-time. Besides, let us recall that situations vary considerably even within the EU15 (from 9.9% female part-time work rate in Greece to 74.8% in the Netherlands).
However, we can notice that EU15 women who work part time are less likely to declare being on involuntary part-time (20%), compared to women of NMS (27%) and to European men in general (around 29%). But it is still useful to compare the proportion of involuntary part time in total employment for men and women in EU15: in the end, among all women in employment, 7.3% work part-time involuntarily whereas only 2.2% of men in employment work part-time involuntarily. Part-time work in general and involuntary part-time in particular clearly remain female job characteristics.
Wage gaps between men and women are still very important in absolute terms: men earn about 30% more than women. This comparison of course does not take into account either differences in qualifications or differences in working time (part time vs. full time). However, it is then not useless to compare these raw figures since these differences can also be considered to a certain point as reflecting inequalities between men and women in terms of access to higher education and in terms of career and conciliation with family life (part-time work related to child care by the mother).
Indicators on atypical working hours do not show specific inequalities between men and women concerning work at weekends. Nevertheless, men are more affected by night work than are women. In the EU27, almost 10% of men declare that they usually work at night whereas only 5.4% of women do so.
Finally, data on training participation indicate that European women have better access to training than men. In spite of very large differences in national total participation rates across Europe (from 1.3% in Romania and Bulgaria to 32.4% in Sweden), on average 10.6% of European women received training in 2007 compared to only 8.8% of men.
These comparisons show that men and women are not affected in the same way by job quality problems. Comparisons on wages and work contracts indicate that European women are disadvantaged in terms of socio-economic security compared to men. Figures about part-time work confirm that lower levels of socio-economic security are probably linked to problems of conciliation between working and family life that particularly affect women. However, according to the indicators on ‘atypical hours of work’, women do not seem to be disadvantaged and they also get better access to training on average.
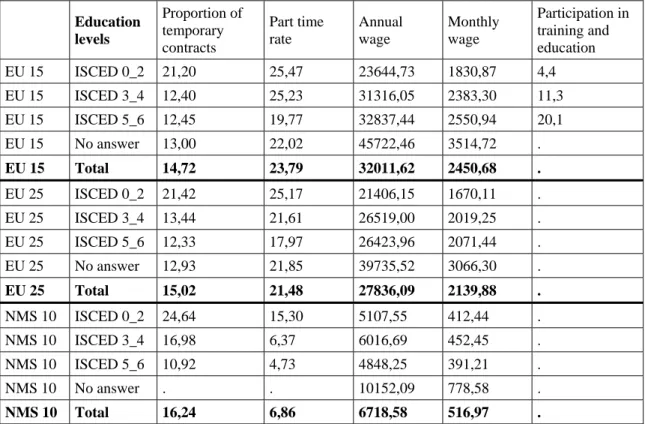
4.3 Do high initial education levels ensure against low quality jobs?
The indicators of job quality used so far are not always broken down by levels of initial education. Wages and participation in training are given directly by Eurostat and in addition we are able to calculate the proportion of temporary contracts and part-time contracts.
Table 6. Job quality indicators by education level (in % in 2006-2007, except wages in euro, 2002) Education levels Proportion of temporary contracts Part time rate Annual wage Monthly wage Participation in training and education EU 15 ISCED 0_2 21,20 25,47 23644,73 1830,87 4,4 EU 15 ISCED 3_4 12,40 25,23 31316,05 2383,30 11,3 EU 15 ISCED 5_6 12,45 19,77 32837,44 2550,94 20,1 EU 15 No answer 13,00 22,02 45722,46 3514,72 . EU 15 Total 14,72 23,79 32011,62 2450,68 . EU 25 ISCED 0_2 21,42 25,17 21406,15 1670,11 . EU 25 ISCED 3_4 13,44 21,61 26519,00 2019,25 . EU 25 ISCED 5_6 12,33 17,97 26423,96 2071,44 . EU 25 No answer 12,93 21,85 39735,52 3066,30 . EU 25 Total 15,02 21,48 27836,09 2139,88 . NMS 10 ISCED 0_2 24,64 15,30 5107,55 412,44 . NMS 10 ISCED 3_4 16,98 6,37 6016,69 452,45 . NMS 10 ISCED 5_6 10,92 4,73 4848,25 391,21 . NMS 10 No answer . . 10152,09 778,58 . NMS 10 Total 16,24 6,86 6718,58 516,97 .
Education levels (ISCED 1997): ISCED0_2 Pre-primary, primary and lower secondary education/ ISCED3_4 Upper secondary and post-secondary non-tertiary education / ISCED5_6 Tertiary education
We observe that the higher the diploma, the lower the proportion of temporary contracts in New Member States, while in EU15 countries these contracts are particularly concentrated among low-skilled workers. On the other hand, part-time work is quite equally distributed in EU15 according to qualifications (around the 23% average in each class), whereas it particularly affects low-skilled workers in the New Member States (15.3% vs. 6.9% on average).
Comparing levels of wages according to the level of initial education leads to quite well-known conclusions in the EU15: both monthly and annual wages grow gradually along with the level of qualifications. In the New Member States, we observe a rather strange feature: high-skilled workers declare earning less than medium and even low-skilled workers. However, there may be some declaration problems as the ‘no answer’ category displays much higher wages than any other.
Figure 9. Access to further training by education level (% of the adult population (25-64 years))
0 5 10 15 20 25 Low educational attainment Medium educational attainment High educational attainment Total EU27 EU15 Source: Compendium (2009).
The indicator for training and education is also very meaningful: the higher the initial qualifications, the higher the access to continuous training. This feature observed at the European level recalls that continuous training generally does not play a compensatory role in favour of less educated workers and essentially benefits already highly skilled people.
All in all, initial education levels largely influence workers’ job quality. People with low education levels face greater socio-economic insecurity in terms of wages and work contract and are less likely to receive training. The probability of their acceding to a better job through complementary education is then very limited.
4.4 Contractual variety and job quality
Comparing heterogeneity according to the nature of work contract is a rather tricky exercise as types of contracts vary considerably from one European country to another and thus are not always directly comparable. However, available data give a first picture of inequalities between ‘stable’ and ‘unstable’ workers.
Mean wages in euro of course vary on a very wide range across the enlarged European Union: a monthly mean wage is €517 in the NMS whereas it reaches €2,450 in the EU15. As we have seen before, the proportion of temporary workers is quite similar in the EU15 and in the NMS: about 15% of employees have a temporary work contract in the EU27. The difference between wages associated to fixed-term contracts and indefinite duration contracts is much more notable
in the EU15: wages are 50% higher for long-term contracts than for fixed-term contracts, whereas the difference is only 10% in the New Member States.
Table 7. Job quality indicators by type of work contract (in euro, 2002)
Type of contract Monthly wage Annual wage
EU 15 Fixed-term (except apprentice and trainee) 1755,5 22171,9
EU 15 Indefinite duration 2534,1 32977,4
EU 15 Other 1345,2 17151,7
EU 15 Total (Permanent and temporary jobs) 2450,7 32011,6
EU 15 Unknown
EU 25 Fixed-term (except apprentice and trainee) 1573,0 19785,7
EU 25 Indefinite duration 2325,6 30309,2
EU 25 Other 1223,1 15764,3
EU 25 Total (permanent and temporary jobs) 2139,9 27836,1
EU 25 Unknown 999,4 11930,5
NMS 10 Fixed-term (except apprentice and trainee) 428,6 6007,7
NMS 10 Indefinite duration 480,7 6571,1
NMS 10 Other 524,8 7790,1
NMS 10 Total (permanent and temporary jobs) 517,0 6718,6
NMS 10 Unknown 578,1 6936,6
Source: Structure of earnings, Survey 2002 (Eurostat).
4.5 Heterogeneity of job quality by sectors: Some early results
Little data is available about the heterogeneity of job quality by economic activity. We have mainly distinguished industry, services and public administration and defence. Only wages are available broken down by activity for both the EU15 and the NMS. We have temporary employment rates and part-time rates only for the EU15 countries.
Table 8. Job quality indicators by economic activity (in % in 2006-2007, except wages in €, 2002
NACE classification (branches)
Temporary Employment Rate Part-time rate Monthly wage Annual wage EU 15 Industry 13,89 8,26 2399,5 31212,0
EU 15 Services (excl. public administration) 13,39 22,86 2397,8 32035,3
EU 15
Public administration and defence;
compulsory social security 12,12 14,87 3038,4 37623,9
EU 15 Other services 17,08 34,23 2675,2 33117,8
EU 15 TOTAL 14,72 21,17 . .
EU 25 Industry 14,82 7,27 2073,7 26988,1
EU 25 Services (excl. public administration) 14,02 20,77 2169,4 28838,1
compulsory social security
EU 25 Other services 16,52 31,45 2176,4 26670,2
EU 25 TOTAL 15,02 19,10 . .
NMS 10 Industry . . 505,3 6587,9
NMS 10 Services (excl. public administration) . . 539,3 7099,3
NMS 10
Public administration and defence;
compulsory social security . . 624,6 7923,4
NMS 10 Other services . . 473,0 6009,3
NMS 10 TOTAL . . . .
Nace classification: C_TO_F Industry / G_TO_K Services (excluding public administration) / L Public administration and defence; compulsory social security / M_TO_Q Other services / TOTAL All NACE branches.
Source: LFS (2006 for NMS, 2007 for EU15), European Structure of Earnings Survey (2002).
In the EU15, part-time work is particularly developed in services compared to industry or public administration. Comparatively, the temporary employment rate is rather equally spread out across activities.
In terms of wages, public administration workers are better-off compared to other workers. They earn about 25% more both in the EU15 countries and in the New Member States.
In conclusion, these comparisons, based on potential criteria of heterogeneity (gender, age, education etc.), indicate the most fragile groups in terms of job quality; namely the groups of people who accumulate bad job characteristics.
People with lower levels of education are most likely to be in low-quality jobs. They experience low socio-economic security, have lower wages and greater instability of employment. Moreover, they are also less likely to receive training and be able to move out of this unfavourable situation.
On average, young people are also disadvantaged: they have low socio-economic security (low wages, temporary contracts and part-time work) and endure more asocial working hours. On the other hand, they have a greater chance of receiving training than older workers. However, this group is likely to be quite heterogeneous in itself. It may include at least two different kinds of people: those who suffer from low-quality jobs because they are young and unskilled and for whom there is little probability of improvement; and those who have reached high levels of education (or may not even have finished their studies) who experience lower-quality jobs mainly because of their ‘youth’ (a combination of work and studies, or a lack of experience in their first job) but who will move on from this situation later.
Women can also be considered as a disadvantaged group in terms of socio-economic security: they receive lower wages and are more likely than men to work part-time involuntarily. This situation might be related to conciliation issues that lead women to work part-time. However, women seem to be in a somewhat better position than men as regards training and partly regarding working conditions (night work).
These results have some limitations, however: they are based on aggregate data, and provide a static approach to job quality. A further step would be to construct some dynamic indicators, and to study the influence of individual characteristics on these job quality variables to confirm which groups are relatively disadvantaged.
5. Conclusion
An empirical analysis of job quality reveals important differences across countries (that are quite well known since our previous work; see Davoine et al., 2008a and b, European Commission, 2008), but also between individuals and social groups. From that point of view the analysis of job quality indicators suggests some priority targets for labour market and training policies. Indeed, comparisons based on potential criteria of heterogeneity (gender, age, education, etc.) point out the most fragile groups in terms of job quality, namely the groups who accumulate bad job characteristics. Fighting against such inequalities is important in a perspective of social inclusion and general social welfare.
But despite these differences among social groups, which should be further explored using individual data, our analyses confirm that promoting job quality should be favourable to the labour market and economic performance.
18 |
Appendix 1- Variables included in the Principal Components Analysis
Laeken indicators
Job satisfaction: % of workers who declare that they are satisfied or very satisfied with their working conditions, 2006. Source: the Fourth European Working Conditions Survey, (Eurofound website).
Participation in education and training, 2006. Source: LFS (Compendium).
Participation in education and training (55-64 years old), 2006. Source: LFS (Compendium). Participation in education and training (unemployed), 2006. Source: LFS (Compendium). Share of the workforce working with computers (PCs, network, mainframe), 2006. Source: the Fourth European Working Conditions Survey, (Eurofound website).
Difference between men’s and women’s average gross hourly earning as percentage of average men’s hourly earnings (for paid employees at work), 2001. Source: National sources and ECHP, Eurostat (Compendium).
Employment gap between men and women, 2006. Source: LFS (Eurostat website). Gender unemployment gap, 2006. Source: LFS (Eurostat website).
Occupational segregation, 2006. Source: LFS (Compendium). Sectorial segregation, 2006. Source: LFS (Compendium).
The evolution of incidence rate defined as the number of serious accidents at work per 100,000 persons in employment, between 1999 and 2004. Source: ESAW (Compendium).
Part-time employment as a percentage of total employment, 2006 (Eurostat website). Fixed-term contract as a percentage of total employment, 2006 (Eurostat website). Involuntary part-time as % of part-time employment, 2006. (Eurostat website).
Involuntary fixed-term contracts as % of fixed-term contracts, 2006. (Eurostat website). 15-64 years old employment rate, 2006. Source: LFS (Eurostat website).
Long-term unemployment rate, 2006. Source: LFS (site Eurostat website).
Early school-leavers (defined as the percentage of the population aged 18-24 with at most lower secondary education (ISCED level 2) and not in further education or training, 2006. Source: LFS (Compendium).
Youth unemployment ratio: total unemployed young people (15-24 years) as a share of total population in the same brackets, 2006. Source: LFS (Compendium).
Employment impact of parenthood for men: the difference in percentage points in employment rates without the presence of any children and with the presence of a child aged 0-6, 2006. Source: LFS (Compendium).
Employment impact of parenthood for women: the difference in percentage points in employment rates without the presence of any children and with the presence of a child aged 0-6, 2006. Source: LFS (Compendium).
Childcare: children cared for (by other formal arrangements than family) as a proportion of all children of the same age group (<3 years old), 2006. Source: national sources (Compendium). Childcare: children cared for (by other formal arrangements than family) as a proportion of all children of the same age group (from 3 years old to compulsory school age), 2006. Source: national sources (Compendium).
4
Childcare: children cared for (by other formal arrangements than family) as a proportion of all children of the same age group (from compulsory school age to 12), 2006. Source: national sources (Compendium).
Inactives not seeking employment but would nevertheless like to have work, but who are not searching due to personal or families responsibilities, 2005. Source: LFS (Compendium).
Difference in employment rates between 55-64 years old and 15-64 years old, 2006. Source: LFS (Eurostat website).
Productivity (GDP per hour worked), 2005. Source: Eurostat (Compendium). Productivity (GDP per person employed), 2005. Source: Eurostat (Compendium).
Growth in labour productivity (GDP per hour worked), 2004. Source: Eurostat (Compendium). Growth in labour productivity (GDP per person worked), 2004. Source: Eurostat (Compendium).
Percentage of the population aged 25 to 64 having completed at least upper secondary education (ISCED3 level), 2006. Source: Eurostat.
Complementary indicators
Length of maternity leave in months (with benefits replacing at least 2/3 of salary), 2005. Source: Eurostat (Compendium).
Short repetitive tasks of <10min, 2006. Source: the Fourth European Working Conditions Survey (Eurofound website).
Job involves painful/tiring positions, 2006. Source: the Fourth European Working Conditions Survey (Eurofound website).
“My health is at risk because of work”, 2006. Source: the Fourth European Working Conditions Survey (Eurofound website).
Working at very high speed, 2006. Source: the Fourth European Working Conditions Survey (Eurofound website).
Working with tight deadlines, 2006. Source: the Fourth European Working Conditions Survey (Eurofound website).
Consulted about changes in work organisation etc., 2006. Source: the Fourth European Working Conditions Survey (Eurofound website).
Working at night, 2006. Source: the Fourth European Working Conditions Survey (Eurofound website).
% working long working days, 2006. Source: the Fourth European Working Conditions Survey (Eurofound website).
“I am well paid for the work I do”, 2006. Source: the Fourth European Working Conditions Survey (Eurofound website).
“My job offers good prospects for career advancement”, 2006. Source: the Fourth European Working Conditions Survey (Eurofound website).
Mean wage in PPS, 2001. Source: ECHP (our own calculations). Number of working poor in 2001 (Compendium).
Hours of CVT courses per participant, 1999. Source: Continual Vocational Training Survey 2 (CVTS2).
Cost of CVT courses per participant, 1999. Source: Continual Vocational Training Survey 2 (CVTS2).
20 |
Appendix 2- The variables included in the synthetic index of job quality
The sign in brackets refers to the hypothesis made about the sign of contribution to job quality. Transition of non-employed people into employment one year later (+)
Long-term unemployment rate (-)
Part-time employment as a percentage of total employment (-)
Involuntary part-time employment as a percentage of part-time employment (-) Fixed-term contract as a percentage of total employment (-)
Difference in employment rates between 55-64 years old and 15-64 years old (-) Employment gap between men and women (-)
Pay gap between men and women Occupational segregation (-)
Participation in education and training (+)
Population who achieved at least upper secondary education (+)
Non-standard hours: proportion of people working nights, or Sundays or Saturdays (-) In-work accidents rate (-)
The source for all these variables is the LFS (Labour Force Survey).
5
| 21
References
Clark, A.E. (2005), “Your Money or Your Life: Changing Job Quality in OECD Countries”,
British Journal of Industrial Relations, No. 43, pp. 377-400.
Davoine, L. (2007), La qualité de l’emploi: une perspective européenne, PhD thesis, Université Paris 1.
Davoine, L., C. Erhel and M. Guergoat-Larivière (2008a), A Taxonomy of European Labour
Markets Using Quality Indicators, Final report for the European Commission, DG
Employment, Rapport de recherche du Centre d’Etudes de l’Emploi No. 45, May.
Davoine, L., C. Erhel and M.Guergoat-Lariviere (2008b), “Monitoring Employment Quality in Europe: European Employment Strategy Indicators and Beyond”, Revue Internationale
du Travail, No. 147 (2-3), Septembre, pp.163-198.
European Commission (2008), Employment in Europe, Directorate General for Employment, Social Affairs and Equal Opportunities.
European Foundation for the Improvement of Working Conditions (EUROFOUND) (2008),
More and better jobs: Patterns of employment expansion in Europe.
Gallie, D. (2007), Employment regimes and the quality of work, Oxford: Oxford University Press.
Green, F. (2006), Demanding Work. The paradox of job quality in the affluent economy, Princeton and Oxford: Princeton University Press.
ILO (1999), Decent Work, Report of Mr. Juan Somavia, ILO Director-General, 87th session of the International Labour Conference.
Layard, R. (2005), Happiness. Lessons from a New Science, London: Allen Lane.
Leschke, J. and A. Watt (2008), Putting a number on job quality? Constructing a European Job
Quality Index, ETUI-REHS Working Paper No. 2008.03, European Trade Union
Institute, Brussels.
Schmid, G. (2006), “Social risk management through transitional labour markets”,
Socio-Economic Review, No. 4, pp. 1-33.
Schmid, G. and B. Gazier (2002), The Dynamics of Full Employment. Social Integration