HAL Id: hal-01084440
https://hal.archives-ouvertes.fr/hal-01084440
Submitted on 19 Nov 2014
HAL is a multi-disciplinary open access
archive for the deposit and dissemination of
sci-entific research documents, whether they are
pub-lished or not. The documents may come from
teaching and research institutions in France or
L’archive ouverte pluridisciplinaire HAL, est
destinée au dépôt et à la diffusion de documents
scientifiques de niveau recherche, publiés ou non,
émanant des établissements d’enseignement et de
recherche français ou étrangers, des laboratoires
The BioKET Biodiversity Data Warehouse: Data and
Knowledge Integration and Extraction
Somsack Inthasone, Nicolas Pasquier, Andrea G. B. Tettamanzi, Célia da
Costa Pereira
To cite this version:
Somsack Inthasone, Nicolas Pasquier, Andrea G. B. Tettamanzi, Célia da Costa Pereira. The BioKET
Biodiversity Data Warehouse: Data and Knowledge Integration and Extraction. Advances in
Intelligent Data Analysis XIII 13th International Symposium, IDA 2014, Leuven, Belgium, October 30
-November 1, 2014. Proceedings, Oct 2014, Leuven, Belgium. pp.131 - 142,
�10.1007/978-3-319-12571-8_12�. �hal-01084440�
The BioKET Biodiversity Data Warehouse:
Data and Knowledge Integration and Extraction
Somsack Inthasone, Nicolas Pasquier,
Andrea G. B. Tettamanzi, and C´elia da Costa Pereira
Univ. Nice Sophia Antipolis, CNRS, I3S, UMR 7271, 06903 Sophia Antipolis, France
{somsacki,pasquier}@i3s.unice.fr,{andrea.tettamanzi,celia.pereira}@unice.fr
Abstract. Biodiversity datasets are generally stored in different for-mats. This makes it difficult for biologists to combine and integrate them to retrieve useful information for the purpose of, for example, efficiently classify specimens. In this paper, we present BioKET, a data warehouse which is a consolidation of heterogeneous data sources stored in different formats. For the time being, the scopus of BioKET is botanical. We had, among others things, to list all the existing botanical ontologies and re-late terms in BioKET with terms in these ontologies. We demonstrate the usefulness of such a resource by applying FIST, a combined biclus-tering and conceptual association rule extraction method on a dataset extracted from BioKET to analyze the risk status of plants endemic to Laos. Besides, BioKET may be interfaced with other resources, like GeoCAT, to provide a powerful analysis tool for biodiversity data. Keywords: Biodiversity, Information Technology, Ontologies, Knowl-edge Integration, Data Mining.
1
Introduction
Biological diversity, or biodiversity, refers to the natural variety and diversity of living organisms [26]. Biodiversity is assessed by considering the diversity of ecosystems, species, populations and genes in their geographical locations and their evolution over time. Biodiversity is of paramount importance for a healthy environment and society, as it ensures the availability of natural resources and the sustainability of ecosystems [6, 10, 13, 16, 22, 25]. The effects of biodiversity loss on the environment, caused by habitat loss and fragmentation, pollution, climate change, invasive alien species, human population, and over-exploitation can affect all life forms and lead to serious consequences [9]. Understanding biodiversity is an essential prerequisite for sustainable development.
For many years, biodiversity datasets have been stored in different formats, ranging from highly structured (databases) to plain text files, containing plant descriptions (vocabularies and terms). Numerous data and knowledge reposi-tories containing biodiversity and environmental information are available on the Internet as on-line and off-line resources nowadays. Data repositories store
large amounts of information depicting facts on concrete objects related to a specific domain of application, e.g., results of environmental studies or invento-ries of species in a geographic location. This makes it difficult for botanists or zoologists to combine and integrate them to retrieve useful information for the purpose of identifying and describing new species.
The ever increasing availability of data relevant to biodiversity makes the idea of applying data mining techniques to the study of biodiversity tempting [12].
Data mining, also known as knowledge discovery from data (KDD), is a set of concepts, methods and tools for the rapid and efficient discovery of previously unknown information, represented as knowledge patterns and models, hidden inside massive information repositories [11].
One important obstacle to the application of data mining techniques to the study of biodiversity is that the data that might be used to this aim are somewhat scattered and heterogeneous [24]. Different datasets cover different aspects of the problem or focus on some geographical areas only. None of them is complete and there is no standard format.
To overcome these limitation, we have designed and implemented BioKET, a data warehouse whose purpose is to consolidate a maximum of data sources on biodiversity in a logically organized, coherent, and comprehensive resource that can be used by the scientific community as a basis for data-intensive studies.
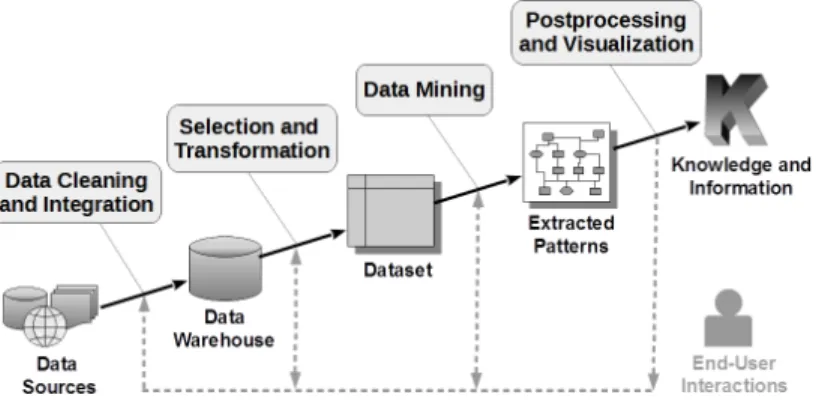
The main contribution of this paper is to provide a detailed account of how the BioKET data warehouse has been designed and populated, by consolidating and integrating multiple and heterogeneous sources of data. The reader should not underestimate the methodological challenges and the practical problems that had to be overcome in order to achieve that result. As all data mining practition-ers agree, pre-processing, which includes data cleaning, integration, and trans-formation is the most time-consuming and critical phase of the data mining process [14, 15] illustrated in Figure 1.
Fig. 1:Main phases of a data mining process
We demonstrate the use of such resource by applying FIST, a combined biclustering and conceptual association rule extraction method already described
in the literature [17], on a dataset extracted from it to analyze the risk status of plants endemic to Laos.
2
The BioKET Data Warehouse
The BioKET data warehouse is the consolidation of four main data sources: – BIOTIK [2] (Western Ghats of India and National University of Laos), which
contains 652 species records;
– the herbarium from the BRAHMS repository [3] (National University of Laos, Faculty of Forestry), with 7548 species records;
– the herbarium from the NAPIS repository [18] (Lao Ministry of Public Health, Institute of Traditional Medicine), with 747 species records; – the IUCN Red List Data [27], with 71570 species records.
These data sources are stored in different formats: BIOTIK and IUCN Red List are in HTML, while the two others use, respectively, the dBase and Paradox file formats. Integrating such diverse data sources required performing the following tasks:
1. Listing all botanical and plant ontologies available on the Internet.
2. Selecting relevant information (phenotypic/plant traits/features/characteristics). 3. Relating terms in our database with terms in these ontologies.
4. Searching for thesauri/glossaries/taxonomies of terms for plants available on the Internet.
5. Relating terms in our database with terms in these thesauri.
6. Relating terms in Plant Ontology (PO) (which seems to be the most com-plete ontology in Botany) with terms/definitions (e.g., Latin terms) in these thesauri.
The first step was to extract data from sources and store them in a standard file format (such as an Excel spreadsheet), by using database management tools. Then, data cleaning was performed by using advanced Excel functions. The next step was to generate and link Google Maps Geocoding Service with the BIOTIK, BRAHMS, and NAPIS data by using VBA script (GoogleGeoLocation Function). The last step was to import the data thus obtained into the BioKET database, under MySQL.
A key factor for the integration and the enrichment of the data was the use of ontologies. Formal ontologies are a key for the semantic interoperability and integration of data and knowledge from different sources. An ontology may be regarded as “a kind of controlled vocabulary of well-defined terms with specified relationships between those terms, capable of interpretation by both humans and computers” [28]. From a practical point of view, an ontology defines a set of concepts and relations relevant to a domain of interest, along with axioms stating their properties. An ontology thus includes a taxonomy of concepts, a formally defined vocabulary (called a terminology), and other artifacts that help structure a knowledge base. A knowledge base that uses the terms defined in an
ontology becomes usable by and interoperable with any other system that has access to that ontology and is equipped by a logic reasoner for it [19].
It was thus important to construct a map among all the concepts in all the data sources and all the considered ontologies. It is worth noting that (i) some concepts are not equally represented in all the sources, (ii) some are represented in some sources and not in others and (iii) other concepts are not represent at all. The mapping process works as follows: the textual descriptors of plants are segmented into small chunks, which are then matched with the labels of concepts in the target ontology. For instance, from the descriptor “evergreen tree up to 8 m”, we can in infer that “evergreen” is related to “shedability”, “up to 8m” is related to “height” and “tree” is related to “plant type ”. In the process, new concepts may be generated (e.g., from the textual descriptor “branches ascending or horizontal”, where “branch”, “branch ascending”, and “branch horizontal” match concepts in the ontology, a new concept “branch ascending or horizontal”, subsumed by “branch” and subsuming the latter two is generated). The plant record can thus be automatically enriched with a large number of “implicit” fields, inferred from the ontology. We have designed a relational data base of concepts that make it possible to relate concepts represented in different ways.
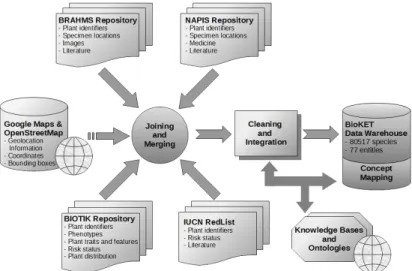
The result of this integration process — the BioKET data warehouse — is schematized in Figure 2. BioKET contains 77 relationship entities and a total of 80,517 records.
Fig. 2:An Overview of the BioKET Data Integration Process
As pointed out by many researchers (see, e.g., [1]), to conserve organisms, whether plant or animal, one important step to take is to identify rare and en-dangered organisms in a given geographical area or country. The integration of geographical information from Geographical Information Systems (GIS) with
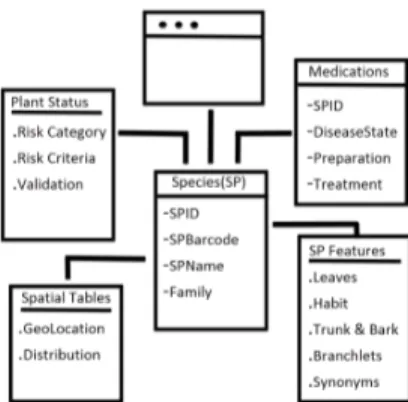
Fig. 3:Overview of the BioKET Datawarehouse Entity-Relationship Model
species data, and its use in data mining studies is the object of the biodiversity informatics project of the W. P. Fraser Herbarium (SASK) [20]. The partici-pants in such project developed an integrated bio-geography GIS model, using Google Maps API, based on data mining concepts to map and explore flora data. This allows data to be explored on a map and analyzed in several ways to reveal patterns showing relationships and trends that are not discernible in other representations of information.
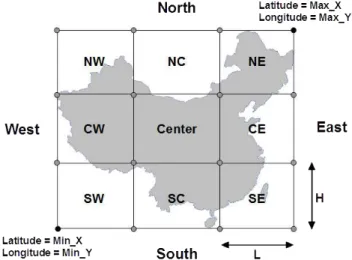
The BioKET data warehouse integrates geographical information and 8,947 species out of the 80,517 total species have descriptions of specimen location and risk status that may differ depending on the area considered. This infor-mation is described at different levels of precision, from continent to specific places such as cities or villages. For example, Cratoxylum formosum grows up in Myanmar, South China, Thailand, Indochina, and Laos (Khammouan) [2]. This species is also reported in the Lower Risk/Least Concern category by IUCN Red List data [27]. The integration of geolocation information allows to explore species properties in different areas using the GeoCAT (Geospatial Conservation Assessment Tool) platform [8]. GeoCAT is based on Google Maps to explore geo-graphical information if coordinates, i.e., latitudes and longitudes, are provided. We already linked Google Maps with the terms of geographical information of each source (BIOTIK, BRAHMS, and NAPIS) and extracted their coordi-nates into BioKET database system. Google Maps does not support coordicoordi-nates of directions (South, North, East, West, etc.) like “South China”, but Google Bounding Box (BBox) coordinates are provided. We propose to improve this issue by calculating the coordinates for each direction (Figure 4) from Google BBox coordinates.
In the geolocation domain, the BBox of an area on Earth is defined by two points corresponding to the minimal and maximal longitudes and latitudes of the area [4]. Figure 4 shows the 13 partitions of an area: the 9 elementary partitions and the North, South, East and West partitions that result of merging the 3 corresponding elementary partitions, e.g., NW, NC and NE for North. This
multilevel partitioning allows to represent location related properties of species, such as risk status or abundance for instance, at different area covering levels.
Fig. 4:Thirteen partitions for an area on Earth
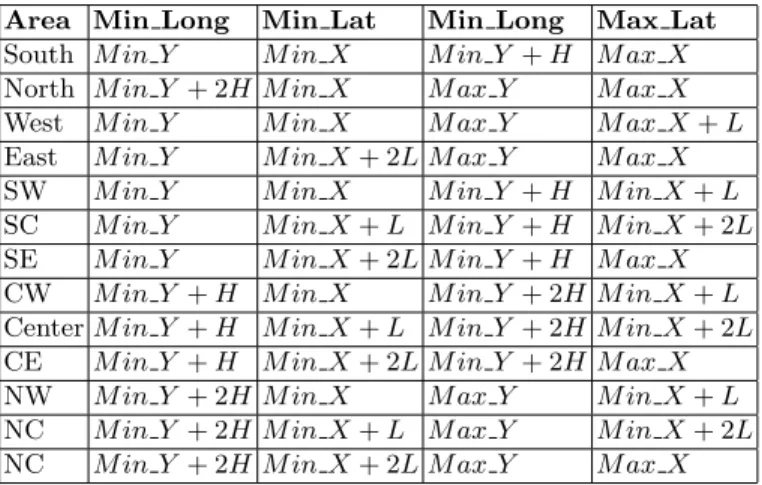
Formulas to calculate the BBox of each partition are given in Table 1. These computations use the L and H values computed from the minimal (M in X, M in Y) and maximal (M ax X, M ax Y ) longitude and latitude coordinates of the BBox of the partitioned area as follows:
L=(M ax−X− M in−X)
3 , H=
(M ax−Y − M in−Y)
3 .
This computation of partitions can be applied to all objects defined by a geolocation bounding box, from continents to cities. For example, using the BBox of China, that is {73.4994137, 18.1535216, 134.7728100, 53.5609740}, the BBox of Southern China will be computed as {73.4994137, 18.1535216, 93.9238791, 53.5609740}.
3
BioKET Experimental Analysis
For experimental purpose, we constructed a dataset containing information on the 652 species extracted from the Biotik repository. This information is rep-resented as 1834 binary attributes describing morphological and environmental properties (characteristics of part of the plant, size, habitat, exudation, etc.) and risk status of species. Extracting knowledge patterns can then provide support to relate increases and decreases in risk status to environmental factors impacting specific species (climate change, pollution, etc.). They can also help taxonomists to analyze the different types of species in an ecosystem, e.g., associating species
Table 1:Partition Bounding Box Computations Area Min Long Min Lat Min Long Max Lat South M in Y M in X M in Y + H M ax X North M in Y + 2H M in X M ax Y M ax X West M in Y M in X M ax Y M ax X+ L East M in Y M in X+ 2L M ax Y M ax X SW M in Y M in X M in Y + H M in X + L SC M in Y M in X+ L M in Y + H M in X + 2L SE M in Y M in X+ 2L M in Y + H M ax X CW M in Y + H M in X M in Y + 2H M in X + L Center M in Y + H M in X + L M in Y + 2H M in X + 2L CE M in Y + H M in X + 2L M in Y + 2H M ax X NW M in Y + 2H M in X M ax Y M in X+ L NC M in Y + 2H M in X + L M ax Y M in X+ 2L NC M in Y + 2H M in X + 2L M ax Y M ax X
with specific features and risk categories, and their viability, or growth rate, in some particular areas.
3.1 Conceptual Bicluster Extraction
This dataset was analyzed using the FIST approach which is based on the fre-quent closed itemsets framework. FIST extracts minimal covers of conceptual association rules and biclusters jointly.
Conceptual biclusters of the form {I1 V1} associate to a maximal set of
instances I1, a maximal set of variable values V1 that are common to all
in-stances. In other words, a bicluster is a sub-matrix associating a subset of rows and a subset of columns such that all these rows have a similar value for each of these columns. Conceptual biclusters are partially ordered according to the inclusion relation and form a lattice. This hierarchical organization allows to explore groups of instances (species) and properties (characteristics) at different levels of abstraction: the highest biclusters in the lattice regroup a large number of properties shared by small groups of instances; the lowest biclusters regroup small set of properties that are common to large group of instances.
Conceptual association rules are rules with the form {V1 −→ V2, I1, support,
confidence, lift} where V1and V2are sets of variable values (properties) and I1is
the set of instances (species) supporting the rule. Statistical measures computed for each rule are:
– support = P (V1∪V2) (or count(V1∪V2) = |I1| if given as an absolute number)
evaluates the scope, or weight, of the rule in the dataset. It corresponds to the proportion of instances containing V1 and V2among all instances.
– confidence = P(V1∪V2)
P(V1) evaluates the precision of the rule. It corresponds to
the proportion of instances containing V2 among those containing V1. Rules
with confidence = 1, that have no counter-example in the dataset, are called exact rules. Rules with confidence < 1 are called approximate rules.
– lift = P(V1∪V2)
P(V1)P (V2) corresponds to the correlation between occurrences of V1
and V2:
• lift > 1 means there is positive correlation between V1 and V2,
• lift = 1 means V1 and V2 are independent,
• lift < 1 means there is a negative correlation between V1 and V2.
Extraction parameters are the minsupport threshold, which corresponds to the minimal number of supporting instances required for a rule to be considered valid, and the minconfidence threshold, which corresponds to the minimal con-fidence required in order to consider a rule valid.
Experiments were conducted on a Dell PowerEdge R710 server with 2 Intel Xeon X5675 processors at 3.06 GHz, each possessing 6 cores, 12 MB cache mem-ory, 24 GB of DDR3 RAM at 1333 MHz and 2 Hot Plug SAS hard disks of 600 GB at 15000 rounds/min with RAID 0 running under the 64 bits CentOS Linux operating system.
The numbers of patterns extracted, i.e., generators, biclusters, and rules, are shown in Figure 5. For this experiment, the minsupport threshold was varied between 50% (326 species) and 0.5% (3 species). The minconfidence threshold was varied between 50% and 1%. It should be noted that the vertical axes are on a logarithmic scale.
Generators, biclusters and exact rules Approximate rules Fig. 5:Number of Patterns Generated by FIST.
3.2 Extracted Pattern Evaluation
In this section, we present some interesting conceptual association rules obtained from FIST. We would like to stress that these results mainly depend on the data collected within BioKET, which, as far as we know, is the only data warehouse consolidating different biodiversity information sources. These rules make it pos-sible to estimate the risk status of a plant species according to IUCN RedList categories (Lower Risk, Endangered, Least Concern, Vulnerable, Critically En-dangered, Rare, Data Deficient, Rare & Threatened, Possibly Extinct) with re-spect to their characteristics and vice-versa. For this experiment, the minsupport
threshold was set to 1%, which corresponds to 6 species in the dataset, and the minconfidence threshold was set to 50%.
One of the obtained rules with the highest lift (11.75) is
INFL:pedicels up to 3 mm long, BBT:Twigs terete, INFL:axillary⇒ RS:Lower Risk. (1) According to this rule, of the six species with pedicels up to 3 mm long, twigs terete, and axillary inflorescence, 66,67% belong to the lower risk category. The identified species are Cratoxylum cochinchinense, Cratoxylum formosum, Engel-hardtia serrata, EngelEngel-hardtia spicata, Irvingia malayana, and Knema globularia. This result is corroborated, for example, by information from Singapore flore.1
The following rule states, with 83.33% confidence, that a plant species clas-sified as critically endangered has simple leaves:
RS:Rare⇒ LEAVES:Leaves simple. (2) This rule is corroborated, for example, by [7], which describes Gaultheria paucin-ervia, a new species restricted to the eastern slopes of Mt. Kinabalu in Sabah State, Borneo, Malaysia, which has been confused with Gaultheria borneensis Stapf, but differs in its more erect habit and larger stature, longer nonap-pressed leaf trichomes, purple (vs. white) fruiting calyx, and lower elevation range, among other features. Gaultheria paucinervia has not yet been assessed for the IUCN Red List, (but is in the Catalogue of Life: Gaultheria paucinervia P.W. Fritsch & C.M. Bush apparently). Besides, by taking into account the features in the geographical data source, the FIST algorithm finds the rule
RS:Rare, GEO:Western Ghats⇒ LEAVES:Leaves simple, (3) which identifies species Bentinckia condapanna, Drypetes malabarica, Glycosmis macrocarpa, Holigarna grahamii, Lasianthus jackianus, Pittosporum dasycaulon, and Vepris bilocularis, all found in the Western Ghats.
The following rule states, with 79.59% confidence, that a plant species clas-sified as Vulnerable has simple leaves:
RS:Vulnerable⇒ LEAVES:Leaves simple. (4) This result is corroborated, for example, by [23, 29]. In [23], the author discusses the applicability of the Accelerated Pioneer-Climax Series (APCS) method for restoring forests to degraded areas in Southern Vietnam using many local species such as Hopea odorata directly concernend by the above rule and which has been identified as vulnerable in the IUCN red list. Wickneswari [29], instead, proposes a document which can help the readers to understand the entire life cycle of Hopea odorata Roxb in Malaysia, Vietnam, Cambodia, and Thailand.
1 URL: http://florasingapura.com/Home.php. The aim of this site is to to bridge
the gap between the terse technical descriptions of plants found in various botanical text books and what is observed in the Singapore forests.
The following rule, whose lift is 1.189 and whose support is 4.14%, states, with 55.1% confidence, that a plant species classified as vulnerable has both glabrous and simple leaves:
RS:Vulnerable⇒ LEAVES:glabrous, LEAVES:Leaves simple. (5) Indeed, [21], proposing a deep and comprehensive botanical study of two rock outcrops in India, corroborates this rule.
Another interesting rule with a support of 3.37% and a lift of 1.07, states, with 59.46% confidence, that a plant species classified as having a lower risk has alternate leaves:
RS:Lower Risk⇒ LEAVES:alternate. (6) This result is corroborated, for example, by results obtained by Craenel [5]. Species concerned include Aglaia elliptica, Aphanamixis polystachya, and Prunus arborea. As seen for Rule 3, the integration of geolocation information with multiple heterogeneous biological data can show common properties related to species with a specific risk status and/or in a specific area. For instance, the following rule with a lift of 4.26 states that 88.9% of species having a lower risk in the Indochina geographic region (i.e., 8 species) have leaves with entire margin:
RS:Lower Risk, GEO:Indochina⇒ LEAVES:Margin entire. (7) Another example of such rules is the following, showing that 88.2% of en-dangered species in Western Ghats have alternate leaves:
RS:Endangered, GEO:Western Ghats⇒ LEAVES:Alternate. (8) This rule, whose lift is 1.96, concerns 15 species. Such patterns can help compar-isons between different geographical areas, at different levels of abstraction. For instance, considering the Malaysia geographic region, a part of Indochina, only 61.5% of species having a lower risk have leaves with entire margin as stated by the following rule, whose lift is 2.95 and which concerns 8 species:
RS:Lower Risk, GEO:Malaysia⇒ LEAVES:Margin entire. (9) If we consider the Agasthyamalai area, lying at the extreme southern end of the Western Ghats mountain range along the western side of Southern India, we can see from the following rule that only 50% of endangered species in this area have alternate leaves, whereas the percentage is of 88.2% in the whole Western Ghats:
RS:Endangered, GEO:Agasthyamalai⇒ LEAVES:Alternate. (10) This rule, which has a lift of 4.27, concerns 10 species.
All the above rules have been constructed from the consolidation of data from the four data sources presented above. Although some of the species are not yet included in the IUCN red list, combining information from the three other data sources allowed us to infer their risk status using the rules constructed by
FIST. This is the case, e.g., for the species related to Rule 3, with the sole exception of Bentinckia condapanna, whose risk category is explicitly in IUCN. Indeed, Glycosmis macrocarpa’s taxon has not yet been assessed for the IUCN Red List, but is listed in the Catalogue of Life as Glycosmis macrocarpa Wight. The same holds for Drypetes malabarica (in the Catalogue of Life as Drypetes malabarica (Bedd.) Airy Shaw ), Lasianthus jackianus (in the Catalogue of Life as Lasianthus jackianus Wight), Pittosporum dasycaulon (in the Catalogue of Life as Pittosporum dasycaulon Miq), and Vepris bilocularis (in the Catalogue of Life as Vepris bilocularis (Wight & Arn.) Engl.).
4
Conclusion
We presented BioKET, a data warehouse obtained by consolidation of a number of heterogeneous data sources on biodiversity. As far as we know, this is the first data warehouse containing that amount of heterogeneous data which can be used for conducting data-intensive studies about biodiversity. For the moment, the scopus of BioKET is botanical, but we plan to integrate other types of data. We have demonstrated the usefulness of BioKET by applying FIST, an ex-isting conceptual biclustering method, on a dataset extracted from BioKET to analyze the risk status of plants endemic to Laos. The evaluation of the extracted patterns against the botanical literature shows that meaningful knowledge can be infered from BioKET.
References
1. Benniamin, A., Irudayaraj, V., Manickam, V.S.: How to identify rare and endan-gered ferns and fern allies. Ethnobotanical Leaflets 12, 108–117 (March 2008) 2. Biodiversity informatics and co-operation in taxonomy for interactive shared
knowledge base (BIOTIK). http://www.biotik.org (Accessed September 2011) 3. Botanical research and herbarium management system (BRAHMS). http://
herbaria.plants.ox.ac.uk/bol/(Accessed January 2013)
4. http://wiki.openstreetmap.org/wiki/Bounding_box (Accessed April 2014) 5. De Craenel, L.R., Wanntorp, L.: Floral development and anatomy of salvadoraceae.
Ecological Applications 104(5), 913923 (Jul 2009)
6. Eldredge, N.: Life on Earth: An Encyclopedia of Biodiversity, Ecology, and Evolu-tion, Life on Earth, vol. 1. ABC-CLIO (2002)
7. Fritsch, P.W., Bush, C.M.: A new species of gaultheria (ericaceae) from mount kinabalu, borneo, malaysia. Novon: A Journal for Botanical Nomenclature 21(3), 338–342 (September 2011), http://dx.doi.org/10.1371/journal.pone.0005725 8. Geocat: Geospatial conservation assessment tool. http://geocat.kew.org/
(Ac-cessed April 2014)
9. Global biodiversity outlook 3. http://www.cbd.int/gbo3 (Accessed January 2013) 10. Grillo, O., Venora, G. (eds.): Biological Diversity and Sustainable Resources Use.
InTech (2011)
11. Han, J., Kamber, M., Pei, J.: Data Mining: Concepts and Techniques. Morgan Kaufmann Publishers Inc., San Francisco, USA, 3rd edn. (2011)
12. Hochachka, W.M., Caruana, R., Fink, D., Munson, A., Riedewald, M., Sorokina, D., Kellings, S.: Data-mining discovery of pattern and process in ecological systems. The Journal of Wildlife Management 71(7), 2427–2437 (2007)
13. Institute, W.R.: Ecosystems and human well-being: Biodiversity synthesis. Millen-nium Ecosystem Assessment (2005)
14. Marb´an, O., Mariscal, G., Segovia, J.: A data mining & knowledge discovery pro-cess model. In: Data Mining and Knowledge Discovery in Real Life Applications. InTech, Vienna, Austria (2009)
15. Mariscal, G., Marb´an, O., Fern´andez, C.: A survey of data mining and knowl-edge discovery process models and methodologies. The Knowlknowl-edge Engineering Review 25(2), 137–166 (May 2010), http://journals.cambridge.org/article_ S0269888910000032
16. Midgley, G.: Biodiversity and ecosystem function. Science 335(6065), 174–175 (2012), http://www.sciencemag.org/content/335/6065/174.short
17. Mondal, K.C., Pasquier, N., Mukhopadhyay, A., Maulik, U., Bandyopadhyay, S.: A new approach for association rule mining and bi-clustering using formal concept analysis. In: MLDM 2012. pp. 86–101
18. Natural products information system (NAPIS). http://whitepointsystems.com (Accessed February 2013)
19. Obrst, L.: Ontologies for semantically interoperable systems. In: CIKM 2003. pp. 366–369. http://doi.acm.org/10.1145/956863.956932
20. Peters, C., Peters, D., Cota-S´anchez, J.: Data mining and mapping of herbarium specimens using geographic information systems: A look at the biodiversity infor-matics project of the W. P. Fraser Herbarium (SASK). http://www.herbarium. usask.ca/research/Data\%20Mining,\%20CBA\%202009.pdf(2009)
21. Rahangdale, S.S., Rahangdale, S.R.: Plant species composition on two rock out-crops from the northern western ghats, maharashtra, india. Journal of Threatened Taxa 6(4), 55935612 (2014)
22. Shah, A.: Why Is Biodiversity Important? Who Cares? Global Is-sues (April 2011), http://www.globalissues.org/article/170/ why-is-biodiversity-important-who-cares
23. So, N.V.: The potential of local tree species to accelerate natural forest succession on marginal grasslands in southern vietnam. http: //www.forru.org/extra/forru/PDF_Files/frfwcpdf/part2/p28%20So%20The% 20potential%20of%20local.pdf
24. Spehn, E.M., Korner, C. (eds.): Data Mining for Global Trends in Mountain Bio-diversity. CRC Press (2009)
25. Talent, J.: Earth and Life: Global Biodiversity, Extinction Intervals and Biogeo-graphic Perturbations Through Time. International Year of Planet Earth, Springer (2012)
26. The convention on biological diversity (CBD). http://www.cbd.int (Accessed September 2013)
27. The IUCN Red List of Threatened Species. http://www.iucnredlist.org/ (Ac-cessed January 2014)
28. Whetzel, P., Noy, N., Shah, N., Alexander, P., Nyulas, C., Tudorache, T., Musen, M.: What are ontologies? http://www.bioontology.org/ learning-about-ontologies(Accessed March 2013)
29. Wickneswari, R.: Hopea odorata roxb. http://www.apforgen.org/apfCD/ Information%20Sheet/Hopea_odorata.pdf