Publisher’s version / Version de l'éditeur:
Lighting Research and Technology, 19, 4, pp. 101-103, 1987
READ THESE TERMS AND CONDITIONS CAREFULLY BEFORE USING THIS WEBSITE.
https://nrc-publications.canada.ca/eng/copyright
Vous avez des questions? Nous pouvons vous aider. Pour communiquer directement avec un auteur, consultez la
première page de la revue dans laquelle son article a été publié afin de trouver ses coordonnées. Si vous n’arrivez pas à les repérer, communiquez avec nous à [email protected].
Questions? Contact the NRC Publications Archive team at
[email protected]. If you wish to email the authors directly, please see the first page of the publication for their contact information.
NRC Publications Archive
Archives des publications du CNRC
This publication could be one of several versions: author’s original, accepted manuscript or the publisher’s version. / La version de cette publication peut être l’une des suivantes : la version prépublication de l’auteur, la version acceptée du manuscrit ou la version de l’éditeur.
Access and use of this website and the material on it are subject to the Terms and Conditions set forth at
On time to see
Rea, M. S.; Boyce, P. R.; Ouellette, M. J.
https://publications-cnrc.canada.ca/fra/droits
L’accès à ce site Web et l’utilisation de son contenu sont assujettis aux conditions présentées dans le site LISEZ CES CONDITIONS ATTENTIVEMENT AVANT D’UTILISER CE SITE WEB.
NRC Publications Record / Notice d'Archives des publications de CNRC:
https://nrc-publications.canada.ca/eng/view/object/?id=93cab5d4-bf9c-4bbd-afc2-486a8fc19aba https://publications-cnrc.canada.ca/fra/voir/objet/?id=93cab5d4-bf9c-4bbd-afc2-486a8fc19abaI
Ref
, r a m
' J C I
I
TH1
National Research
Conseil national
'
N 2 1 d
'
1+1
Councll Canada
de
mcherches Canada
n,
1 7 2 0
I
1 9 8 7
Institute for
lnstitut de
Research in
recherche en
B
LD
G
,
-
Construction
construction
On
Time
to
See
by
M.S.
Rea, P.R. Boyce and M.J. Ouellette
Reprinted from
Lighting Research and Technology
Vol. 19, No. 4.1987
p. 101-io3
(IRC Paper No. 1720)
NRCC 331
06
Lighfing Res. T e f h l . 19(4) 101-103 (1987) Printed in Great Bri&
S ~ m m ~ r ~ r Reaction times of young adult subjects to luminous increments of various contrast were obtained at two adaptation levels. Functions char~cterising the data are consistent with elec~ophysiological recordings from cortical neurons and from the general contrast response pattern presented in other psychophysical studies. These functions help to detail some of the emerging principles of visual performance based on visual response time, and may be useful to practitioners interested in predicting the speed of performing realistic tasks.
O n
time to see
M S REAt PhD, P
R
BOYCe BSc PhD MIS MCIBSE and M J OUELLETTEf BSct
Institute for Research in Construction, National Research Council Canada, Ontario KIA 0R6, C a ~ d a $ Elecuicity Council Research Centre, Capenhum, Chester CHI 6ES, UKReceived 28 April 1987, in 6aal form 3 August 1987
1 Introduction
A model of visual performance relating visual events to the time for visual response would be useful to many prac- titioners concerned with the design or evaluation of 'real- world' conditions. Reaction times are vital for many military, athletic, and transportation applications. A quantitative model would help in tailoring each visual environment in order to maximise performance. It might also be applied in commercial or industrial situations where economic decisions are based upon visual response time. Although a number of psychophysical have shown how visual response time is affected by various aspects of the visual stimulus, a g e n d model of visual performane has yet to be developed. Data from the reaction time experiment reported here support e few basic principles for any such model.
2 Methods
Five subjects MCQI the ages of 16 and 26 years (median =
Is), none of wbom had prior experience in making psy-
chophysical judgements, were selected for this study on the basis that they had an uncomcted visual acuiry of 1.0 or 'better with the left eye. The subjects were seated in turn at a chin rest so that the stimulus display, an
HP
2647A Graphic Computer monitor, could be seen by the left eye through the centre of a 2 mm diameter artificial pupil. The artificial pupil was in front of a beam splitter that superimposed a circular (20" h e t e r ) , unrform luminous veil over the entire stimulus display; 13 or 47 cd rn-I (41 or 148 uolands) werechosen as veil, or adaptation, luminances for the experiment. A fixation pattern, consisting of four narrow luminous bars,
was displayed conrinuously on the dark computer monitor.
of the fixation pattern. The fixation pattern and the target were always the same luminance. Betwan 8 and 11
(median = 9) target luminances were used at both adaptauon Iuminances; the various target luminances provided target contrasts C ranging in value from 0.053 to 3.435. Adaptation luminances were counterbalanced across subjects in the experiment. Target luminanas, for a given adaptation luminance, were presented in unsystematic orders chosen
by the experimenter while conducting the experiment. As soon as the subject detected the target, (s)he pressed the space bar on the computer keyboard. (After the subject responded the target went off.) The reaction h e for each trial ( R T ~ (s)) was recorded by the computer as the rime between target onset and subject response.
The readon h e data used in
this
report were obtained after each subiect completed about 300 practice M s . Exper- imental data were collected from each subject in blocks of 15 trials. The stimulus conditions (target contrast and adaptation luminance) were constant within a block. To limit false positive responses no target was presented, on average, on 3 of the 15 vials within a block. Thus, the reaction time data are based upon about 12 trials per stimulus condition per subject.In
e separatesession each subject provided contrast threshold data. As in the reaction time experiment, subjects viewed the stimulus &splay with their left eye thmugh the artificial pupil and a luminous veil (13 or 47 cd rn-l). The target was flashed on for 0.72 s s t a rate of 0.69 Hz to mimic the Bashed targets presented in the reaction time experiment. Each subiect adjusted the luminance of the target until the onset of the target was 'just invisible'. The median of five successive settings was &en as the subject's threshold contrast (m)for that adaptation luminance.
Following a ready signal from the experimenter and a ran-
dom time delay set by the computer, a square luminous 3 Results
target (25' on a side) was suddenly displayed in the centre - -
-5 Target conuast C is defined as (L,
-
L.)/L., whae L, is the veil, or Visual performance, as mightk
m
d
eimphysio- adaptation luminance, and L, is the luminance of the stimulus. Since L. = logically by the amplitude of an evoked potenrial or psy-& + I,L, is the luminance of he target rneasud dirrctly frorn c h o ~ ~ ~ s i c d ~ by magnifude incrrases
the computer monitor, then, Jimply, C = L,/L.. equation muma with s t h u l u ~ strength. Although somewhat arbitrary, it
t h the of the background & ~ d of the monitor zero. is consistent and ~0ll~eIIieIlt to have m t a S W of VkUal
Although not zero, due to suay light in the test room, its h m i m ~ c e was pKformance for this experiment also increase with stimulus
quite low and mated as such. strength. Therefwe R , the r e c i p r d of KT;, was used as
M
S Rea, P R Boyce andM
J O u e l hthe dependent measure for each trial in this experiment: 4 r r I I I I I I ~ I I I 1 1 1 1 1 1 I 1 1 1 1 1 1
where AC = C
- cr,
C is the contrast of the target, CT is the threshold contrast for a particular background luminance, n is the free parameter affecting the shape of the function, Kis the free parameter affecting the shape of the function; this is the value of AC associated with half of the maximum
response, and R , is the free parameter associated with the highest estimated value of R possible for a given background 7
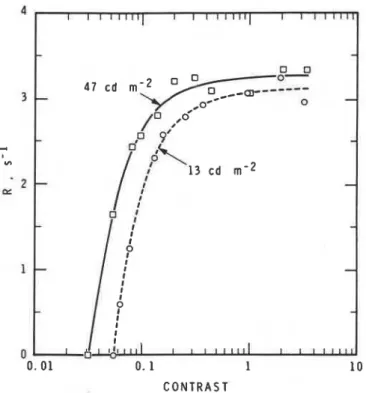
luminance, i.e. the point of saturation for the function. V) - 2
Figure 1 shows values of R from one subject (CC, Table 1 ) t~ plotted as a function of target contrast C at both adaptation luminances. The two points at R = 0 represent the contrast threshold values; all others represent the arithmetic mean of
Ri values obtained from one block of reaction time trials.
The fitted lines through the data were derived, by a least 1
squares criterion, from equation 1 and all values of R,. Inclusion or exclusion of the two threshold points has little if any effect on the regression parameter estimates. Table 1 shows the regression estimates of n,
K
and R , foreach subject at each adaptation luminance. The median 0 I I I 1 1 1 1 1 I I 1 1 t I 1
values for these parameters at each adaptation luminance are 0.01 0.1 1 10 also given in Table 1 as estimates for the young adult C O N T R A S T
population. F i 1 Reaction time performance for one subject (CC) at two adap
ne
times modeled by equation 1 are not based taion luminances. The ave&es of the reciprocal readon times (Ri in s") entirely upon visual ~ ~motor and t h are plotted as a function of target contrast. (Table 1 provides the parameter comwnents must contribute to the data. although these are estimates for equation 1 which describe the rwo curves for this subject.) prodably small. If one makes the reasonable ass-ption forthis relatively simple task that the non-visual components
Figure shows the estimated difference in visual Latency are c0ns-t. then the difference in visual response time
AT_ pmduced by changing luminance and con- produced by changes in adaptation luminance and target mt. The curve for each is based contrast can be determined. Thus, if
on the median parameter estimates from Table 1 and the
R T ~ = T~
+
T ~ - ~ (2) following equation based upon equations 1 and 3:where Tvis is the visual component of reaction time and AT,, = R T ~
-
[(AC"+
P)l(AC"R&] (4)T--%% is the non-visual 'Ornponent of reaction time, where RTd = 1 / R , at 47 cd m-'
frmn
Table 1, & allAT,, = RTd
-
RTi (3) other terms are as defined in equation I.where AT* is the difference in visual time to process the Figure 2 shows that the closer the contrast is to threshold, stimulus conditions for trial i and that for the reference the larger are the differences in visual response time. Below conditions, and RTd is an arbitrary reaction time used as a threshold, of course, these differences are h h i t e . At higher reference. contrasts, visual response time differences are very small
Table 1 Individual and median parameter estimates for the visual performance (R) data
Subject Retinal Parameter (equation 1) Residual sum
illuminance of squares
(wlands) cr n K
Lx
On
time to seeC O N T R A S T
F i2 Differences in visual response time for the experimental con-
ditions. The differences (AT, in ms) at two adaptation luminances are plotted as a function of contrast (as in Figure 1). Although truncated for graphical purposes, the ordinate extends to -m. (Table 1 provides the median parameter estimates for equation 4 which describe the two curves.)
for a given adaptation luminance, indicating that visual performance is not seriously affected by reductions in suprathreshold contrast. Somewhat larger differences are produced by changing adaptation luminance. At a contrast of 3.6, for example, the visual response is approximately 11.5 ms faster at 47cd m-2 than at 13 cdm-*.
4 Discussion
These psychophysical data indicate that visual performance, defined here as AT^, can be characterised by a few basic principles. First, there is a threshold for response; below a certain level of stimulation there are no higher-order sensory
events that can lead to behavioural responses. As the adap tation luminance increases, relatively less stimulation is nec- essary to produce a response (i.e. the contrast threshold decreases). Second, immediately after the level for threshold stimulation is surpassed, there is a rapid increase in the speed of visual response. As adaptation luminance is increased, this rapid acceleration in response speed becomes even more pronounced. Thud, a response plateau is soon reached, which extends over a fairly wide range of stimulus intensity. Here again adaptation level is important; as adaptation level increases, the height of the plateau also increases. Thus the visual performance 'contrast response surface' becomes wider, more steplike, and higher as adaptation level increases.
Several psychophysical studies('4) using response time as a dependent measure s u m these conclusions, but only
limited a t t e r n p t ~ ' ~ have been made to delineate these response characteristics precisely for a general model of visual performance. To this end, it may also be instructive to consider visual performance more broadly.
For
example, voltage changes recorded from the cortexes of cats and 9, and humans(lO) in response to' variations in stimulus contrast follow patterns very similar to the psy- chophysical responses shown here. These reaction time data more clearly define and reinforce some of the emerging principles of suprathreshold visual response and help to focus future investigations into visual performance.References
1 Lit A A m y . Pgchol. 62 159 (1949) 2 Presmde A Vision Res. 11 351 (1971)
3 Vicars W M and Lit A Vision Ru. 15 261 (1975)
4 Harwenb R S and Levi D M V i n h Re$. 18 1579 (1978)
5 Hood D C, Finkelstein M A and Buckingham E Vision Res. 19 401 (1979)
6 Musselwhite M J and Jeffreys Vision R u . 25 1545 (1985) 7 Rea M S J . IIIum. Eng. Soc. 15 41 (1986)
8 Tolhurst D J, Movshon J A and Thompson I D Exp. Brain Res. 41 414 (1981)
9 Albrecht D G and Hamilton D B 3. Neurophysiol. 48 217 (1982) 10 Shapley R Vision Res. M 45 (1986)