Publisher’s version / Version de l'éditeur:
Canadian Geotechnical Journal, 24, 3, pp. 392-405, 1987-08
READ THESE TERMS AND CONDITIONS CAREFULLY BEFORE USING THIS WEBSITE. https://nrc-publications.canada.ca/eng/copyright
Vous avez des questions? Nous pouvons vous aider. Pour communiquer directement avec un auteur, consultez la première page de la revue dans laquelle son article a été publié afin de trouver ses coordonnées. Si vous n’arrivez pas à les repérer, communiquez avec nous à [email protected].
Questions? Contact the NRC Publications Archive team at
[email protected]. If you wish to email the authors directly, please see the first page of the publication for their contact information.
NRC Publications Archive
Archives des publications du CNRC
This publication could be one of several versions: author’s original, accepted manuscript or the publisher’s version. / La version de cette publication peut être l’une des suivantes : la version prépublication de l’auteur, la version acceptée du manuscrit ou la version de l’éditeur.
Access and use of this website and the material on it are subject to the Terms and Conditions set forth at
Undrained shear strength from piezocone tests
Konrad, J. M.; Law, K. T.
https://publications-cnrc.canada.ca/fra/droits
L’accès à ce site Web et l’utilisation de son contenu sont assujettis aux conditions présentées dans le site LISEZ CES CONDITIONS ATTENTIVEMENT AVANT D’UTILISER CE SITE WEB.
NRC Publications Record / Notice d'Archives des publications de CNRC:
https://nrc-publications.canada.ca/eng/view/object/?id=6835ad29-4cf1-4ab1-ac7a-b0b062fae6ec https://publications-cnrc.canada.ca/fra/voir/objet/?id=6835ad29-4cf1-4ab1-ac7a-b0b062fae6ecSer
I ITH1.
N2ld
National Research
Conseil national
no*
1500
1
Council Canada
'de
mhbches Canada
c. 2
BLDG
--
-.Institute for
lnstitut de
Rese,arcf-(
in
recherche en
Construction
construction
Undrained
Shear
Strength
From
Piezocone Tests
I
by J.-M. Konrad and K.T. Law
Reprinted from
Canadian Geotechnical Journal
Vol. 24,
No. 3,
August 1987
p.
392
-
405
(IRC Paper No.
1500)
Price
$4.00
Undrained shear strength from piezocone tests
J.-M. KONRAD' AND K . T. LAW
Institute for Research in Construction, National Research Council of Canada, Ottawa, Ont.. Canada KIA OR6 Received November 5, 1985
Accepted March 12, 1987
With the advent of piezocones - penetrometers measuring both the mechanical resistance and induced pore pressures near the tip during penetration into the soil - a new interpretation of penetrometer test data is possible. This paper presents a review of available interpretation methods for obtaining the undrained shear strength of soft soils, and introduces a new interpretation taking into account measured pore pressures. The undrained shear strength is considered to be solely related to the ultimate cavity expansion pressure, which is one of the components of the tip resistance. The other component is calculated assuming that effective friction is developed at the cone-soil interface.
Parametric studies on the parameters required for strength determination based on the proposed method are also presented. Special self-boring pressuremeter tests to obtain relevant values of soil rigidity index, which is a key parameter for cavity expansion modelling, are described. Tests were conducted at three sites having the characteristics of soft sensitive clay, stiff sensitive clay, and clayey silt. The operational undrained strength mobilized during the cone insertion derived from the proposed model is equal to or lower than the CKoU triaxial strength, which depends on soil brittleness. The proposed approach yields results consistent with known soil behaviour at all three sites.
Key words: piezocone penetrometer, pressuremeter, excess pore-water pressure, undrained shear strength, rigidity index, in situ tests, laboratory test.
L'utilisation du pikzoc6ne permet une nouvelle interprktation des rksultats du test de pCnktration grlce aux mesures combinkes de la rksistance en pointe et de la pression interstitielle gtnkrke prks de la pointe. Cet article revoie les principales rnCthodes d'interprktation en vue d'obtenir la rksistance au cisaillement non drain6 et prksente une nouvelle mkthode qui tient compte des pressions interstitielles. La rksistance au cisaillement non draink est calculke 2 partir de la pression ultime d'expansion de cavitk qui est une des deux composantes de la rksistance 2 la pknktration. Le frottement dkvelopk le long de I'interface cBne-sol, qui est dktermink en fonction des contraintes effectives, est la deuxikme composante.
L'article prksente Cgalement le resultats d'ktudes paramktriques et dkcrit des essais spkciaux de pressiomktre autoforeur permettant la dktermination de I'indice de rigiditk du sol correspondant aux conditions d'expansion de cavitk non drainkes. Des essais ont kt6 effectuk a trois sites prksentant les caractkristiques d'argile molle et sensible, d'argile raide et sensible et de limon argileux. La rksistance au cisaillement globale mobiliske pendant la pknktration calculke en utilisant les kquations de la mkthode proposke est kgale ou infkrieure 2 la rksistance d'essais triaxiaux CKo U , qui est dkpendant de la fragilitk du sol. La mCthode proposke produit des rksultats en accord avec le comportement obsewk dans d'autres ktudes pour les sols des trois sites.
Mots clks: pCnCtromktre pikzocBne, pressiomktre, pression interstitielle, rksistance au cisaillement non draink, indice de rigiditk, essais in situ, essais au laboratoire.
Can. Geotech. J. 24. 392-405 (1987)
Introduction
Since the foundation design for these structures must con- The continuing research for oil and gas resources has led to
sider the stability during set down and during their lifetime increased exploration activity in the Arctic offshore regions. under the environmental loads, this paper will focus on the The drilling of deep wells has been camed out to date from
determination of undrained shear strength from piezocone
man-made artificial islands. The presence of very soft soils in
penenometer tests in fine-grained soils. The paper first presents
several offshore Arctic and subarctic areas causes a major con-
, a critical review of available interpretation methods, followed
in the design Of these gravity structures, P ~ in ~ ~ ~ ~ ~ ~ ~ ~ Y
by a theoretical model that estimates the total pressure
view of the very large ice loads exerted on the structures. normal to the cone face from the measured total cone resistance
The geotechnical Of these 'Oft are and induced
pore pressure. Assuming that this pressure is equal usually obtained from site investigations and laboratory testing. to the ultimate pressure of a spherical cavity expansion process, Cone penetrometer tests in soft soils, particularly offshore, the
undrained shear strength mobilized during cone insertion
where the use of other in situ tests is severely limited, are
can be derived from known cavity expansion theory in elasto-
mainly conducted to defermine the subsurface stratigraphy.
plastic medium. since this approach requires the rigidity
Indeed, the 'One penetrometer can provide continuous profiles index, the also devotes to factors that influence ,
of tip resistance, sleeve friction, and, more recently, pore
determination of the rigidity index from laboratory and self-
pressures generated during pushing. Furthermore, the relative
boring pressuremeter tests.
Of testing and Of
render it quite In another section an study deals with the appli-
cost effective' recent electronic
have ,cation of the proposed interpretation to soils from three differ- greatly enhanced the accuracy of the results, the actual inter-
ent sites ranging from soft to stiff clays to silty soils. The
pretation Of the test with respect to shear strength,
undrained &ear strength derived from piezocone tests is corn- overconsolidation ratio, and deformation and consolidation
pared with the strength obtained from field vane and laboratory
characteristics is still an area of active research. tests on undisturbed samples. The results of existing inter-
'present address: D~~~~~~~~ of ~~~~h sciences, university of pretations are also shown for one penetration data from each
KONRAD AND LAW
TABLE 1. Theoretical bearing capacity factor for deep circular foundations Solution
Nc (4 = 0) u, class Remarks Reference
7.41 u vo 1 Terzaghi (1 943)
7.0 u vo I Caquot and Kerisel (1956)
u "'> I Smooth base Meyerhof ( 195 1) u ,,, I Rough base
v,, 1 de Beer ( 1977)
UV,, 2 SCE Meyerhof (1951)
E,: Initial tangent modulus
4 [ l + l n 2 ]
+
1 u vo 2 SCE Skempton (195 1)E,: secant modulus at 50% failure stress
SCE Gibson (1950) u V', 2 SCE, finite Gibson (1950)
strain theory
:[I
+
~n l R ] u+a. 2 SCE Vesic ( 1972)+[I
+
In l R ]+
2.57 u ,, 3 SCE Vesic (1975)3
[ I
+
In IR]+
I I u ho 3 CCE Baligh (1 975)4 Trilinear Ladanyi (1967) stress-strain
relationship EuISu-Er/Suc.Sur/Su
[
E./ScE./S..NOTE: SCE: spherical cavity expansion; CCE: cylindrical cavity expansion; I n : rigidity index = G./S. = E , / ~ s . ; u,,: mean normal total stress = (a,,,
+
2 u h , , ) / 3 ; 0: semiapex angle.Review of existing theories on cone resistance
This section reviews theories seeking to relate the unit cone resistance (q,) to the undrained shear strength (Su) for incom- pressible and fully saturated soils. Most studies into the inter- pretation of cone penetration tests have fallen into one of the following classes:
(1) The classical plasticity approach to bearing capacity of deep foundations;
(2) Cavity expansion theories combined with classical plas- ticity;
(3) The principle of conservation of energy with cavity expansion;
(4) Analytical and numerical approaches using linear and nonlinear stress-strain relationships;
(5) Empirical studies attempting to relate cone resistance to undrained shear strength derived from different tests and, in some cases, to additional soil index parameters.
All known theories present the solutions for q, using the well-known relationship
Owing to the complexity of the penetration problem, the methods of interpretation refer to approximate theoretical solu- tions based on simplified assumptions with respect to soil be- haviour, shape of slip lines in the plastic zone, and boundary conditions. Class 1 solutions, based on the original work by Prandtl (1921), consider incipient failure of a rigid and plastic material and are strongly dependent on the assumed shape of the plastic zone. This is illustrated in Table 1, which presents values of N, between 7.0 and 9.94 obtained by different in- vestigators. In class 2 solutions it is assumed that the pene- tration of a pile or a cone is equivalent to expanding a spherical cavity from zero radius to a radius equal to the radius of the pile or cone in an infinite elastoplastic medium. Bishop et al.
(1945) first suggested that the end-bearing capacity of a foun- dation at any given depth was of the same order as the max- imum internal pressure in the spherical cavity. For fully satur- ated clays for which
4
= 0, the ultimate internal pressure (Pus) was expressed as[ l I qc = NcSu
+
uiNq[,I
4 Eupus = j ( ~ n
SS;
+ 1)s.
+
where N, and N, are dimensionless bearing capacity factors andu i is the initial in situ total pressure. With the condition that where E u denoted the undrained Young's modulus of the clay
4
= 0, the factor N, is equal to unity and [I] reduces to and ova the in situ total vertical stress.394 CAN. GEOTECH. J VOL 24, 1987
I
I
r
PLASTIC ZONE
STEADY STATE SOLUTION E X P A N S I O N OF C Y L I N D R I C A L FOR A ROUGH WEDGE C A V l TY TO M A 1 NTA I N OPEN HOLE
FIG. 1. Assumed failure pattern under pile point: (a) after Vesic (1975); (b) after Baligh (1975).
Meyerhof (1951) extended their approach by considering that full cohesion was mobilized along the surfaces of the pile point and that E, might be defined as the initial tangent to the triaxial stress- strain curves. Gibson (1950), using the large- strain theory of Swainger and considering full mobilization of cohesion along the surface of the pile point, proposed a mod- ified equation (shown in Table I ) where E, was conveniently defined as the secant modulus to one-half of the ultimate com- pressive strength. Skempton (1951) proposed using Gibson's equation with a 90" pile point (0 = 45") for the bearing capacity of foundations.
Vesic (1975) suggested that the bearing capacity can be estimated by determining the ultimate pressure needed to ex- pand a spherical cavity associated with a realistic failure pat- tern. Furthermore, the point resistance was assumed to be gov- erned by the total octahedral normal soil stress (a,) and not by a,,. Based on the geometry and boundary conditions shown in Fig. la, an approximate value of N , (Table 1) can be found if the average normal stress along the ring BD is assumed to be equal to P,,.
As pointed out by Vesic, in relatively dense soils the wedge associated with the pile tip pushes the radial shear zone I1 sideways into the plastic zone 111; however, in relatively loose soil this wedge forces its way through the medium without producing other visible slip surfaces. Thus, the extension of Vesic's equation to soft soils should be done with caution. Class 2 solutions, like class 1 solutions, are extremely de- pendent on the shape of assumed slip surfaces.
An alternative approach has been proposed by Baligh (1975), who analysed the problem of continuous penetration as a steady-state situation. Considering that the work done by the
I
LUNNE ET AL. (1976)
A BALIGH ET AL. (1978) v JAMIOLKOW SKI ET AL. (1982)
.
TAVENAS ET AL. (1982) 0 LACASSE & LUNNE (19821o KONRAD ET AL. (1985) o ROY ET A L (1982) A NASH & DUFFIN (1982)
FIG. 2. Cone factor NK VS. plasticity index of clays.
external force per unit area to push the cone a unit distance is equal to the sum of the work done to push the cone tip alone (wedge) at a constant velocity V over a unit distance and the work done to expand a cylindrical cavity as shown in Fig. Ib, Baligh arrives at the equation for a 60" cone shown in Table 1. This equation assumes that the deformable material surround- ing the wedge is isotropic, massless, rigid - perfectly plastic, and has a Tresca yield criterion, whereas the expansion of a cylindrical cavity assumes an elastoplastic medium, where the initial stress state is equal to the total horizontal stresses at a given depth.
~ a d a n y i (1963) proposed an approach using actual stress- strain curves obtained from laboratory triaxial tests idealized as a series of straight segments. He showed that the strain field around the expanded cavity was independent of the soil proper- ties. Levadoux and Baligh (1980) applied this condition to calculate stress paths around the cone. They obtained a strain field from steady-state flow of a nonviscous fluid around the penetrometer, from which strain paths were derived. Using a constitutive relationship for the soil and finite element analysis, stress paths can be calculated. The predicted values of cone resistance were corrected to account for cone roughness by
,
adding the vertical component of the residual shear stress acting on the face of the cone. Fair agreement between prediction and ,
observations was obtained in Boston blue clay. However, other analyses using finite elements and constitutive relations for soils (de Borst and Vermeer 1982; Sloan and Randolph 1982) showed that the predicted q , is very sensitive to the type of elements used and the boundary conditions considered in the analyses.
In order to account for strain-softening behaviour of soils such as sensitive clays, Ladanyi (1967) proposed that the mea- sured stress-strain relationship be idealized by a trilinear model. Based on this soil model, the expression proposed by Ladanyi (Table 1) relates cone resistance to the peak undrained shear strength, Young's modulus at small and large strain (E, and E,), as well as the residual or large-strain undrained shear strength (S,,). Roy et al. (1974) suggested that the approach by Ladanyi may be used as a first approximation in sensitive clay but also pointed out that the determination of the residual char- acteristics by laboratory tests presents some difficulties.
KONRAD AND LAW
P O R O U S ELEMENT
FIG. 3. Assumptions for proposed model: (a) Proposed stress field acting on cone; (b) expansion of spherical cavity Finally, owing to the above-mentioned shortcomings of
theoretical analysis of the cone, empirical correlations have been proposed in a form similar to that given by [2], namely,
where N K is the empirical cone factor obtained from [4] using the measured q, and a reference value of S , . Reference tests currently used are mainly field vane tests, with or without Bjenum's empirical correction, and laboratory triaxial com- pression tests. As reported by de Ruiter (1982), N K is mainly affected by the type of penetrometer, the plasticity index (I,), overconsolidation ratio (OCR), and the macrofabric of the clay. Typical values of N K are 10- 15 for normally consoli- dated and 15 - 20 for overconsolidated clays. Many in- vestigators have choosen to relate N K to I , as shown in Fig. 2. The data show significant scatter and suggest that further analysis should be made before utilizing the empirical relationships.
Proposed method to determine
S,
from piezocone testsAssumptions and derivation of S,
As discussed in the previous section, the predicted values of
S , differ substantially, depending on the assumed shape and location of the plastic zone. It is also essential that the com- putation of Su should be based on a realistic failure pattern. Thus, the development of any model requires a set of assump- tions, which, in turn, results only in an approximate solution. The theory of cavity expansion has been applied by Gibson (1950) to the problem of bearing capacity of deep foundations and can, therefore, be applied to cone penetration. However, several assumptions are necessary to take into account the change in direction of stresses and strains in the vicinity of the cone tip. As illustrated on Fig. 3a, it can be considered that the cone is acted upon by a uniformly distributed normal soil pres- sure (a,), normal to the cone, and by a shear stress along the cone (T), mobilized during penetration. The shear stress along the cone has been introduced by Gibson (1950), who assumed that full cohesion could be mobilized along the failure surface, taken as a hemisphere of pile radius. The unit shear stress is taken as the undrained shear strength of the soil ( S , ) . Ladanyi and Eden (1969) assume that the value of the shear stress is equal to the remoulded adhesion between the cone surface and the clay, i.e., typically about half the undrained shear strength.
u = 400 kPa
-
U 3 'n 1 . 0 2-
V) Suc: STRENGTH CORRESPONDING TO rvo 0 -0 . 5 -0 0. 75 1 . 0 0 COEFFICIENT OF EARTH PRESSURE AT REST KO FIG. 4. Influence of K,, on strength using proposed model. Recent studies on pile foundations have indicated that the mobilized shaft friction in clays could be interpreted in terms of effective stress parameters (Bozozuk 1972; Burland 1973). Furthermore, Konrad and Roy (1987) showed that this concept is also valid at various stages during the reconsolidation phase. Hence, it can be assumed that the unit shear stress at the cone-soil interface can be expressed aswhere
+'
is the effective friction angle of the normally consol- idated soil and M is the friction factor for the soil acting on the cone surface.Since the pore-water pressure is measured above the base of the cone, the pore pressure in the failure zone (u,) can be approximated by
where a is a factor usually greater than 1. In soft soils, avail- able data for measured pore pressures at both locations (Roy et al. 1982) indicate that a is in the range of 1 - 1.1. Consid- erations of force equilibrium at failure give the following ex- pression for a cone with apex angle 0 (Fig. 3a):
[7] q, = a,
+
M tan+'
( u , - a u ) cot 0Introducing F = M tan
+'
cot 0, which can be viewed as an overall soil-cone parameter, [7] results in396 C A N . GEOTECH J. VOL. 24, 1987 I --
I
-
-
-
I
Z a-I
r
R
/
P I A S T I C - ELASTIC\
INTERFACE---
V A R I A B L E DISTANCE DEPENDING O N S O I L TYPE ( a1
( b ) ( c1
F I G . 5 . Operational undrained shear strength mobilized by the cone in different soil types: ( a ) normally consolidated; (b) work softening; ( c )
work hardening. q,
+
F a u[81 U" = 1 + F
As suggested by the many researchers mentioned in the
previous section, a, can be assumed to be equal to the max-
imum internal pressure required to expand a spherical cavity from zero radius to the cone radius R as illustrated in Fig. 3b. The problem of the expansion of cavities in ideal soils has been widely studied and the solution is based on the following
assumptions for the
4
= 0 case:- rigid-plastic incompressible soil in a plastic zone,
- no volume change in the plastic region,
- linearly deformable soil in an elastic zone characterized by
constant values of Young's modulus (E) and Poisson's ratio
(v),
- homogeneous, isotropic material.
It is further assumed that prior to cavity expansion the entire soil mass has an isotropic initial total stress ( a i ) and that the soil is weightless. Considering a Tresca yield criterion, i . e . , inde- pendent of the hydrostatic pressure, the maximum internal pressure ( P , , ) is then given as
4
[9]
P,,
= - (In I,+
1) S,,+
u ,3
where Suc is the undrained shear strength mobilized by the cone, and I, is the soil's rigidity index (Hill 1950; Vesic 1972). Combining [8] and [9] yields the undrained shear strength mobilized during the penetration process:
q, - (1
+
F ) u i+
F a u[lo1 s.c =
4(1
+
F ) ( I ~ I ~+
1 )3
Evaluation of parameters
Several parameters are required for strength determination based on the proposed method summarized by [lo]. Only q,
and u can be determined from piezocone tests, while the other
parameters, i . e . , u i , M, a , tan
4
' , and I,, have to be evaluated independently.The porous element in the piezocone used in this in- vestigation is located above the conical tip, where water pres- sure can act over a part of the base area of the cone in a
direction opposite to the resisting forces developed during pushing. Hence, the measured total stress (q,) will be reduced. To obtain the actual total stress (q,), a correction taking into account the design of the cone must be applied. The actual cone resistance is obtained as follows (Campanella and Robertson
1981):
where a is a bearing net area ratio.
The initial total stress a , has been assumed to be spherical
and should therefore be approximated by the in situ total octa-
hedral stress (a,). This stress requires the determination of both vertical and horizontal total stress. While u,, may be readily
determined, oh, may present some difficulty. Taking a,, as u i
in [lo] instead of u, will introduce an error that is mainly dependent on the coefficient of earth pressure at rest (KO). It is
clear that for K, = 1.0, the use of a,, would be correct.
However, for K O less than 1 .O, as for many soft clays, the error is generally small and is on the safe side. This is best illustrated
by considering a typical soft clay for which q, = 600 kPa, u =
400 kPa, a,, = 160 kPa,
4 '
= 27", M = 1 .O, and IR = 120. As shown in Fig. 4, the ratio Su,/Suc varies only from 1.0 forK, = 1 to 1.06 for KO = 0.5, where S,, is the shear strength
calculated using [lo] considering a, and S,, corresponding to
the case u i = u,,. Therefore, if KO is not known, it is justified to use the total vertical stress as the initial isotropic total stress required in [lo].
In [7], M tan
4
' represents the coefficient of friction betweenthe soil and the cone face. According to measurements made by
Potyondy (1961) and Bozozuk et a l . (1979), M can be taken
between 0.5 and 0.75 for smooth steel surfaces. For usual roughness, M can be taken equal to unity. Within this range, the variation of S, according to [lo] is again small, higher values of M resulting in lower values of S,. Parametric studies have also shown that a variation of 2" in the effective friction angle has little influence on S,. Hence for general application,
4 '
= 35" is suggested as an average value of effective friction angle for silty soils and +' = 27" for clays.The rigidity index ( I R ) is one of the parameters that influence the undrained shear strength. Different methods used to obtain relevant values of I, are described later.
KONRAD AND LAW 100 200 b
-
SILTY SAND-.
h-
GREY CLAY + STONES - 0FIG. 6. Geotechnical profile at Gloucester.
Operational strength
Owing to the assumptions of the model, the relationship of [lo] yields the maximum undrained shear strength mobilized around the cone in an ideal elastoplastic soil, which is adequate for normally consolidated clays (Fig. 5a). However, if the actual soil behaviour is either work softening or work hard- ening, the proposed interpretation yields an operational shear strength. It can be viewed as an intermediate value between peak and residual strength for work-softening soils (Fig. 5b), and for work-hardening media the operational strength is inter- mediate between yield and maximum strength (Fig. 5c).
'
Vesic's and Baligh's interpretations also result in an oper- ational strength, since elastoplastic behaviour is considered in their models. As discussed earlier, Ladanyi's approach is the only one yielding the peak strength in work-softening soils (Ladanyi and Eden 1969).
The calculated peak strength, however, is a function of the assumed ratio of residual to peak strength (Su,/Su,), which in turn is stress path dependent (Law 1981b). It must be stressed that in Ladanyi's method this ratio is determined from labora- tory tests under stress paths different from that mobilized during cone insertion. Thus, the strength determined using Ladanyi's approach may not truly reflect the peak value.
I
Experimental studySite description
Three sites were chosen to study the use of the proposed method for strength determination: Gloucester, Ontario; the Ottawa Sewage Treatment Plant (STP) in Ottawa, Ontario; and Fredericton, New Brunswick. The Gloucester site (Fig. 6) is located 21 km southeast of Ottawa. It is a deposit of highly sensitive, soft Champlain Sea clay formed in different stages of erosion and deposition (Bozozuk and Leonards 1972). The clay is about 21 m thick, underlain by glacial till. It is slightly overconsolidated with a ratio (OCR) of 1.5. The plasticity
index ranges from 20 to 30% and the average clay content is about 80%. The Ottawa STP site (Fig. 7) is located at the eastern outskirts of Ottawa, on a firm to stiff Champlain Sea clay about 23 m thick. The top 3 m is a surface crust and the underlying clay has an average OCR of 3.3, average plasticity index of 20%, and clay content of 66%. The Fredericton site (Fig. 8) is located in downtown Fredericton. The site consists of fill of about 3 m underlain by a sand layer to a depth of 5.5 m and then 30 m of clayey silt, which has an average plasticity index of about 10%; The clay size content is about 50% and includes some fine particles of quartz. The OCR of the clayey silt is uncertain because of the difficulty of obtaining high undisturbed samples of the determination of repre- sentative in situ compressibility.
A GMF piezocone, a Cambridge self-boring pressuremeter, and a Geonor vane were used at each site. Test holes were located within 5 m of one another. At the Gloucester site, 127 mm diameter Osterberg samples were taken for laboratory tests. At the Fredericton site, a hollow-stem auger was used in the fill and provided a casing through which the tests were carried out.
Data acquisition system
A computer system was used in conjunction with the data acquisition system for the piezocone test and the pressuremeter test. Details of this system were described by Law (1985). Briefly, it comprises a personal computer, a data acquisition unit (DAU), and a plotter housed in a mobile laboratory (Fig. 9). For the cone penetrometer tests, readings are taken with the DAU and processed on site, taking into account the appropriate corrections to yield the tip resistance, sleeve fric- tion, pore-water pressure, and depth of penetration. The un- drained strength was calculated using [lo]. All results can be plotted on site following the completion of the penetration.
An additional feature of the computer system is its ability to automatically control pressuremeter tests. Five test types have
398 CAN. GEOTECH. I. VOL. 24, 1987
C O N T E N T , % S T R E S S , k P a
FIG. 7. Geotechnical profile at Ottawa Sewage Treatment Plant (after Eden 1971).
I
been programmed to date. Control of pressuremeter tests is achieved by means of an electric-to-pneumatic (E/P) trans- ducer, which receives an electrical signal from the computer and regulates a pressure output to the pressuremeter in propor- tion to that signal. The computer continuously takes readings, converts them to engineering quantities, and checks the current test conditions against the given ones. An appropriate signal to the E/P transducer is issued if required to modify the pressure to the pressuremeter so that the prescribed test conditions are followed. A constant strain rate test was chosen for the present study. At the South Gloucester and Ottawa STP sites, the strain rate was O.I6%/min, while at the Fredericton site a higher rate of O.S%/min was used because the soil is more permeable. Other details of the pressuremeter have been described by Eden and Law (1980).
Piezocone penetrometer (CPT)
Electric GMF 25 and 50 kN cone penetrometers fitted'with 60" tapered, 10 cm2 area cones were used to measure tip re- sistance (q,) and sleeve friction (f,). The pore-water pressures were measured through a 4 mm thick cylindrical porous stone located immediately above the conical tip. The rate of pene- tration for all tests of this study was 1 cm/s, which permits an averaging of 10 measurements for every 2 cm depth recorded. Tests conducted at a standard rate of penetration, i.e., 2 cm/s, did not indicate any change in either q , or u profile.
As pointed out by de Ruiter (1982), one major problem with cone design has been the difficulty in combining ruggedness with adequate sensitivity for penetration testing in soft fine- grained soils. Thus, if a tip with a capacity of 25 or 50 kN is used in a 2 kN range typical for most soft soils, considerable care in the testing procedure is required to obtain meaningful
data. The testing procedure adopted in the present investigation is described by Konrad (1986).
Pore pressures generated around the advancing cone pene- trometer are sensed with a pressure transducer installed within the penetrometer about 3 cm above the base of the cone. As pointed out by Zuidberg et al. (1982) the transducer should be as rigid as possible, it should have a minimum fluid-filled space, and the design should be optimized for deairing. Proper probe saturation is of paramount importance for reliable dy- namic pore pressure measurements. The filter elements should be deaired under vacuum and saturated with glycerin in the laboratory. Furthermore, each filter should be kept immersed in glycerin until used. The cavity inside the penetrometer is also filled with glycerin and a rubber membrane is pulled over the tip while the tip is totally immersed in glycerin. Loss of saturation during the installation phase or when traversing di- lative dense sand layers is avoided (Campanella et al. 1982) owing to the improved surface tension properties of the glycer- in. In contrast to the tip loads, which are only about 2-4% of the design capacity, the pore pressure developed in soft soils is generally recorded with transducers close to their design capac- ity, resulting in relatively accurate measurements.
Determination of rigidity index
Two methods have been used to determine the rigidity index in this study. The first method was applied to laboratory test data on Gloucester clay using the undrained triaxial test (CKoU)
with anisotropic consolidation stresses equal to those in the field as measured by Bozozuk (1 972). Stress- strain relation- ships were determined; these yielded an undrained shear strength and any secant modulus, from which the rigidity index was evaluated. The second method was used on data
SolL WATER CONTENT, % PROF1 LE KONRAD 3 I
I
!FIG. 8. Soil profile at Fredericton (after Alkins 1983).
TABLE 2. Results of triaxial tests on anisotropically consolidated
undrained Gloucester clay Secant modulus Undrained shear
Depth strength (MPa) Rigidity index
(m) (kpa) (I)* (2)t (2)
t
2.36 23.8 2.1 1 12.54 176 3.10 26.7 3.08 11.75 147 3.96 I 24.9 2.15 6.25 84 4.72 29.3 2.78 11.75 134 5.30 31 .O 2.39 14.97 1611
6.15 34.9 3.59 11.76 112 37.9 8.17 17.62 155 39.6 5.83 17.46 147 10.72I
46.4 6.96 18.61 134 12.19 50.9 7.06 17.56 115 13.41 51.6 7.82 21.93 142 * ( I ) At failure.t(2) At midpoint between failure and beginning of undrained shear
from selflboring pressuremeter tests conducted at each of the three sites.
The undrained shear strength and the secant modulus at two
shear stress levels from laboratory tests are shown in Table 2 .
The secant modulus is the slope of the line, on a stress-strain plot, joining the point at the beginning of undrained shear to the appropriate stress level. The modulus at the midpoint between
failure and the beginning of undrained shear ( E S 0 ) is about three
to six times higher than that at failure ( E , ) , indicating that the
stress-strain behaviour is nonlinear.
AND LAW 399
FIG. 9. Computer system mounted inside mobile laboratory (after Law 1985). (I) personal computer, (2) plotter, (3) signal conditioner, (4) strip chart recorder, (5) switching board, (6) data acquisition unit, (7) DC power supply.
Most theories for the cone penetration test interpretation, including the one proposed herein, assume linear behaviour, whereas nonlinearity prevails in real soils. Hence, the theories require a single modulus value that must be determined from measurements. As mentioned earlier, the secant modulus at
half the failure stress ( E S 0 ) and the initial tangent modulus ( E i )
have been used in the past. The use of Eso is considered more
reasonable because the modulus mobilized outside the plastic
zone ranges from El at the plastic-elastic interface to E i at
infinity or a considerable distance away. The average mobi- lized value lies between these limiting values and is probably
better approximated by ESO. The corresponding rigidity index
derived from Em is shown in Table 2 .
A graphical method was introduced to obtain a pressure- meter rigidity index, I R P , from the pressure-strain curve of the pressuremeter test. The index I R P will be equal to I R for some
given conditions to be discussed later. Based on Palmer (1972),
the shear stress ( 7 ) at the pressuremeter-soil interface is given
approximately by
where u, = total radial pressure, E = strain = A a / a , , Aa =
radial displacement at the interface, and a . = radius of pres-
suremeter before expansion.
In Fig. 10, a, is plotted against E. Point A corresponds to the
total in situ horizontal pressure and B is any point on the curve
beyond A . A tangent to the curve is drawn through B to inter-
400 CAN. CEOTECH. J . VOL. 24, 1987
l T l ' l ' l '
G L O U C E S T E R C L A Y
-
-
PRESSUREMETER ( crl - m i ; c r i -mi) -
-
o LABORATORY PLANE STRAIN -o UNDRAINED TRlAXlAL -
-
S T R A I N E 0 0 2 0 4 0 60 8 0 100F I G . 10. Graphical determination of rigidity index from pressure- meter test data.
DEPTH: 6 . 5 2 m 3 0 0 rn 'L x 2 0 0 L" u w + rn 1 0 0 0 0 2 4 6 8 10 S T R A I N . %
F I G . 11. Typical pressuremeter test result and variation of rigidity
index with strain level.
C is equal to E ( d a , / d ~ ) , or T . CD is drawn parallel to the
€-axis, with D directly below B, so that BD = T . If an
unloading-reloading cycle is carried out at B, the shear modu- lus (G) is equal to half of the gradient of the cycle (Wroth 1984). This cycle cuts CS at E, thus,
Therefore the pressuremeter rigidity index is equal to half of the reciprocal of DE. This graphical method was applied to all the pressuremeter results. The I R P values were found to depend on the strain level (Fig. 11). To ascertain the condition for which
I R P = I R , a controlled stress path plane strain test was con-
ducted on an undisturbed sample of Gloucester clay. A com-
puterized servo system described by Law (1981~) was used to
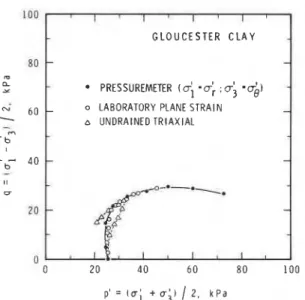
simulate in the laboratory the effective stress path in the pres- suremeter test. The result shown in Fig. 12 indicates that the laboratory test satisfactorily reproduces the field stress path.
The effective stress path from the pressuremeter test is sig- nificantly different from that of a conventional consolidated undrained triaxial test on a sample from the same depth. As shown in Fig. 12, the triaxial stress path bends towards the
p' = l u i + u;)
/
2 , k P aF I G . 12. Effective stress paths for various tests.
g
g
> - 3
0 1 2 3 4 5
A X I A L S T R A I N , %
FIG. 13. Shear stress - axial strain and volumetric strain - axial strain relations during the controlled stress path plane strain test.
origin after reaching a peak value, while the pressuremeter
I
stress path bends to the right, reaching higher p' values and hence higher shear resistance. The stress-strain-volume change during the plane strain test for simulating the pressure- meter test is shown in Fig. 13. At axial strains less than 1% (equivalent to 1.33% strain in pressuremeter tests), the un- drained condition is satisfied. Beyond this point, significant volume change takes place and this leads to straining at higher p' with the resulting shear resistance, corresponding to a par- tially drained strength. This strength is normally taken as the pressuremeter strength and is therefore higher than the un- drained strength. The I R P for this range will then be lower than
I R for the undrained condition. On the other hand, I R P deter-
mined at the strain level around the point when drainage starts will correspond to the undrained condition and may yield a closer value to I , . It is understood that since I R p corresponds to
KONRAD AND LAW 40 1
TABLE 3. Results of pressuremeter tests
Site Depth (m) Rigidity index
Gloucester 3.19 124 4.69 133 6.52 133 Ottawa Sewage 7.29 113 Treatment Plant 8.79 143 10.29 120 Fredericton 9.57 155 10.93 133 12.91 123 16.03 175 17.23 156 18.7 124
7 and 1 , to S,, I,, may still be different from I,. Values of l R P
from pressuremeter tests from the three sites were evaluated at different strain levels. The resulting values were used in [lo] to obtain the undrained shear strength (S,,). It was found that S,, corresponding to l R P at 10% pressuremeter strain is about 8- 10% higher than that from l R P at 1.5% pressuremeter strain. Furthermore, for the present study I,, determined at 1.5% is compared with 1 , from the high quality samples tested in the triaxial cell (Table 2). For soils at the same depth, the l R P , and
1 , from both test series are practically equal. Therefore I , is taken equal to IRP at 1.5% for all the sites and the results are shown in Table 3.
The use of the pressuremeter to obtain 1, may appear compli- cated in using the piezocone for measuring S,. The data from the present study however indicate a possibility that 1 , may lie within a narrow range for a given deposit. In future when more test data are available, some generalization and simplification may be possible so that the pressuremeter test will no longer be needed. This generalization may cause a strength variation of about 10% and is definitely superior to the empirical approach.
Results of piezocone tests
The profiles of q , and u for the three sites are plotted on the same scale in Fig. 14. There is a general increase in amplitude of variation in q , and u with respect to silt content. The Gloucester clay has the least amount of silt and the q , and u profiles are relatively smooth, while the widest variations are found in the Fredericton clayey silt. All these profiles provide a good means for identifying soil layers. Three layers can be observed at Gloucester, with demarcations at about 7 and 14 m. This is in good agreement with the extensive test results of Bozozuk and Leonards (1972). The profiles at the Ottawa Sewage Treatment Plant (STP) show a surface crust to a depth of 3 m. The next layer extends to 14 m, below which a third layer is found. This layering is consistent with what Eden (1971) found at the same site. The profiles at the Fredericton site give an excellent means of precisely locating silt or sand bands in the soil. Such bands are indicated by a sharp rise in q, and an abrupt drop in u because of the free-draining and dilative nature of dense sands. These bands are quite frequent at depths above 20 m. Below this point, a more homogenous layer is found, with q, roughly increasing linearly with depth.
Evaluation of operational strength from piezocone data
The evaluation of the operational undrained strength (S,,) was made using the above q , and u profiles, along with 1,
Frc. 14. Piezocone profiles: (a) Gloucester; (b) Ottawa Sewage Treatment Plant; (c) Fredericton.
determined from the pressuremeter tests. The results are com- pared with strengths determined using the methods of Vesic (1975) and Baligh (1975) in Figs. 15 - 17.
The profiles of undrained strength from the piezocone (S,,) are in general agreement with those from the vane test (S,,). At the Ottawa STP and Fredericton sites, S,, agrees well with S,,, while at the Gloucester site, S,, is consistently higher than S,, by about 10%. The peak strength from CKoU triaxial tests on Osterberg samples and on a block sample (Law 1975) is in good agreement with S,, at the Gloucester site.
At the STP site no CKoU tests were performed. Instead, comparison was made with unconsolidated undrained (UU) tests carried out by Eden (197 1) on block samples. The peak strength from these tests exceeds S,, at depths above 10 m and is about equal to S,, at lower elevations. Based on experience with other stiff Champlain Sea clays (Law 1975), the peak strength from CKoU test is higher than that from a UU test. The S,, at this site, therefore, would be lower than the peak CKoU strength.
Results of strength interpretations based on other theories are also shown in Figs. 15- 17. For Gloucester, using Ladanyi's model (1967) and parameters from Ladanyi and Eden (1969), with the cone resistance shown in Fig. 10, gives a peak strength 60% higher than the peak strength from the CKoU tests. Such high peak strength cannot be attributed solely to rate effect. Baligh's method (1975), on the other hand, yields the lowest strength of all the sites. At the STP site, for instance, this amounts to only about 35% of the vane strength. Vesic's method (1975) provides an undrained strength that is reason- ably close to that of the present proposed model. At the Gloucester site these two strengths are almost identical with Vesic's strength, slightly lower than that of the proposed inter- pretation. At the STP site, Vesic's method yields a slightly higher value in the crust, where u = 0, and a slightly lower value below the crust. At the Fredericton site, strength deter- mined from Vesic's method slightly exceeds that from the present model for the top 20 m and the strengths are equal
CAN GEOTECH J . VOL. 24, 1987 S,, k P a 0 2 D 4 0 6 0 8 0 1 0 0
I
I 1 I I I II
o FIELD VANEI
C KO U T R l A X l A L OSTERBERG SAMPLES 0 C K O U T R l A X l A L BLOCK SAMPLES V E S I C ' S MODEL 1.-
FIG. 15. Strength profiles at Gloucester site.
S,, k P a
I l l I I I l I I
A V E R A G E O F
0 - F I E L D V A N E
FIG. 17. Strength profiles at Fredericton site.
below 20 m depth, where the relatively homogeneous layer is
located.
0 2 0 4 0 6 0 8 0 1 0 0 1 2 0 1 4 0 1 6 0 1 8 0 2 0 0 Discussion
It was emphasized above that the present proposed model
yields an operational undrained strength (S,,) that reflects the
combined effects of the peak and the postpeak strength. It is to
be expected, therefore, that S,, would be lower than the peak
strength from a CK,U test for the stiff and brittle clay at the
Ottawa Sewage Treatment Plant. It is also not surprising that
S,, is close to the peak strength at Gloucester, because the clay
6
-
there is much softer and hence less brittle. Moreover, the strainrate during piezocone penetration is about two orders of mag-
s
-
B A L I G H ' S MOOEL 1 nitude faster than in the triaxial test. The higher rate will raiseE S,, from an intermediate value to one that is much closer to, or
may be even slightly higher than, the peak value.
It is noteworthy that for these three sites, Vesic's method and
n the present proposed model yield more or less the same results 1
despite the fact that different failure surfaces are assumed in the 1 2 -
models. As shown in Fig. la the assumed shape of slip lines in
Vesic's approach results in the addition of a constant equal to
14 - 2.57 to the cavity expression term in Vesic's (1975) bearing
capacity equation. The undrained shear strength derived from the cone resistance is therefore reduced by an amount depend-
1 6
-
ent upon the soil's rigidity. The proposed model considers that the cavity expansion pressure is equal to the total stress (a,)
1 8
-
3 normal to the cone face obtained from the cone resistanceassuming that the friction at the cone-soil interface is calcu-
I I I I I I I I I > lated using the effective stress concept. Obviously, a, is less
20 than q, depending upon the magnitude of induced pore pres-
sure. Hence the proposed method also reduces the undrained
KONRAD A N D LAW 403
G L O U C E S T E R
+
O T T A W A T R E A T M E N T F R E D E R I C T O NFIG. 18. Cone factor N , obtained in present investigation. pressures. Therefore, although for different reasons, it is ex- pected that the strength derived from Vesic's and the proposed equation can be approximately the same. It seems that this is the case in soils where the ratios of u l q , is between 0.65 and 0.73. The strength values produced by Baligh's method appear to be too low, as illustrated by comparison with the vane strength at the STP site, where Bjenum's (1972) correction factor for vane strength is 1 .O. In other words, the vane strength realistically reflects the available strength for first-time loading failure. The low strength from Baligh's model for these sites may be due to the fact that the assumed failure surface is not compatible with what actually happened.
The Geonor vane measures mostly the strength on a vertical surface upon which the effective horizontal stress (a;,) acts. For normally consolidated or lightly overconsolidated clays, a:, is smaller than the effective vertical stress. The measured vane strength will therefore be lower than the peak strength of a CKoU triaxial test on samples trimmed in the vertical (con- ventional) direction. This view is consistent with the com- parison of these two strengths for the Gloucester and the Ottawa STP sites. Consequently, the strength from piezocone (S,,) is higher than the vane strength at Gloucester. That S,, is equal to the vane strength at the STP and Fredericton sites is encouraging but may be coincidental and should be treated with caution. More study is required to establish a clear relationship between these two strengths.
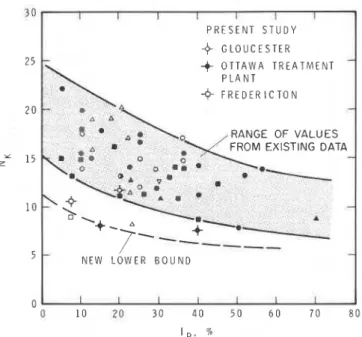
Figure 18 illustrates clearly the previous point. The empir- ical cone factor (N,) obtained from the present study is com- pared with the lower and upper bounds of published data sum- marized earlier. In siltier soils the lower bound of the empirical relationships NK vs. I , arrears to result in values of NK that are too high by about 50%. This, in turn, would give an appre- ciably lower shear strength, which could seriously affect the economics of a project.
Summary and conclusions
The main purpose of this paper is to develop an interpretation method for piezocone penetrometer test results in order to ob- tain the undrained shear strength in cohesive soils. To do so,
many assumptions were necessary, and thus any approach could result in only an approximate value of the soil strength. The assumption concerning the slip surfaces when the cone is pushed into a media is the most significant with respect to the theoretical bearing capacity factor, and thus with respect to the soil strength itself. The proposed method considers the soil-cone interface to be a slip surface in soft soils. The anal- ysis of piezocone results in terms of undrained strength is based on cavity expansion in an elastoplastic medium coupled with the determination of the vertical component of friction over the cone mantle, calculated using effective friction parameters and measured pore pressures generated during penetration. Several parameters that cannot be obtained from piezocone tests are also required for strength determination. The paper also dis- cusses their influence on the strength.
This study shows the following:
(1) It is possible to use simple assumptions with regard to the mechanics involved in the penetration process in soft soils for the evaluation of undrained shear strength based on piezocone data.
(2) Owing to the assumptions of the soil's constitutive re- lationship, the undrained shear strength mobilized around the cone corresponds to the maximum strength for an ideal elas- toplastic medium. For actual soil behaviour, either work soft- ening or work hardening, the proposed interpretation results in an operational shear strength that is intermediate between that mobilized at small and at large strains.
(3) Using representative parameters the proposed approach yields an operational strength dependent on induced pore pres- sures.
(4) The values obtained from existing models that do not ex- plicitly consider the pore pressures are within the range of undrained shear strength obtained using the proposed inter- pretation.
(5) The rigidity index can be obtained with a graphical method applied to the pressure-strain curve from the self-boring pres- suremeter test.
(6) The rigidity index from the pressuremeter is a function of strain level. At about I .5% strain for sensitive clays, this value corresponds to an undrained condition and is equal to that obtained from CK,U tests, based on a secant modulus at a stress level midway between the beginning of shear and failure. (7) The operational undrained strength (S,,) determined using the proposed model is equal to the CK,U triaxial strength for the Gloucester clay and lower than that for the Ottawa STP clay. This is consistent with the rate effect and brittleness associated with these two clays.
(8) S,, is higher than the vane strength at the Gloucester site but equal to the vane strength at the other two sites.
(9) At sites studied, Vesic's method yields more or less the same strength as the proposed model, whereas Baligh's method yields too low a strength for the three sites.
Acknowledgements
The authors gratefully acknowledge the conscientious efforts of A . Laberge, T. Hoogeveen, and H. Dahl, technical officers of the Institute for Research in Construction, in conducting the in situ tests. Thanks are due Professor A. Landva, University of New Brunswick, for arrangement of the fieldwork at the Fredericton site. This paper is a contribution of the Institute for Research in Construction, National Research Council of Canada.
404 CAN. GEOTECH. J. VOL. 24, 1987
ALKINS, J.C. 1983. The performance of a raft foundation supporting
a multi-story building. M .Sc. thesis, Department of Civil Engi- neering, University of New Brunswick, Fredericton, N. B .
BALIGH, M. M. 1975. Theory of deep site static cone penetration resistance. Department of Civil Engineering, Massachusetts Insti- tute of Technology, Cambridge, MA, Publication no. R75-56, Order no. 517.
BALICH, M. M., VIVATRAT, V., and LADD, C. C. 1978. Exploration
and evaluation of engineering properties for foundation design of offshore structures. Department of Civil Engineering, Massachu- setts Institute of Technology, Cambridge, MA, Research report R78-40, Order no. 607.
BISHOP, R. F., HILL, R., and MOTT, N. F. 1945. The theory of identification and hardness tests. Proceedings of the Physical
Society, London, 57; 147- 159.
BJERRUM, L. 1972. Embankment on soft ground. Specialty Confer-
ence on Performance of Earth and Earth-supported Structures, ASCE, Lafayette, Vol. 2, pp. 1 - 54.
B o z o z u ~ , M. 1972. The Gloucester test fill. Ph.D. thesis, Purdue University, Lafayette, IN.
B o z o z u ~ , M., and LEONARDS, G. A. 1972. The Gloucester test fill. Specialty Conference on Performance of Earth and Earth-supported Structures, ASCE, Lafayette, Vol. 1, Pt. 1, pp. 299-317 B o z o z u ~ , M., KEENAN, G. H., and PHEENEY, P. E. 1979. Analysis
of load tests on instrumented steel test piles in compressible silty soil. In Behaviour of deep foundations. Edited by Raymond Lundgren. American Society for Testing and Materials, Special Technical Publication 670, pp. 153- 180.
BURLAND, J. G. 1973. Shaft friction of piles in clay - A simple fundamental approach. Ground Engineering, 6: 30-42.
CAMPANELLA, R. G., GILLESPIE, D. G., and ROBERTSON, P. K. 1982.
Pore pressures during cone penetration testing. Proceedings, Second European Symposium on Penetration Testing (ESOPT 2), Amsterdam, pp. 507-512.
CAMPANELLA, R. G., and ROBERTSON, P. K. 1981. Applied cone
research. Symposium on Cone Penetration Testing and Experience. Geotechnical Division, ASCE, pp. 353-362.
CAQUOT, A., and KERISEL, J. 1956. Trait6 de mecanique des sols. Imprimerie Gauthier-Villars, Paris, France.
DE BEER, E. 1977. Static cone penetration testing in clay and loam. Sondeer Symposium, Utrecht.
DE BORST, R., and VERMEER, P. A. 1982. Finite element analysis of static penetration tests. Proceedings, Second European Sym- posium on Penetration Testing (ESOPT 2), Amsterdam, Vol. 2, pp. 457-462.
DE RUITER, J. 1982. The static cone penetration test - State-of-the-art report. Proceedings, Second European Symposium on Penetration Testing (ESOPT 2), Amsterdam, Vol. 2, pp. 389-405.
EDEN, W. J. 197 1. Sampler trials in overconsolidated sensitive clay. In Sampling of soil and rock. American Society for Testing and Materials, Special Technical Publication 483, pp. 132- 142. EDEN, W. J., and LAW, K. T. 1980. Comparison of undrained shear
strength results obtained by different test methods in soft clays. Canadian Geotechnical Journal, 17: 369-38 1.
GIBSON, R. E. 1950. Discussion of G. Wilson, The bearing capacity
of screw piles and screwcrete cylinders. Journal of the Institution of Civil Engineers, 34: 382.
HILL, R. 1950. The mathematical theory of plasticity. Oxford Uni- versity Press, London, England.
JAMIOLKOWSKI, M., LANCELLOTTA, R., TORDELLA, L., and BAT-
TAGLIO, M. 1982. Undrained strength from C R . Proceedings, Second European Symposium on Penetration Testing (ESOPT 2),
Amsterdam, Vol. 2, pp. 599-606.
KONRAD, J.-M. 1986. Piezo-friction-cone penetrometer testing in soft
clays. 39th Canadian Geotechnical Conference, Ottawa, Ont. KONRAD, J
.
-M.
, and Roy, M.
1987. Bearing capacity of friction pilesin marine clays. Geotechnique. In press.
KONRAD, I.-M., BOZOZUK, M., and LAW, K. T. 1985. Study of in situ
test methods in deltaic silt. Eleventh International Conference on
Soil Mechanics and Foundation Engineering, San Francisco, pp. 879-886.
LACASSE, S., and T. LUNNE. 1982. Penetration tests in two Nor- wegian clays. Proceedings, Second European Symposium on Pene- tration Testing (ESOPT 2), Amsterdam, pp. 661 -669.
LADANYI, B. 1963. Expansion of a cavity in a saturated clay medium.
ASCE Journal of the Soil Mechanics and Foundations Division, 89(SM4): 127 - 16 1.
1967. Deep punching of sensitive clays. Proceedings, Third Pan American Conference on Soil Mechanics and Foundation Engineering, Caracas, Vol. I , pp. 533-546.
LADANYI, B., and EDEN, W. J. 1969. Use of the deep penetration test
in sensitive clays. Proceedings, Seventh International Conference on Soil Mechanics and Foundation Engineering, Mexico, Vol. 1, pp. 225-230.
LAW, K. T. 1975. Analysis of embankments on sensitive clays. Ph.D. thesis, The University of Western Ontario, London, Ont.
1981a. A servo system for controlled stress path tests. In Laboratory shear strength of soil. Edited by R. N. Yong and F. C. Townsend. American Society for Testing and Materials, Special Technical Publication 740, pp. 164- 179.
1981b. Effect of stress path geometry on soil brittleness. GCotechnique, 31: 279-287.
1985. A portable computer system for in situ measurements in soils. International Conference on Education, Practice and Promotion of Computation Methods in Engineering Using Small Computers, Macao, Vol. 2A, pp. 241 -255.
LEVADOUX, J. N., and BALICH, M. M. 1980. Pore pressures during
cone penetration in clays. Department of Civil Engineering, Massa- chusetts Institute of Technology, Cambridge, MA, Research report R80-15, order no. 666.
LUNNE, T., EIDE, O., and DE RUITER, J. 1976. Correlations between cone resistance and vane shear strength in some Scandinavian soft to medium stiff clays. Canadian Geotechnical Journal, 13: 430-441.
MEYERHOF, G. G. 1951. The ultimate bearing capacity of founda-
tions. GCotechnique, 1: 301 -332.
NASH, D. F. T., and DUFFIN, M. J. 1982. Site investigation of glacial soils using cone penetration tests. Proceedings, Second European Symposium on Penetration Testing (ESOPT 2), Amsterdam, Vol. 2, pp. 733-738.
PALMER, A. C. 1972. Undrained plane-strain expansion of a cylin- drical cavity in clay: a simple interpretation of the pressuremeter test. GCotechnique, 22: 45 1 -457.
POTYONDY, J. G. 1961. Skin friction between cohesive granular soils
and construction material. GCotechnique, 11: 339-353.
PRANDTL, L. 1921. Uber die Eindringungs Festigkeit plasticher Bau-
stoffe und die Festigkeit ven Schneiden. Zeitschrift fur Angewandte Mathematik und Mechanik, l(1): 15 -20.
ROY, M., MICHAUD, D., TAVENAS, F. A., LEROUEIL, S., and
LA ROCHELLE, P. 1974. The interpretations of static cone pene- tration tests in sensitive clays. Proceedings, European Symposium on Penetration Testing ESOPT I), Stockholm, pp. 323-330.
ROY, M., TREMBLAY, M., TAVENAS, F., AND LA ROCHELLE, P. 1982.
Development of pore pressures in quasi-static penetration tests in sensitive clay. Canadian Geotechnical Journal, 19: 124- 138.
SKEMFTON, A. W. 1951. The bearing capacity of clays. Proceedings,
Building Research Congress, London, Div. I, pp. 180- 189.
SLOAN, S. W., and RANDOLPH, M. F. 1982. Numerical prediction of
collapse loads using finite element methods. International Journal for Numerical and Analytical Methods in Geomechanics, 6(1): 47-76.
TAVENAS, F., LEROUEIL, S., and ROY, M. 1982. The piezocone test
in clays: use and limitations. Proceedings, Second European Symposium on Penetration Testing (ESOPT 2), Amsterdam, pp. 889-894.
TERZACHI, K. 1943. Theoretical soil mechanics. John Wiley and Sons, New York, NY.
KONRAD AND LAW 405 Journal of the Soil Mechanics and Foundations Division, 98(SM3): technique, 34: 449-489.
265 - 290. ZUIDBERC, H. M., SCHAAP, L. H. J . , and BERINGEN, F. L. 1982. A 1975. Principles of pile design, Lecture series on deep founda- penetrometer for simultaneously measuring of cone resistance, tions. Sponsored by the Geotechnical Group, Boston Society of sleeve friction and dynamic pore pressure. Proceedings, Second Civil Engineers/American Society of Civil Engineers, Cambridge, European Symposium on Penetration Testing (ESOPT 2),
MA. Amsterdam, pp. 963-970.
T h i s p a p e r