Publisher’s version / Version de l'éditeur:
Il Cemento, 83, July-Sept. 3, pp. 129-52, 1986-07-01
READ THESE TERMS AND CONDITIONS CAREFULLY BEFORE USING THIS WEBSITE. https://nrc-publications.canada.ca/eng/copyright
Vous avez des questions? Nous pouvons vous aider. Pour communiquer directement avec un auteur, consultez la première page de la revue dans laquelle son article a été publié afin de trouver ses coordonnées. Si vous n’arrivez pas à les repérer, communiquez avec nous à PublicationsArchive-ArchivesPublications@nrc-cnrc.gc.ca.
Questions? Contact the NRC Publications Archive team at
PublicationsArchive-ArchivesPublications@nrc-cnrc.gc.ca. If you wish to email the authors directly, please see the first page of the publication for their contact information.
Archives des publications du CNRC
This publication could be one of several versions: author’s original, accepted manuscript or the publisher’s version. / La version de cette publication peut être l’une des suivantes : la version prépublication de l’auteur, la version acceptée du manuscrit ou la version de l’éditeur.
Access and use of this website and the material on it are subject to the Terms and Conditions set forth at
Influence of CaCO3 on hydration and microstructural characteristics of
tricalcium silicate
Ramachandran, V. S.; Zhang, C. M.
https://publications-cnrc.canada.ca/fra/droits
L’accès à ce site Web et l’utilisation de son contenu sont assujettis aux conditions présentées dans le site LISEZ CES CONDITIONS ATTENTIVEMENT AVANT D’UTILISER CE SITE WEB.
NRC Publications Record / Notice d'Archives des publications de CNRC:
https://nrc-publications.canada.ca/eng/view/object/?id=95036705-062d-4385-8495-0cc9cc77215b https://publications-cnrc.canada.ca/fra/voir/objet/?id=95036705-062d-4385-8495-0cc9cc77215bN 2 1 d
National Research
Conseil national
no.
1 4 5 5*I
council ~ a n a d a
de recherches Canada
c .
2BLDG
Institute for
lnstitut de
-- -
Research in
recherche en
Construction
construction
Influence of CaC03 on Hydration and
Microstructural Characteristics of
Tricalcium Silicate
by V.S. Ramachandran and Zhang Chun-mei
Reprinted from
II Cemento
Vol. 83, July -
Sept. 1986
p. 129 - 152
(IRC Paper No. 1455)
Price $3.50
NRCC 27643
NRC-
ClSTlI R C
L I B R A R Y
B I B L I O T H ~ Q U E
I R C
Following hydration of tricalcium silicate in the presence of
0, 5, 10, 15 and 50% CaC03, the rate of hydration,
microstructure, composition, shrinkage and strength development
were monitored.
Suite
2
l'hydratation de silicate tricalcique en prhence de
0,
5, 10, 15 et 50
%de CaC03, on a observg la vitesse
d'hydratation de ce produit, sa microstructure, sa composition,
le retrait de la pSte et le d6veloppement des rgsistances.
CROSTRUTTURALI DEL SILICATO TRlCALClCO
INFLUENCE OF CaCO, ON HYDRATION AND MICROSTRUCTURAL CHARACTE-
RISTICS OF TRICA LCIUM SILICATE
V.S. Ramachandran
,
Zhang Chun-meiVari sottoprodotti e materiali di scarto come la cenere volante, la loppa, il silica fume e la pula di riso sono stati impiegati nel calcestruzzo come aggiunte con esi- to favorevole. La polvere di calcare, che si produce nelle qerazioni di esltrazione, da luogo a problemi di eliminazione e ambientali ed i: anche stata proposta come aggiunta a1 cemento Portland. I vantaggi dell'im- piego di carbonato di calcio nella tecnologia del cal- cestruzzo comprendono l'eliminazione degli scarti, la possibilita di sostituirlo a1 gesso, il risparmio di ener- gia e la sostituzione parziale degli inerti fini. Alcune n0rm.e permettono l'uso del carbonato di calcio nel cemento a condizione che non ne vengano compro- messe le proprieta del calcestruzzo fatto con un ce- mento di questo genere. Le norme canadesi permet- tono un contenuto fino a1 5% di CaC03 nel cemento Portland normale, a condizione che la qualita del cal- care ne permetta l'impimego nella fabbricazione di clin- ker di cemento Portland
111.
Gli studi condotti sugli cffetti del carbonato di calcio sul cemento di idratazione dimostrano che le caratte- ristiche fisiche e meccaniche sono inflnenzate in varia misura. Le differenze. in particolar mod0 negli stadi di maturazione iniziali, vengono attribuite all'intera- zione tra il carbonato di calcio e l'alluminato trical-
(*) Capo Sezione Materiali CNR - Canada.
(**) Professore delllIstituto di Tecnologja di Nanchino
-
Rep. Popolare Cinese.MICROSTRUTTURALI DEL SILICATO
TRlCALClCO
INFLUENCE OF CaCO, O N HYDRATION
AND MICROSTRUCTURA L CHARACTE-
RISTICS OF TRICA LCIUM SILICATE
V.S. Ramachandran (*), Zhang Chun-mei (**)
INTRODUCTION
Various by-products and waste materials such as fly- ash, slag, silica fume, and rice husk have been used i n concrete as additives w i t h some success. Limestone dust, which is produced i n quarrying operations, poses disposal and environmental problems and has also been suggested as a n additive t o portland cement. T h e advantages of using calcium carbonate in concrete technology include disposal of waste, t h e possibility of its substituting gypsum, energy savings, and partial substitution of fine aggregates. S o m e standards allow the use of calcium carbonate i n cement provided the properties of the concrete made w i t h such a cement are not adversely affected. Canadian standards perinit inclusion of u p t o 5% CaC03 i n normal portland cement provided the quality of the limestone permits its use i n the manufacttrre of portland cement clinker [ I ] . Studies of the effect of calcium carbonate o n hydrat- ing cement show that the physical and mechanical characteristics are influenced t o varying degrees. T h e differences, especially at early ages, are attributed t o the interaction of calcium carbonate and t h e trical- c i u m aluminate phase
[2-91.
I t is implied that the(*) Head, Materials Section, National Research Council, Canada.
(**) Visiting Scientist, Nanjing Institute of Technology, People's Republic o f China.
cico 12-91. Si sottintende che la cinetica di idratazione della fase di C3S rimanga invariata. Sebbene i risultati ottenuti da Soroka e collaboratori 110, 111 siano di- spersi, lasciano intuire che la maggior resistenza dei cementi Portland contenenti CaCO3 possa essere legata all'aumento globale di tasso di idratazione del cemento. I materiali finemente divisi, come il silica fume noto- riamente accelerano l'idratazione del cemento e del C3S [12, 131. Si e ritenuto possibile che anche il CaCO3 finemente diviso potesse accelerare l'idratazione del cemento e del C3S, per0 sinora non k stato svolto nes- sun lavoro per dimostrare l'effetto del CaCO3 sulle proprieta fisiche, chimiche e meccaniche degli impasti di C3S. Uno studio ldi questo genere potrebbe spiegare la variabilita dei risultati ottenuti per gli impasti di cemento usando cementi di diversa composizione idra- tati con CaC03. I1 presente studio, pertanto, si e pro- posto di dimostrare l'effetto di varie quantita di CaCOs sulla velocita di idratazione del C3S e sulla composi- zione, microstruttura 'e proprieta meccaniche degli im- pasti di C3S formati a diversi periodi di stagionatura.
PARTE SPERIMENTALE Materiali
I1 silicato tricalcico (triclino) fornito dalla Portland Cement Association, USA, aveva area di superficie Blaine di 3600 cm2/g.
I1 carbonato di calcio fornito dalla Anachemia Chemi- cal Co. aveva una superficie specifica N1 di 6,s m2/g; l'analisi granulometrica i: illustrata nella fig. 1 (dia- metro medio delle particelle 3 pm). La fig. 2, una mi- crografia SEM, indica che il carbonato di calcio sem- bra avere un aspetto tipo gel.
Preparazione del campione
Serie I
I1 silicato tricalcico i: stato mescolato con quantita diverse di CaCO3 (096, 5% e 15% rispetto a1 peso totale del C3S
+
CaCO3) e trasferito in una fiala in polieti-s
Diametro sferico equivalente,pm-
Equivalent spherical diarneter,prn 1-
Granulometria del carbonato di calcio1
-
Particle size distribution o f calcium carbonate 2-
Micrografia del carbonato di calcio2 - Micrograph of calcium carbonate
hydration kinetics of the C3S phase remain unaffected. Although the results obtained by Soroka and his co- workers
[lo,
111
are scattered, they indicate that higher strengths of portland cements containing CaCOj m a y be related t o overall increase i n rate of cement hydration.Finely divided materials such as silica fume are k n o w n t o accelerate the hydration of cement and C3S 112,
131. I t was thought possible that finely divided CaC03
might also accelerate hydration of cement and C3S. N o work, however, has so far been carried out t o demonstrate t h e effect of CaCOj o n the physical, che- mical and mechanical properties of CjS pastes. St:ch a study might explain t h e variability of results ob- tained for cement pastes using cements of different composition hydrated w i i h CaCO3. I t was the objec- tive of the present study, therefore, t o show the effect of different amounts of CaC03 o n the rate of hydration of C3S and o n the composition, microstructure and mechanical properties of t h e C3S pastes formed a1 different curing periods.
EXPERIMENTAL Materials
Tricalcium silicate (triclinic) supplied b y the Portland Cement Association, U.S.A., h'ad a Blaine surface area of 3600 cm2/g.
Calcium carbonate supplied by the Anachemia Chemi- cal Co. had N2 surface area of 6,5 m 2 / g ; particle size analysis i s shown i n fig. 1 (mean particle diameter
3 pm). Figure 2, a n SEM micrograph, shows that cal- c i u m carbonate appears t o have a gel-like appearance.
Sample preparation
Series I
Tricalcium silicate was mixed w i t h different amounts of CaC03 (0, 5 and 15% w i t h respect t o the total weight of C3S
+
CaC03) and transferred t o a 10 m l polyethy-lene da 10 ml. La mislcela i: stata addizionata con sfere in vetro del diametro d i 5 mm ed i: stata fatta vibrare su un milsceilatore Splex ad alta velocita per 2 min. E' stata aggiunta acqua distillata priva di anidride car- bonica con un rapporto acqua/solido pari a 0,4, e la miscela i: stata chiusa con tappo e fatta vibrare per
20 s. Le fiale in polietilene sono state collocate in un tub0 di plexiglas, posto su rulli, e fatte ruotare per la durata di un giorno. Dopo di cib i campioni sigillati sono stati lasciati ad ~ d r a t a r e per gli intervalli di tempo specificati. Essi sono stati rimossi per l'esame dopo l'essiccamento mediante pompaggio continuo sot- to vuoto per un giorno. Per tutta la durata della prova i: stata posta la massima cura per evitare la contami- nazione con C02. Sono stati preparati campioni indi- viduali per 1, 3, 7 e 28 giorni.
lene vial. Glass spheres 5
mm
in
diameter were added to the mixture, which was vibrated o n a Spex high- speed mixer for 2 min. Carbon dioxide-free distilled water was added at a waterlsolid ratio of 0,4, and the mixture was capped and vibrated for 20 s. T h e polyethy- lene vials were placed i n a plexiglas tube, put o n rol- lers, and rotated for u p t o one day. After this the sealed samples were left t o hydrate for specified in- tervals. T h e y were removed for examination after drying b y continuous vacuum pumping for one day. Care was taken throughout t o prevent contamination w i t h C02. Individual samples were prepared for 1, 3, 7 and 28 days.Serie 11 Series I1
Una s~ecaada serie di impeshi di C3S i: stata preparata A second series of C3S pastes was similarly prepared
analogamente usando lo 0 % , 15%, 2596, 50% e 75% di using 0, 15, 25, 50 and 75% CaC03 at a waterlsolid ratio
CaCO3 con rapporto acqua/solido pari a 0,7. Questi of 0,7. These samples were hydrated for 7 and 28 days.
campioni sono stati i'dratati per 7 e 28 giorni.
Metodi Methods
Analisi termica
L'analisi termica (DTA e TGA) e stata effettuata usan- do un analizzatore termico 1090 Du Pont contenente un accessorio 951 TGA. In ogni esperimento un campione da 30 mg i: stato riscaldato a 20°C/min in flusso con- tinuo ldi gas d'azoto. L'attrezzatura TGA ha dato sia curve termogravimetriche che curve termogravimetri- che differenziali. La cella DTA poteva essere usata fino a 1200°C.
Calorimetria a conduzione
La velocita e la quantita di calore sviluppato dal C3.S con e senza CaC03 con rapporto acqua/solido pari a
0,4 e 0,7, 25"C, sono state misurate per mezzo di un calorimetro a conduzione fornito dall'Istituto di Fisica Applicata, Delft, Olanda [ 1 4 ] . Per l'acquisizione e l'ela- borazione dei dati, il calorimetro i: stato interfacciato a un Apple I1 usando un convertitore analogico-digitale Taurus One da 12 bit e una soheda di interfacciamento Apple super di serie.
Analisi chimica
La stima del CaC03 in campioni di C3S idratato con o senza carbonato di calcio 6 stata eseguita come segue: l'anidride carbonica formata dall'azione dell'acido sol- forico sul campione & sta-ta assorbita da una soluzione
a standard di Ba(OH)2 (in sistema chiuso). I1 Ba(0H)z
in eocesso i: stato titolato con HC1 usando fenolftaleina come indicatore. La quantita di CaCO3 i: stata calco- lata sulaa scorta della quantita stimata di C02.
Thermal analysis
Thermal analysis (DTA and TGA) was carried out using a 1090 Du Pont thermal analyser containing a 951 TGA accessory. I n each experiment a 30 m g sample was heated at 2O0C/min i n a continuous flow of nitro- gen gas. T h e T G A equipment gave b o t h thermogravi- metric and differential thermogravimetric curves. The DTA cell could be used u p t o 1200°C.
Conduction calorimetry
T h e rate and amount of heat developed b y C S , w i t h and without CaC03, at w / s of 0,4 and 0,7, 25OC, were measured using a conduction calorimeter supplied by the Institute of Applied Physics, Delft, Holland [ 1 4 ] . For data acquisition and processing t h e calorimeter was interfaced w i t h a n Apple 11 using a Taurus One 12 bit analogue-to-digital converter and a n Apple super serial interface card.
Chemical analysis
Estimation of CaC03 i n samples of C3S hydrated w i t h or without calcium carbonate was carried out as fol- lows: carbon dioxide formed b y the action of sulphu- ric acid o n t h e sample was adsorbed b y a standard Ba(0H)z solution ( i n a closed system). T h e excess Ba(OH)2 was titrated against HCl using phenolphtha- lein as a n indicator. T h e amount of CaC03 was com- puted from the estimated amount of CO2.
Porosita Porosity
E' stato usato il Porosimetro Aminco-Winslow per de- T h e Aminco-Winslow Porosimeter was used t o deter-
terminare la distribuzione delle dimensioni ,dei pori e mine pore size distribution and porosity of the hydra-
la porosita degli impasti i'dratati. Questo strumento ted pastes. This instrument measures pore size diame-
Distribuzione delle dimensioni delle particelle
La distribuvione delle dimensioni delle particelle (nel carnpo 100
-
0,l ym) e stata detlerminata mediante l'ana- lizzatorc delle dimensioni delle particelle Microne Ritics Sedigraph 500E. Come disperdente per la misurazione delle dimensioni delle particelle del CaCO3 i: stata usa- ta la soluzione Sedisperse A-12 (densita 0,810 g/ml e viscosita 4,542x
Pa.
s a 24°C).Superficie specifica
La superficie specifica k stata ottenuta usando Np come adsorbato, usando un sistema di adsorbimento Quanta- sorb Modello QS-7.
Microscopio elettronico a scansione ( S E M )
L'esame microstrutturale 2 stato condotto su frammenli spezzati dei campioni usando un Cambridge Stereoscan Mark 2A. Ai campioni B stato dato un rivestimento conduttivo di carbonio e oro.
Ritiro
I campioni usati per le misure del modulo di elasti- cita sono stati tagliati in prismi rettangolari da 30
x
x
10 X 1,27 mm e collocati in un essiccatore a1 48% U.R. sopra una soluzione satura di KN02. E' stata con- trollata la variazione della lunghezza in funzione bdel tempo fino a 40 giorni.Microdurezza
E' stato impiegato un dispositivo per la determinazione della durezza Leitz Miniload. I1 metodo di determina- zione si basava sull'impiego del penetratore piramidale di Vicker in una scatola condizionata priva di C02. La durezza 6 stata calcolata mediante la formula
Hv (kg mm-l) = 1854,4
x
p d2dove p = carico (g) e d = valore medio delle diagonali di penetrazione.
Impasti contenenti lo 0%, 5% e 15% di CaC03 sono stati versati in forme in plexiglas 0 32 min, spessore 5 mm con rapporto acqua/solido pari a 0,4. I campioni sono stati stagionati per 1, 3, 7 e 28 giorni ed essilcmti sotto vuoto per un giorno prima di eseguire le misu- razioni in scatola munita di guanti in atmosfera di azoto. Si 6 provveiduto alla lucidatura de'lla superficie dei campioni prima della determinazione. Sono state riportate in media dieci penetrazioni per ogni cam- pione.
Modulo di elasticita
A impasti di C3S
+
CaCO3 5 stata aggiunta la quantita di acqua occorrente per avere un rapporto acqua/soli- do pari a 0,4; quindi gli impasti sono stati co~locati in cilindri di Plexiglas (diametro 32 rnm), vibrati, tappati e fatti ruotare su rulli orizzontali. Dopo un giorno icampioni, ora di forma cilindrica, sono stati estratti e esposti a1 100% U.R. per altri due giorni. I1 terzo giorno i campioni sono stati tagliati in dischi dallo spessore
Parti,cle size distribution
Particle size distribution (100
-
0,1 ym range) was de-termined b y Microne Ritics Sedigraph 500 E particle-size analyser. Sedisperse A-12 solution (density 0,810 g l m l
and viscosity 4,542
x
P a . s at 24OC) was used asa dispersant for t h e particle size measurement o j CaC03.
Specific surface area
Surface area was obtained w i t h
NZ
as the adsorbate,using a Quantasorb Model QS-7 sorption system.
Scanning electron microscope (SEM)
Microstructural examination was conducted o n fractu- red pieces of the specimens, using a Cambridge Ste- reoscan Mark 2A. T h e specimens were given a conduc- tive coating of carbon and gold.
Shrinkage
T h e samples used for modulus of elasticity measure-
m e n t s were cut into rectangular prisms 30
x
10x
1,27m m and placed in a desiccator at 48% RH over a satu-
rated KNOr solution. Length change was monitored as a function of time u p t o 40 days.
Microhardness
A Leitz Miniload Hardness Tester was used; the test method employed the Vicker's pyramid indenter i n a conditioned box free of COz. Hardness was calculated from the formula
1854,4
x
pH,
( k g mm-') =d2
where p = load (g) and d = m e a n value of the inden-
tation diagonals.
Mixes containing 0, 5 and 15% CaC03 were cast using
32 mm diam, 5 mm thick Plexiglas moulds at a water/
solid ratio of 0,4. Samples were cured for 1, 3, 7 and 28 days, and dried i n vacuum for one day before measu-
rements were carried out
in a gloved box i n a nitrogen
atmosphere. T h e surface of the samples was polished prior t o measurement. An average of t e n indentations for each sample is reported.
Modulus of elasticity
T o C3S
+
CaCOs mixtures the required amount of waterfor w / s = 0,4 was added, then the pastes were placed
i n Plexiglas cylinders (32 mm diam), vibrated, stop-
pered, and rotated o n horizontal rollers. After one day the samples, n o w i n the form of cylinders, were remo- ved and exposed t o 100% RH for t w o more days. At
three days t h e samples were c u t into discs 1,27 mm
di 1,27 mm. Questi a lor0 volta sono stati espasti a1 100% U.R. per 4, 11 e 25 giorni rispettivamente, corri- spondenti a 7, 14 e 28 giorni di stagionatura.
L'inflessione .i: stata determinata su un comparatore descritto in precedenza [15]. La procedura comporta la determinazionc del!'inflessione di un disco campio- ne caricato a1 centro e sostenuto in tre punti sulla cir- conferenza di un cerchio dal diametro di 2,54 cm. Cia- scun valore era rappresentato dalla media di cinque determinazioni eseguite su cinque dischi.
RlSULTATl E DlSCUSSlONE Velocita di idratazione
La velocita di idratazione del C3S pub essere accertata valutando la quantita di Ca(OH)2 o acqua non evapo- rabile che si forma a vari tempi di idratazione oppure sulla scorta della velocita di scomparsa del C3S. I1 Ca(OH)2 formato durante l'idratazione pub essere valutato mediante estrazione chimica, metodi termoana- litici oppure QXRD. I1 metodo fondato sull'estrazione
Obrni Days
I
I I I I 1 I I I0 200 400 600 800 I
Ternperatura, O C
-
Temperature,3
-
Curve termogravimetriche differenziali del C3S idratato per diversi periodi in presenza di carbonato di calcio3 - Differential thermogravimetric curves of C3S hydrated f o r
different periods i n t h e presence o f calcium carbonate
11 and 25 days, the equivalent of 7, 14 and 28 days of curing, respectively.
Deflection was measured o n a dial gauge described
previously 1151. T h e procedure involves measuring the
deflection of a disc specimen loaded at its centre and supported at three points o n the circumference of
a
circle 2,54 c m i n diameter. Each value was the average of five determinations carried out o n five discs.RESULTS AND DlSCUSSslON Rate of hydration
Rate of hydration of C3S m a y be followed by estimat- ing t h e amount of Ca(OH)2 or non-evaporable water formed at different times of hydration, or b y follow- ing the rate of disappearance of C3S.
Ca(OH)2 formed during hydration m a y be estimated by chemical extraction, thermoanalytical, or Q X R D me- thods. T h e chemical extraction method yields higher
a) Riferito alla pasta
-
Based on pasteI 1 1 I I 1 I I I
I
5 10 15 SO 25 30
Tempo, giorni
-
Timq days 4-
Formazione di Ca(OH)2 in impasti di C3S contenenti &verse quantita di CaC034
-
Formation o f Ca(OH)2 i n CIS pastes containing d i f f e r e n tchimica da per risultato valori piu elevati. Per il pre- values. For the present work the thermogravimetric
sente lavoro e stato adottato il metodo termogravime- method was used.
trico.
Sono state ricavate curve termogravimetriclhe differen- ziali per impasti idratati per 1, 3, 7 e 28 giorni in pre- senza dello 0%, 5% e 15% di CaCO3 con rapport0 acqua/solido pari a 0,4 (fig. 3). I risultati di quelli idratati con lo 0% e 15% di CaC03 rivelano tre picchi a 100-120sC, 460-475°C e 730-740°C. La prima inflessione i: alquanto ampia, in quanto rappresenta la perdita d'acqua dalla fase C-S-H; la seconda i: causata dalla disidratazione 'del Ca(OH)? e la terza 5 provocata dalla decomposizione del CaCO3.
I campioni idratati con lo 0% di CaCO3 non presen- tan0 picchi a circa 730°C, indicando che non si verifica alcuna carbonatazione nel corso dell'idratazione. Una piccolilssima sporgenza a ailrca 615°C pub essiere dovuta a una minuscola quantita di CaCO3 finemente cristal- lizzato. L'intensita di questo picco dopo un giorno di idratazione e pressochir identica a quella dopo 28 gior- ni, il che lascia supporre che durante l'idratazione non venga promossa la carbonatazione atmolsferica del- l'impasto.
Sulla base dell'area del pimcco si k calcolata la quantita
5 1
'
1 I I I I I I I I I0 5 10 15 20 25 30
Tempo, giorni
-
Time, daysDifferential thermogravimetric curves were obtained for pastes hydrated for 1, 3, 7 and 28 days i n the pre- sence of 0, 5 and 15% CaC03 at a w l s = 0,4 (fig. 3). T h e results for those hydrated w i t h 0% and 15% CaC03
show three peaks at 100-120°C, 460-475°C and 730-740°C.
T h e first inflection is rather broad, representing loss of water from t h e C-S-H phase; t h e second is due t o dehydration of Ca(OH)2; and the third is due t o decom- position of CaC03.
Samples hydrated w i t h 0% CaCO3 d o not display peaks at about 730°C, indicating that practically n o carbona- tion occurs during hydration. A very small h u m p a2 about 615°C m a y be caused b y a minute amount ol finely crystallized CaCO3. T h e intensity of this peak at one day of hydration is almost equal t o that after
28 days, suggesting that atmospheric carbonation o j paste is not promoted during hydration.
T h e area of the peak was used t o estimate the amount
I t I 1 I T I 914,2'C I I I
880 890 900 9 10 920 930 940
Temperatura, O C
-
Temperatura, OC 6-
Transizione endotermica di C3S6 - Endothermal transition o f C3S
,
5-
Contenuto d'acqua non evaporabile di impasti di C3S conte- nenti varie quantita di CaC035
-
Non-evapo~labIe water content of C3S pastes containing dif- ferent amounts o f CaC03di Ca(OH)2 che si forma a tempi differenti (fig. 3); & ovvio che l'ampiezza del picco a 460°C-475°C aumenti con l'aumentare del periodo di idratazione. In termini quantitativi, la quantita di cake che si forma con lo 0% di CaC03 aumenta da1118,4% dopo un giorno a1 19,4% dopo 28 giorni (fig. 4a). L'addizione del CaC03 aumenta la quantita di Ca(0H)z nei primi stadi del- I'idratazione, lasciando supporre c~he il CaCO3 possa accrescere la velocita di idratazione del C3S. Per una valutazione realistica dell'effetto del CaCO3 sull'idrata- zione del C3S, la velocith di idratazione andrebbe valu- tata sulla base del C3S. I valori ricalcolati sulla base del C3S sono riportati nella fig. 4b. Dopo 28 giorni, l'aggiunta dello 0%, 5% e 15% di CaCO3 produce il 23,2%, 24,0% e 25,5% di Ca(OH)2 rispettivamente. Una rassegna della letteratura [16-231 lascia supporre che la quantita idi Ca(OH)2 che si forma a 28 giorni vada a collocarsi tra il 20,0% e il 40%. Questa ampia varia- zione & il risultato delle diverse tecni~he adottate (TGA, DSC, XRD, analisi chimica, ecc.), della variazione delle proprieta fisiche e chimiche del CIS (purezza, reatti- vita, area di superficie, ecc.), e del metodo di prepa- razione (rapport0 acqua/solido, temperatura, stagiona- tura, em.). La figura 4b illustra chiaramente come a tutti i tempi di idratazione fino a 28 giorni il CaCO3 promuova la formazione di Ca(OH)2. L'effetto accele- rante sull'idratazione del C3S dipenide dalla quantith di CaCO, addizionata, poichC il 15% di CaCO3 fornisce un effetto accelerante superiore che non il 5% di CaCO3.
Per valutare il grado di idratazione dei cementi e dei componenti del cement0 sulla scorta del contenuto percentuale dell'acqua non evaporabile, occorre deter- minare la quantita di acqua chimicamente trattenuta nelle fasi CH e C-S-H. La perdita di peso dovuta alla perdita di COz dal CaC03 costituisce pure un fattore di cui tenere conto. L'impasto deve essere essiccato in maniera tale che sia eliminata soltanto l'acqua trat- tenuta fisicamente, e cio k tutt'altro che facile da otte- nere. I1 campione essiccato deve essere riscaldato in mod0 che venga espulsa tutta l'acqua di combina- zione. Nel presente lavoro la peudita di peso si basa su quella di un campione essiccato per un giorno sotto vuoto oppure ri~cal~dato a 100°C nell'apparecchio TGA. La perdita di peso totale & stata accertata dopo riscal- damento a 1000°C. I risultati riportati nella fig. 5 si basano sul peso del C3S.
In linea generale, si ottengono valori superiori nei campioni essiocati second0 il metodo sotto vuoto, pro- babilmente in quanto non tutta l'acqua trattenuta fisi- camente viene eliminata. I valori del tenore d'acqua non evaporabile (basati sul C3S) salgono con l'aumen- tare del periodo di idratazione. A un parti~colare stadio di idratazione i valori scendono come segue: C3S
-
15% CaCO3>
C3S-
5% CaC03>
C3S-
0% ca&03. Nel caso dei campioni privi di Ca&O3, il valore dopo un giorno e pari a1 6,3% e aumenta fino a1 18,8% a 28 giorni; nel caso dei campioni contenenti il 15% di CaCO3, l'aumento va dal 12,7% a1 24%. Nel presente lavoro i tenori di acqua non evaporabile per paste diof Ca(0H)Z formed a t different times (fig. 3); i t is evi- dent that the amplitude of the peak at 460-475°C in- creases as the hydration period increases. I n quantita- tive terms the amount of lime formed at 0% CaC03 increases from 8,4% at one day t o 19,4% at 28 days (fig. 4a). Addition of CaC03 increases the amount of Ca(0H)z at the early stage of hydration, indicating that CaC03 m a y increase the rate of hydration of C3S. For a realistic assessment of t h e effect of CaC03 o n the hydration of C3S, rate of hydration should be assessed o n t h e basis of C3S. Re-calculated values, o n t h e basis of C3S, are plotted i n fig. 4b. At 28 days, addition of 0, 5 and 15% CaC03 yields 23,2, 24,O and 25,5% Ca(OH)2, respectively. A literature survey 116-231 indicates that the amount of Ca(OH)2 formed at 28 days lies between 20,O and 40%. This large variation is a result of the different techniques adopted (TGA, DSC, X R D , chemi- cal analysis, etc.), the variation i n the physical and chemical properties of the C3S material (purity, reac- tivity, surface area, etc.), and the preparation method (waterlsolid ratio, temperature, curing, etc.). Figure 4b clearly shows that a t all times of hydration u p t o 28 days CaC03 promotes formation of Ca(0H)z. T h e acce- lerating effect o n hydration of C3S depends o n the amount of CaC03 added, 15% CaC03 providing greater accelerating effect than 5% CaC03.
For estimating the degree of hydration of cements and cement components b y means of percentage of non- evaporable water content the amount of chemically- held water i n the CH and C-S-H phases has t o be deter- mined. T h e weight loss due t o loss of CO2 from CaC03 has also t o be taken into account. T h e paste has t o be dried in such a way that only the physically-held water is removed, and this is not easy t o achieve. T h e dried sample m u s t b e heated so that all the combined water is expelled. I n t h e present study weight loss is based o n that of a sample dried for one day i n vacuum or heated t o 100°C
in
the T G A apparatus. T h e total weight loss was determined after heating t o 1000°C. T h e results given i n fig. 5 are based o n the weight of C3S.Generally, higher values are obtained for samples dried by the vacuum method, possibly because not all physi- cally-held water i s expelled. T h e values of the non-eva- porable water content (based o n C3S) are higher as the period of hydration increases. At a particular stage of hydration the values decrease as follows: C3S
-
15% CaC03> C3S
-
5% CaCO3>
C3S-
0% CaC03. For sam- ples containing n o CaC03 t h e value a t one day is 6,3%, increasing t o 18,8% a t 28 days; for samples containing 15% CaC03 the increase is from 12,7% t o 24%. I n this work the non-evaporable water contents for C3S paste at 28 days were 18,8% and 16,1%, respectively, as de-C3S a 28 giorni era pari a1 18,8% e 16,1% rispettiva- termined b y vacuum drying and thermal treatment a t
mente, determinati mediante essiccazione sotto vuoto 100°C. According t o the literature [17, 19, 241 the non-
e trattamento termico a 100°C. Secondo la letteratura evaporable water content values for C3S hydrated for
[17, 19, 241, il tenore di acqua non evaporabile del CsS 28 days vary between 13% and 17%. I t is concluded,
idratato per 28 giorni varia dal 13% a1 17%. Si con- therefore, that t h e addition of CaC03 results
in
accele-clude pertanto che l'aggiunta di CaCO3 ha per risultato rated hydration of C3S (fig. 5).
l'accelerazione del'l'idratazione del C3S (fig. 5).
La velocita di idratazione pub essere determinata sulla base della quantith di C3S non ancora idratata a di- versi intervalli di tempo. In genere a tale fine viene adottato il metodo QXRD. Ramachandran [25] ha di- mostrato che il C3S pub essere stimato determinando l'area del picco endotermico che ha luogo a circa 915°C (Transizione triclina
a
monoclina, calore di trasforma- zione 1 cal/g). I1 metodo DTA, adottato ai fini di que- sta determinazione, & stato attuato come segue: la pa- sta di C3S i: stata riscaldata a 1000QC, quindi raffred- data a 800°C e nuovamente riscaldata a 20°C/min, fino a 1000°C. I1 primo riscaldamento a 1000°C elimina i pic- chi non reversibili che si possono presentare tra 900°C e 1000°C. La figura 6 mostra un picco di transizione endotermica per C3S.Rate of hydration can be followed b y determining the amount of C3S remaining unhydrated at different times. Generally, the Q X R D method is adopted for this pur- pose. Ramachandran [25] has shown that C3S can be
estimated b y determining the area of the endothermal '
peak that occurs at about 915°C (Triclinic S Monoclinic
Transition, heat of transformation, I callg). T h e DTA method, which was adopted for this determination, was carried o u t as follows: C3S paste was heated t o 1000°C, then cooled t o 800°C, and reheated at 20°C/min u p t o 1000°C. T h e first heating t o 1000°C eliminates non-rever- sible peaks that may occur between 900°C and 1000°C. Figure 6 shows a n endothermal transition peak for
c3s.
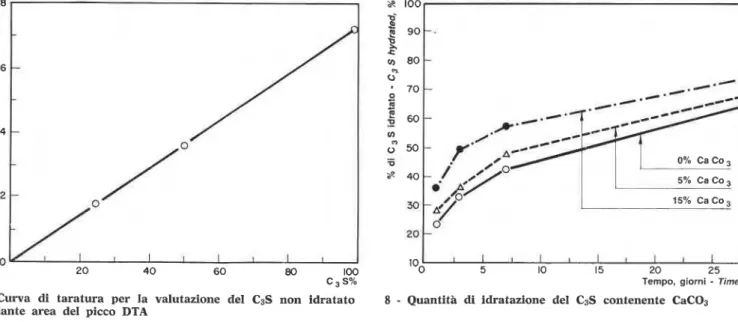
E' stata realizzata una curva di taratura per la quan- A calibration curve for the amount of C3S i n a mixture
tit& di C3S in una miscela mescolando a-AI203 calcinato was carried out b y mixing calcined a-A1203 w i t h k n o w n
con quantith note di C3S e determinando l'area endo- amounts of C3S and determining the endothermal area.
termica. Ne k risultata una linea retta (fig. 7). I t resulted i n a straight line (fig. 7). -
La figura 8 m0Sti-a la quantita di C3S idratato in tempi Figure 8 the amount o f C3S hydrated at d i f f e -
diversi in miscele contenenti lo 0%, 5% e 15% di rent times
in mixtures
containing 0, 5 and 15%caco3.
CaCO3. In tutti i tempi si e verificata maggiore i d r a At times more hydration has occurred in pastes
tazione nelle paste contenenti CaCO3. Dopo un giorno
containing CaC03. At one day values for degree of
i valori relativi a1 grado di idratazione con lo 0%, 5%
e 15% di CaC03 sono del 23%, 28% e 36% rispettiva- hydration w i t h 0, 5 and 15% CaC03 are 23, 28 and
mente; i valori corrispondenti a 28 giorni sono il 65%, 36%, respectively; the c o r r e s ~ o n d i n g values at 28 days 68% e 74% rispettivamente (basati sul CIS). 11 note- are 65, 68 and 74%, ~ ~ e s ~ e c t i v e l ~ (based o n C3S). T h e vole effetto accelerante del C ~ C O ~ & manifksto dopa substantial accelerating effect of CaC03 is evident at
un giorno. 1'1 grado di idratazione del C3S puro pub one day. T h e degree of hydration of pure C3S m a y vary
7
-
Curva di taratura per la valutazione del C3S non idratato rnediante area del picco DTAI I 1 I I I 1 1 I I
5 10 15 20 25 30
Tempo, giorni
-
Time, daysQuantita di idratazione del C3S contenente CaC03 7
-
Calibration curve f o r t h e estimation of unhydrated C3S b y 8-
Amount o f hydration o f C3S containing CaC039
-
Confronto tra la quantith di idratazione del C3S detenninata mediante formazione di C~(OH)Z e quantita di CIS entrata in reazione9
-
Comparison o f the amount of hydration o f C3S determinedb y C ~ ( O H ) Z formation w i t h the a m o u n t of reacted C I S
10
-
Confronto tra la quantitit di idratazione del C3S determi-b
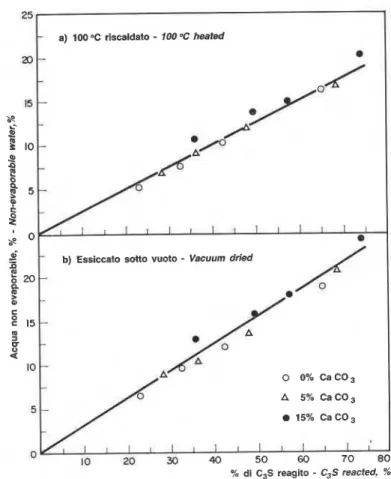
nata mediante contenuto d'acqua non evaporabile e quantith di C3S entrata in reazione10
-
Comparison of the amount of hydration of C3S determinedb y non-evaporable water content w i t h the amount o f reacted
c3s
variare tra il 55% e il 90% a 28 giorni, second0 la superficie specifica, la stima del metodo di determina- zione adottato e le condizioni di stagionatura [16-21,
23, 24, 26-33]. Questi risultati mostrano andamenti ana-
loghi a quelli basati sulle determinazioni del tenore d'acqua non evaporabile e Ca(0H)z.
In presenza di certi additivi come il CaC12, cambia il rapporto CIS del prodotto C-S-H di mod0 che il grado di idratazione, basato o sul Ca(OH)2 o sul tenore d'acqua non evaporabile, pub non manifestare una buona correlazione con la velociti di i'dratazione del
C3S [34]. Un grafico della percentuale di C3S entrato
in reazione rispetto a1 contenuto di Ca(0H)z indica una relazione lineare (fig. 9). La linea pub non passare dall'origine, dato ohe il rapporto C/S del prodotto C-S-H nei primi stadi di idratazione e diverso da quel- lo degli stadi successivi.
E' manifesta una certa correlazione anohe nel rappor- to tra percentuale di C3S entrato in reazione e conte- nuto in acqua non evaporabile per entrambi i metodi di essiccamento (fig. 10). Questi risultati in'dicano che in presenza di CaC03, & possibile che il rapporto CIS del prodotto C-S-H non sia influenzato in lnisura note- vole, specialmente dopo che l'idratazioae & proceduta oltre il 25%.
La figura 11 presenta curve calorimetriche di condu-
zione della velocita di sviluppo del calore per il C3S
a) 100 OC riscaldato
-
100 OC heated+
-
-
.-a b) Essiccato sotto vuoto
-
Vacuum driedb 20
-
P. B-
Ce
15- mB -
u 10 - A/*/
A 0 0% 5% Ca Ca CO, CO, 15% CaCO, l l l l l l l r l l I0 20 30 40 50 60 70 80 % di C3S reagito-
C,S reacted, %between 55 and 90% at 28 days, depending o n surface area, o n the estimation method adopted, and o n curing conditions [16-21, 23, 24, 26-33]. These results show trends similar t o those based o n Ca(OHj2 and non-eva- porable water content determinations.
I n the presence of certain admixtures such as CaC12, the C I S ratio of the C-S-H product changes so that the degree of hydration, based o n either Ca(0H)z or non- evaporable water content, m a y not show a good cor- relation w i t h rate of lzydration of C3S [34]. A plot o f percentage of reacted C3S versus Ca(0H)z content indi- cates a linear relation (fig. 9). T h e line m a y not pass through the origin because the C I S ratio of the C-S-H product a t earlier periods of hydration i s different from that at later periods.
S o m e correlation is also evident i n t h e plot of percen- tage of reacted C S irersus non-evaporable water con. tent for both methods of drying (fig. 10). These results indicate that
in
t h e presence of CaC03 the C I S ratio of the C-S-H product m a y not be significantly affected,especially after hydration has proceeded beyond
about 25%.
Figure 11 presents conduction calorimetric curves for the rate of heat development for C3S during a hydra-
durante un periodo di idratazione fino a 24 h in pre- senza d i 0%, 5%, 10% e 15% di CaCO3. L'avvio del pe- riodo di accelerazione, che rappresenta l'idratazione del C3S, non sembra venga influenzato dai CaCO3. In- vece l'ampiezaa del piuco k influenzata in quanto aumenta l'intensita aumentando la quantita del CaC03 aggiunto. La figura 12 indica il calore complessivo svi- luppato dalle miscele. Per tutti i tempi fino a 24 h il calore complessivo sviluppato decresce nella seguente maniera: C3S
-
15% CaCO3>
C3S-
10% CaC03>
>
C3S-
5% CaCO3>
C3S-
0% CaCO3. Se ne pub concludere che il CaCOs accelera l'idratazione del CsS, con un'azione tipica del CaC12, per quanto non sembra che il CaC03 rilduca il periodo di induzione. Allo scopo di eliminare l'effetto diluente del CaCO3, gli effetti del calore sono stati ricalcolati sulla base del C3S (figg. 13 e 14). Questi risultati mostrano i chiari effetti dell'ac- celerazione quando a1 C3S viene aggiunto del CaCO3. Cio k significativo, in particolar mod0 durante le prime8 ore.
tion period of u p t o 24 h i n the presence of 0, 5, 10 and 15% CaC03. T h e onset of the accelerating period, representing hydration of C3S, does not seem t o be affected b y CaC03. T h e amplitude of the peak is, howe- ver, affected, the intensity increasing as the amount of added CaC03 is increased. Figure 12 gives the total heat developed by the mixes. At all times u p t o 24 h the total heat development decreases i n the following manner.. C3S
-
15% CaC03>
C3S-
10% CaC03>
C3S - 5% CaCO3>
C3S-
0% CaC03. I t m a y be concluded that CaC03 accelerates hydration of C3S, typical of the action of CaCl2, although CaC03 does not s e e m t o decrease the induction period. I n order t o eliminate the dilution effect of CaCO3, heat effects were re-calculated o n the basis of C3S (figs. 13 and 14). These results show the distinct effects of acceleration w h e n CaC03 is added t o C3S. I t is significant, particularly during the first 8 h.Determ'inazione del rapport0 CaO/Si02 e d,ensita de~lla fase Determination of CaO/SiOz ratio a'nd density of C-S-H phase
C-S-H degli impasti di C3S of C3S pastes
I rapporti C/S della fase C-S-H negli impasti C3S for- matisi in momenti diversi sono stati calcolati come segue: utilizzando una quantita nota di pasta essi'ccata sotto vuoto (ml), mediante TGA sono state determi- nate la percentuale di peso calcinato (m2) e la percen- tuale di Ca(OH)2 (m3). La percentuale di C3S non idra- tat0 residuo nell'impasto 15 stata determinata (m4) me- diante DTA.
Quantita originale di C3S utislizzata per
l'idratazione = ml
x
m2 (1) Quantita di C3S non idratato in questapasta = ml
x
m4 (2)Quantith di C3S consumato nella reazio- ne di idratazione: ml
x
m2 - mlx
m4 == rnl (m2
-
m4) (3)Quantita del CH nella pasta = ml
x
m3 (4) La quantita totale di CaO da C3S consumata nella for- mazione di CH e C-S-H kT h e C I S ratios of the C-S-H phase i n C3S pastes formed at different times were calculated as follows: Using
a
k n o w n amount of vacuum-dried paste (ml), the per- centage of ignited weight (mz) and percentage
01
Ca(OH)2 (m3) were determined by TGA. T h e percen- tage of unhydrated C3S remaining i n the paste was determined (m4) b y DTA.Original amount of C3S used for hydra-
tion = m~
x
m2 ( 1 )Amount of unhydrated C3S i n this
paste = ml
x
m$ (2)Amount of C3S consumed i n the hydra- tion reaction i s ml X m2
-
mlx
m$ == ml (rnr
-
m4) (3)Amount of CH i n the paste = ml
x
m3 (4) T h e total amount of CaO from C3S consumed i n the formation of CH and C-S-H isdove Mcao e Mcjs sono i pesi molecoiari di CaO e C3S where Mcao and Mc3s are the molecular weights of CaO
rispettivamente. and C3S, respectively.
La quantita di CaO in CH nell'impasto k T h e amount of CaO i n CH i n the paste is
dove MCH k il peso molecolare di Ca(OH)2. where MCH is the molecular weight of Ca(OH)2.
La quantita di SiO2 nella fase C-S-H b
dove Msio, b il peso molecolare di Si02.
I1 rapporto molare di CaO/SiOz nella fase C-S-H b
e pub essere semplificato come segue:
e ulteriormente semplificato in:
Per i valori riportati nella fig. 15 b stato tenuto conto di una pilocola quantita di carbonatazione in alcuni delgli impasti, ma tale quantita non i: stata compresa nel- l'equazione di cui sopra. Calco'li analoghi sono stati fatti per miscele con CaC03 aggiunto. Per la determi- nazione del CaC03 6 stato adottato il TGA.
I rapporti CIS del prodotto C-S-H sono indicati come funzione del tempo nella fig. 15. I1 rapporto aumenta nel period0 che intercorre tra 1 e 7 giorni, per poi rimanere praticamente costante. Esistono indizi secon- do i quali l'irnpasto contenente CaCO3 ha un rapporto CaO/Si02 leggermente superiore a quello completa- mente privo. Una parte della spiegazione sta nel fatto che una certa quantita ,di CaC03 b incorporata nella fase C-S-H. D q o 28 giorni il rapporto C/S della fase C-S-H per l'impasto di C3S contenente lo 0% di CaC03
b pari a11'1,86%, rispetto a11'1,92% dell'impasto conte-
nente il 15% di CaC03. I valori citati nella letteratura relativi all'impasto ,di C3S idratato per 28 giorni oscil- lano tra 1,4 e 2,O [17-21, 24, 28, 29, 33, 35-38]. E~ssi dipen- dono dal repporto acqua/solido e dal metodo di deter- minazione.
L'adozione di rapporti acqua/solido pih bassi tende a dare rapporti C/S piu alti. I1 metodo per estrazione chimica da valori inferiori a quelli ottenuti con proce- dure termiche. Per paste preparate con un rapporto acqua/solido pari a 0,45, Loch'er 1171 ha ottenuto un rapporto CIS di circa 1,5-1,6 con il metodo dell'estra- zione chimica e uno di circa 2,O con il metodo termo- gravimetrico. E' possibile cihe il metodo chimico possa estrarre del CH legato dalla fase C-S-H; d'altro canto, nel misurare la perdita di acqua dal CH, il TGA mi- sura l'H2O cledutia dal C-S-H 1391.
La figura 16 fornisce un grafico che mette in rapporto il grado di idratazione con il rapporto C/S per la fase C-S-H negli impasti formati con e senza CaCO3. Nella relaziane si nota una leggera dispersione, indicativa di una leggera modifica nella natura intrinseca della fase C-S-H. La curva indica un leggero aumento del rappor-
T h e amount of Si02 i n the C-S-H phase is
where
Msio,
is the molecular weight of SiO2. Molar ratio of CaOISi02 in the C-S-H phase isThis m a y be simplified as follows,
and further simplified t o
A small amount of carbonation i n some of the pastes has been taken into account for the values reported i n fig. 15, but is not included
in
the above equation. Similar calculations were carried out for mixtures containing added CaC03. TGA was used for estimat- ing CaCO3.T h e C I S ratios of the C-S-H product are shown as a function of time i n fig. 15. T h e ratio increases between one and 7 days, thereafter remaining practically con- stant. There is evidence that the paste containing CaC03 has a slightly higher CaO/Si02 ratio than that containing none. Part of the explanation lies i n the fact that some CaCOl is incorporated into the C-S-H phase. At 28 days the C I S ratio of the C-S-H phase for C3S paste containing 0% CaC03 is 1,86, compared t o
1,92 for paste containing 15% CaCO3. Values quoted i n the literature for C3S paste hydrated for 28 days vary between 1,4 and 2,O [17-21, 24, 28, 29, 33, 35-38]. T h e y depend o n the w / s ratio and o n the method of deter- mination.
T h e use of lower w / s ratios tends t o give higher C I S ratios. T h e chemical extraction method yields lower values than those obtained by thermal procedures. For pastes prepared at a w l s ratio of 0,45, Locher [I71
obtained a C I S ratio of about 1,5-1,6 w i t h the chemical extraction method and one of about 2,O w i t h the ther- mogravimetric method. I t is possible that the chemical method may extract some bound CH from the C-S-H phase. O n the other hand, i n measuring water loss from CH, TGA measures Hz0 given out b y C-S-H [39].
A plot of degree of hydration versus C I S ratio for the C-S-H phase in pastes formed w i t h and without CaC03 is shown i n fig. 16. A slight scatter is evident i n the relation, indicative of a slight modification of the in- trinsic nature of the C-S-H phase. T h e curve indicates a slight increase
in
the C / S ratio as hydration progres-I t I e
o 4 E re 16 2 o 2 4
Tempo, ore
-
Time, hours1 I I I I
1
4 0 12 16 20 2 4
Tempo, ore
-
Time, hours.
-
'
4 0 - 32 - 24-
16-
0-
0 4 12 16 20 2 4Tempo, ore - Time, hours
13 14 I 2.0 '? I '? 20- 0 $
"2
,- 5 + 0 0 0 ---A i 5 1ns
I---z---
E 2---
0 062
?Gi 0 m $1.8 0 0 17 1-66 1 I 1 I I 1 I I I I 5 10 --
A 0 - A.-
o A Q * A • o 0% Ca C O ,-
A 5% Ca CO,
- 15% Ca Co-
I I I I I I 1 I I I 15 2 0 2 5 3 0 In620'
30 40 6 0 70 80 5!Tempo, giorni - Time, days /O di C
,
S reagito-
C 3 S reacted, %15 16
11
-
Curve calorimetriche di conduzione del C3S contenente diverse quantita di CaC03 (base C3S+
CaCOs); 12-
Calore sviluppatonell'idratazione di C3S contenente diverse quantita di CaC03 (base CIS
+
CaC03); 13-
Curve calorhetriche di conduzione del C3Scontenente diverse quantita di C a C 4 (base C3S); 14
-
Calore sviluppato nell'idratazione del C3S contenente diverse quantita diCaC03 (base C3S); 15
-
Variazione del rapport0 CaO/SiOz del C-S-H in impasti di C3S contenenti CaC03; 16-
Rapporto CaO/SiOz-
del C-S-H rispetto a1 grado di idratazione negli impasti di C3S contenenti CaC03
I 1
-
Conduction calorimetric curves o f C3S containing d i f f e r e n t a m o u n t s o f CaC03(C3+
CaC03 basis); 12 - Heat developed i n t h e hydration o f C3S containing d i f f e r e n t a m o u n t s o f CaC03(C3S+
CaC03 basis); 13-
Conduction calorimetric curves o f C3S containing d i f f e r e n t a m o u n t s o f CaC03fC3S basis); 14-
Heat developed i n t h e hydration o f C3S containing d i f f e r e n t a m o u n t s o f CaC03(C3S basis); 15 - Variation o f CaO/SiOz ratio of C-S-H i n C3S pastes containing CaC03; 16 - CaO/SiOz ratio o f C-S-H versus degree o f hydration i n CIS pastes containing CaC03Densita di C-S-H (g/ml), giorni
CaCOa A/S Density o f C-S-H ( g / r n l ) , days
(%) W / S I / 3 1 7 1 2 8
TABELLA I
Densita del GS-H in impasti di C3S contenenti diverse quantita
di CaC03
5 0,4 2,02 2,08 2,09 2,16
TABLE I
15 0,4 2,05 2,09 2,14 2,14 Density of C-S-H in C3S pastes containing different amounts
01 CaC03
to C/S col progredire dell'idratazione (fig. IS), parzial- mente dovuto all'inconporazione del CaC03 nella fase C-S-H. Questo andamento e stato osservato anche da Glasser et al. [36] e da Kondo 1401 per gli impasti puri di C3S.
La densita assoluta del C-S-H negli impasti di C3S idra- tat0 per 1, 3, 7 e 28 giorni b indicata nella Tabella I. I calcoli tengono conto della quantita di CH, C3S non idratato e CaCO3. In linea generale la densith aumenta col progredire dell'idratazione, mentre i campioni che contengono CaCO3 manifestano vslori di densita leg- germente superiori. Nella letteratura, i valori di den- sita per gli impasti di C3S contenenti C-S-H e CH sono indicati come variabili perch6 dipendono dal metodo di determinazione, dal metcrdo di essiccazione, dalla porosita e dal grado di idratazione. Per l'impasto di C3S (acqua/solildo = 0,5) idratato per 5 anni, Feldman
[41] ha ottenuto un valme tra 2,25 e 2,45 g/,ml che di- pendeva dalla correzione per il CH e gli spazi inter- reticolari. Tutti i campioni erano stati essiccati alllll% di U.R. Nella Tabella I i valori variano da 2,12 a 2,16.
Questi non possono essere confrontati direttamente con le cifre fornite da Feldman, perch6 i campioni non erano stati idratati completamente, erano stati essic- cati second0 metodi diversi ed erano stati preparati con diverso rapport0 acqua/solido. Alla fase C-S-H essiccata sotto vuoto formata negli impasti 1421 viene attribuito un valore di circa 2,l. Un tracciato del grado di idratazione rispetto alla densita assoluta di C-S-H mostra una certa dispersione. Un confront0 tra le den- sita di paste con e senza CaC03 a un particolare grado di idratazione rivela delle differenze che lasciano in- tuire differenze nelle proprieta intrinseche.
Stato del CaC03
E' stato dismostrato che nell'idratazione del C3A il car- bonato di calcio reagilsce formando un carboalluminato comp'lesso. Analogamente, il CaClz forma un cloroallu- minato complesso con il C3A. Pur essendo stato sup-
-
posto che il CaClz sia inerte rispetto a1 C3S che si idra-ta, sia Ramachandran [43] che Richartz 1441 hanno confermato che il cloruro di calcio e strettamente le- gato come complesso con la pasta di C3S. Sono stati percio condotti esperimenti per studiare se il CaC03
6 pure combinato con la pasta d i CsS come complesso.
ses (fig. 15), partly due t o incorporation of CaCOj into the C-S-H phase. This trend was also observed by Glasser et al. [36] and b y Kondo [40] for pure C3S pastes.
T h e absolute density of C-S-H i n C3S pastes hydrated for 1, 3, 7 and 28 days is shown i n Table I. T h e calcu- lations take into account t h e amount of CH, unhydra- ted C3S, and CaC03. Generally, density increases as hydration progresses, samples containing CaC03 show- ing slightly higher density values. I n the literature, density values for CjS pastes containing C-S-H and CH are reported t o vary because they depend o n the me- thod of determination, drying method, porosity, and degree of hydration. For CjS paste ( w l s = 0,5) hydra- ted for 5 years Feldman [ d l ] obtained a value between
2,25 and 2,45 g l m l that depended o n correction for CH
and interlayer spaces. T h e samples were all dried t o
11% RH. I n Table I the values lie between 2,12 and 2,16. These cannot be compared directly w i t h Feldman's
figures because the samples were not completely hydrated, were dried differently, and were prepared at a different w l s ratio. A value of about 2,l is assigned for the vacuum-dried C-S-H phase formed i n pastes
[42]. A plot of the degree of hydration versus absolute
density of C-S-H shows some scatter. Comparison of density at any particular degree of hydration for pastes w i t h and without CaC03 shows differences, suggesting differences i n the intrinsic properties.
State of CaC03
I t has been shown that i n the hydration of CjA calcium carbonate reacts w i t h it t o form a carboaluminate com- plex. Similarly, CaCL forms a chloroaluminate complex w i t h C3A. Although i t is assumed that CaClz is inert w i t h respect t o hydrating CjS, both Ramachandran [43] and Richartz [44] have confirmed that the calcium chloride is bound strongly as a complex w i t h the CjS paste. Experiments were therefore carried out t o inve- stigate whether CaC03 is also bound t o the C3S paste as a complex.
C3S (85%)
+
CaC03 (15%) non idrata-15,0 (TGA)
t o
-
unhydratedN.
- -
C3S preidratato per 28 giorni
-
prehy-2 drated for 28 days (85%) f CaC03 14,9 (TGA)
(15%)
TABELLA I1
Quantith di CaC03 libera nel sistema C3S-CaC03-H20 Campione
-
SampleC3S (85%)
+
CaC03 (15%) idratato per12,6 (TGA)
28 giorni
-
hydrated for 28 daysQuantiti di CaC03 Amount o f CaC03
(%I
Campione 3 riscaldato a 525°C
-
Sam- 12,4 (chimico-
TABLE I 1ple 3 heated to 52S°C chemical)
Amount of free CaC03 in the C3S-CaC03-H20 system
Nell'analisi termogravimetrica del sistema C3S
+
+
CaCO3+
H20 si i: rilevato che il picco dovuto a1 CaCO3 calava col procedere dell'idratazione. Cib indi- cava che una certa quantita di CaC03 veniva consu- mata durante la reazione di idratazione (fig. 17). Nelle miscele C3S-
CaCO3 contenenti il 15% di CaCO3 e il 5% di CaCO3, le quantita di CaC03 che reagivano con il C3S di idratazione erano del 2,38% e 1,34% rispetti- vamente. Dopo tre giorni di idratazione il consumo di CaCO3 era assai ridotto. Si i: ritenuto possibile che il CaCO3 reagisse con la pasta di C3S durante il riscalda- mento nell'apparec~chio TGA. Per verifiuare questa s q - posizione, il 15% di CaCO3 i: stato aggiunto a1 C3S preidratato (28 giorni) e si & eseguita la TGA. I risul- tati rivelano che il CaC03 rimane in uno stato libero (Tabella 11).I1 metodo chimico i: stato applicato anohe per la valu- tazione della CO2 e quindi per determinare la quantita di CaC03 libero nella miscela. I1 metodo dwrebbe indi- care tutto il CaC03 presente nell'impasto. Quando la pasda stagionata per 28 giorni e stata risicaldata a 525°C e analizzata per determinare la quantita di CaCO3, que- sta era diminuita dal 15% a1 12,4%, lasciando intuire ohe circa il 2,5% di esso (quell0 combinato con la fase C-S-H) viene liberato a 525°C o meno (Tabella 11). Que- sti risultati avranno delle implicazioni in termini di effetto accelerante del CaCO3 sul C3S e anche nella determinazione della quantita ottimale di CaCO3 occor- rente per sostituire (in tutto o in parte) il gesso nel cemento.
Microstruttura
Le propriet: microstrutturali del C3S idratato in pre- senza di CaC03 sono state studiate controllando la struttura dei pori e mediante l'esame morfologico. Sia la porosita che la densita diminuiscono con l'aumen- tare del tempo di idratazione (fig. 18). Durante l'idra- tazione di C3S si formano Ca(OH)2 e C-S-H che hanno densita inferiori a1 C3S e quindi occupano maggiore volume. Essi occupano gli spazi dei pori e diminuisco- no la porosita totale col progredire dell'idratazione. La
I n the thermogravimetric analysis of C3S
+
CaC03+
+
Hz0 system i t was found that the peak due t o CaC03 diminished as hydration proceeded. This indicated that some CaC03 was consumed during the hydration reac- tion (fig. 17). I n the C3S-
CaC03 mixture containing 15% CaC03 and 5% CaC03, the amounts of CaC03 react- ing w i t h the hydrating C3S were 2,38 and 1,34%, respec- tively. There was little consumption of CaCO3 after three days of hydration. I t was thought possible that CaC03 reacted w i t h the C3S paste during heating i n the T G A apparatus. T o check this, 15% CaC03 was added t o prehydrated C3S (28 days) and TGA was carried out. T h e results show that CaC03 remains i n a free state (Table 11).T h e chemical method was also applied t o estimate COz and t h u s t o determine the amount of free CaC03 i n the paste. I t should indicate all the CaC03 present in the mixture. W h e n the 28 day paste was heated t o 525°C and analysed for CaC03, the amount of CaC03 had decreased t o 12,4% from 15%, suggesting that about 2,5% of i t (that combined w i t h the C-S-H phase) is released at or before 525°C (Table 11). These results will have implications i n terms of the accelerating effect of CaC03 o n C3S and also i n the determination of the o p t i m u m amount of CaC03 needed t o replace gypsum (wholly or partly) i n cement.
Microstructure
T h e microstructural properties of C3S hydrated