Behavior of High Strength Fiber Reinforced
Concrete Beams in Shear
by
Dawood Abdulhai Pandor
B.Eng., Imperial College, University of London
Submitted to the Department of Civil and Environmental
Engineering
in partial fulfillment of the requirements for the degree of
Master of Science in Civil and Environmental Engineering
at the
MASSACHUSETTS INSTITUTE OF TECHNOLOGY
February 1994
@ Massachusetts Institute of Technology 1994. All rights reserved.
Author
...
...
....
...
Department of Civil and Environmental Engineering
January, 1994
Certified
by...
...
-
.
..
....
.-...
Oral Buyukozturk
Professor
Thesis Supervisor
Accepted by
...
•rp"w"
r
....
Joseph Sussman
Chairman, Dep
on Graduate Students
Behavior of High Strength Fiber Reinforced Concrete
Beams in Shear
by
Dawood Abdulhai Pandor
Submitted to the Department of Civil and Environmental Engineering on January, 1994, in partial fulfillment of the
requirements for the degree of
Master of Science in Civil and Environmental Engineering
Abstract
The objective of this thesis is to investigate experimentally the behavior of high strength fiber reinforced deep concrete beams in shear, in order to arrive at a working model and equation for predicting the shear strengths of these structural members . In the experimental program, the volume fraction and aspect ratio of fibers, the shear span to depth ratio of the specimens, and the maximum aggregate size were varied in order to determine the effect of these variables on the specimen strength, on application of four point loading .
In general, it was observed that the addition of fibers led to a significant
improve-ment in the shear strengths of the specimens .
Modification of an existing formula, proposed for the prediction of beam shear strengths, and the incorporation of a term to account for the contribution from the fibers to the specimen strength, yielded results which correspond very closely to those
obtained experimentally and in other research programs .
A model for high strength fiber reinforced concrete, based on an existing shear
truss model, was also developed to enable the peak deflections and strengths of these specimens to be predicted, and this model also yielded very good agreement with the observed data .
Use of this model therefore represents a useful method for investigating the behav-ior of high strength fiber reinforced deep concrete beams, and the proposed equation, after the inclusion of a satisfactory factor of safety, is an especially useful tool for utilisation in design practise .
Thesis Supervisor: Oral Buyukozturk Title: Professor
Acknowledgements
I would like to thank the following :
Professor Buyukozturk, for providing the necesssary guidance to enable me to suc-cessfully complete this thesis
Professor Leung, Thanakorn Pheeraphan, Yiping Geng and Amjad Shahbazker for providing valuable advice and assistance
W.R. Grace and Co., for providing the materials used in the experimental program . The American Concrete Institute, for providing partial funding for this research.
Contents
1 Introduction 11
1.1 Objectives and scope of the research program . ... 13
1.1.1 Objectives . . . .. . . . 13
1.1.2 Scope . . . 13
1.1.3 Organisation of thesis ... 14
2 Review of the shear behavior of concrete beams 15 2.1 Shear behavior of plain concrete ... 15
2.2 Shear behavior of normal strength fiber reinforced concrete beams . 17 2.3 Shear behavior of high strength fiber reinforced concrete beams . .. 19
2.3.1 General properties of high strength fiber reinforced concrete ( HSFRC ) . .. .. ... .. .. .. .. ... .. .. .. .. .. 19
2.3.2 Behavior of plain high strength concrete beams in shear . ... 20
2.3.3 Behavior of high strength fiber reinforced concrete beams in shear 23 3 Load-deformation predictions for high-strength fiber reinforced deep beams 27 3.1 Deep beam shear model ... 28
3.1.1 Equilibrium equations ... 30
3.1.2 Compatibility equations ... 30
3.1.3 Material laws ... 31
3.1.4 Simplifying assumptions ... .. 35
3.1.6 Solution procedure ...
4 Experimental work 44
4.1 Scope . . . 44
4.2 Tests specim ens ... 45
4.3 Design of HSFRC beams ... 47
4.3.1 Flexural analysis ... 47
4.3.2 Shear strength estimation ... . 50
4.4 Batch design and material selection . ... 51
4.5 Preparation and casting of specimens . ... . ... 53
4.6 Testing procedure ... 54
4.6.1 Compression and splitting tensile tests . ... 54
4.6.2 Beam shear tests ... 57
5 Observations and Results 59 5.1 Experimental results ... 59
5.1.1 Production ... 59
5.1.2 Compression tests ... 60
5.1.3 Splitting tensile tests ... .. 60
5.1.4 Beam shear tests ... 60
6 Discussion of results 73 6.1 Deep beam shear model ... 73
6.2 Discussion of proposed equation for shear strength prediction .... . 86
6.2.1 Choice of shear equation ... 86
6.2.2 Verification of the applicability of Bazant's formula to HSC deep beam s ... 88
6.2.3 Modification of Bazant's formula . ... 92
7 Summary, conclusions and recommendations for future work 104 7.1 Summary ... ... 104
7.2.1 Experimental ... 104
7.2.2 Theoretical ... 107
7.3 Recommendations for further study . ... 108
List of Figures
2-1 Beam action[5] ... ... 16
2-2 Arch action[5] ... ... 16
2-3 Transition layer, containing calcium-hydroxide, around a fiber[7] . . . 18
2-4 Improved post-peak ductility due to fiber addition[17] . ... 19
2-5 Dependancy of failure mode on shear span ratio[21] . ... 21
2-6 a)Crack propagation in NC b)Crack propagation in HSC ... 22
2-7 Effect of Vf on shear capacity[23] . ... . 24
3-1 Truss model for reinforced concrete element[29] . ... 28
3-2 Deep beam stress condition[27] ... 29
3-3 Stress-strain relationship for steel . ... .. . 32
3-4 Compressive stress-strain relationship for concrete . ... 32
3-5 Tensile stress-strain relationship for concrete . ... 33
3-6 Distribution of compressive stresses for different values of a/d[27] . . 36
3-7 Dowel action idealization: (a)dowel bar, (b) beam on an elastic
foun-dation model, (c)failure condition[33] . ...
37
3-8 Dowel action at beam-column joint [33] . ... 37
3-9 Dowel action at beam support ... 38
3-10 (a) Bending moment diagram (b) Shear force diagram ...
40
3-11 Flow chart illustrating model solution procedure . ... 42
4-1 Sectional drawings ... 46
4-2 Stress-strain diagrams for beam cross-section[24] . ... 48
4-4 Laboratory cement mixer . . . . 4-5 Testing machine ...
4-6 Testing cylinders capped with hydrostone . . . . 4-7 Compressive strength determination . . . . 4-8 Tensile splitting test set-up . . . . 4-9 Beam shear test set-up . . . .
5-1 Split cylinder test for V1 = 0.0 . . . .
5-2 (a)Initial crack location in specimens (b)Failed specimen
5-3 Beam tests for V1 = 0.0 (al) ...
5-4 Beam tests for V1 = 0.4 (a2) ...
5-5 Beam tests for V1 = 0.8 (a3) . . . .
5-6 Beam tests for V1 = 1.2 (a4) ...
5-7 Beam tests for a/d = 0.88 (bl) . . . .
5-8 Beam tests for a/d = 1.73 (b2) . . . .
5-9 Beam tests for hooked end fibers (cl) . . . . 5-10 Beam tests for straight fibers (c2) . . . . 5-11 Beam tests for maximum d, = 0.25 in (dl) . . . .
6-1 Action of fibers to (a)improve concrete properties,
role of stirrups ...
6-2 al-Model comparison for V1 = 0.0% . . . .
6-3 a2-Model comparison for V1 = 0.4% . . . .
6-4 a3-Model comparison for V1 = 0.8% . . . .
6-5 a4-Model comparison for V1 = 1.2% . . . .
6-6 bl-Model comparison for a/d = 0.88 . . . .
6-7 b2-Model comparison for a/d = 1.73 . . . .
6-8 cl-Model comparison for hooked end fibers . . . . 6-9 c2-Model comparison for straight fibers . . . . 6-10 Generalised post-peak behavior of specimens . . . 6-11 Beam tests by Ashour[23] . . . .
6-12 Comparison of load-deflection plots for various Vf . ... 83
6-13 Comparison of load-deflection plots for various V1 . . . .. 84
6-14 Comparison of strength predictions using different formulae[26] . . . 87
6-15 Comparison of Bazant's predictions to Ahmad's results ... 90
6-16 Comparison of Bazant's to Ahmad's results . ... . . . 90
6-17 Comparison of Bazant's to Ahmad's results . ... 91
6-18 Comparison of Bazant's to Ahmad's results . ... 91
6-19 Normalised experimental results and non-linear optimal curve .... 94
6-20 Predictions for the fiber aspect ratio and effectiveness variation .... 97
6-21 Application of modified equation to tests performed by Shahbazker for volume fraction variation ... 99
6-22 Application of modified equation to tests performed by Shahbazker for Vf = 0.0% . . . .. . .. . . . . .. . . . .. . .. . 99
6-23 Application of modified equation to tests performed by Shahbazker for Vf = 0.4% . . . .. .. . . ... .. .. .. .. ... .. .. .. ... . 100
6-24 Application of modified equation to tests performed by Shahbazker for
Vf = 0.8% . . . .
. . . .. . .. 100
List of Tables
1 .2 Application of eqtns. I and II to the specimens tested by Shahbasker
2.2 Application of Shahbazker's eqtn. to the results obtained by Ashour[23] 26 4.1 Specimen types investigated ...
4.2 Summary of flexural calculations . . . .
4.3 Estimated shear capacities . . . . 4.4 Mix proportions used ...
4.5 OQuantities used in tv ical castine o eration . . . .
51~ Table of exnerimental results...
6.1 Results from deep beam shear model . . . .
6.2 Application of model to the results from Shahbazker[23] .
6.3 Application of model to the results from Ashour[23] . . .
6.4 Results from tests by Ahmad[21] and predicted strengths discussed in Section 6.2.3) ...
6.5 Results from tests by Elzanaty[22] (fc = 10000 psi) . . .
(Method II
6.6 Predictions for practical sized specimens using 1987 formula and method
II formula(p = 0.04,fe = 10000 psi,d = 19.6in.) . . . .
6.7 Comparison of observed and predicted shear capacities using the mod-ified equation . . . .
6.8 Shahbazker's test results and modified equation predictions . . . .
6.9 Ashour's test results and modified equation predictions . . . .
6.10 Comparison of observed and predicted shear capacities using method II 93 97 98 101 103 ,---- --- -,,-- ---- , ' 5... . .... .. .. .. e u l s.. . . . . . . . . . . . . . . . . . . . ..
Chapter 1
Introduction
Concrete with a 28 day compressive strength of over 7 000 psi (High Strength Con-crete) has, only over the last 20 years, received serious attention from Structural
Engineers and, indeed, been utilised in engineering applications [1] . Therefore,
com-pared with the research on Normal Strength Concrete(NC) which has occurred over the last century, as much is not understood about the behavior of High Strength Concrete(HSC).
One of the first misconceptions to clarify with respect to HSC, is that it is not
an entirely new material [2] . Indeed, HSC can be made by simply reducing the
water/cement ratio of concrete to a suitable level. This may then merit the addition of superplasticisers in order to improve the workability of the resulting mix.
In order to obtain further increases in strength (over approximately 11 000 psi), it will then be necessary to add other components, such as silica fume. Further measures, such as high temperature or pressure curing, and polymer impregnation [3], and modification of aggregate properties, can be taken to bring about an improvement in the performance of the material. The basic point, however, is that the essential components of a concrete mix need not be dramatically altered in order to create a concrete of higher strength.
A basic understanding for the differences between HSC and NC having been pro-vided, it is now necessary to examine the advantages and disadvantages to using HSC in practise.
HSC generally has the advantages, over normal strength concrete, of providing : 1. increased stiffness,
2. reduced axial shortening of members and therefore reduced problems concerning the maintenance of horizontally supported surfaces,
3. construction time saving, as strength development occurs at an early age,
4. possibility of creating new types of structural supporting systems-an area which requires further research,
5. economic advantages - the ability to remove formwork rapidly, the increased availibility of floor area as member sizes can be reduced, and decreased founda-tion costs as the overall weight of the structure can be reduced.
Other advantages, such as reduced prestressing losses (due to a reduced coefficient of creep) and a reduction in the quantity of reinforcement required, can also be incurred. It should be noted that the properties of core samples, removed from structural members after seven years of service, have indicated that the properties of
HSC remain excellent over time
r3].
HSC, however, does have certain drawbacks to its application.
In attempting to reduce element sizes due to the increased strength, attention must
be paid to ensure that the overall member stiffness ( as distinct from the material
stiffness ) is not reduced.
Also, the tensile strength of HSC, while greater than that of NC, does not increase in proportion to the compressive strength increase. For NC the tensile strength is usually approximately 10% of the compressive strength, but for HSC, the value may be as low as 5% [4] .
The most significant drawback with HSC is its ductility, or rather, the lack of ductility.
HSC demonstrates a very brittle behavior upon reaching the ultimate load, with
very limited post-peak ductility -failure of HSC specimens is usually very dramatic
In structural practise it is essential that the ultimate limit state behavior be such that sufficient warning of impending failure is provided to the occupants of the structure.
It is also very important for structures to have sufficient ductility to be able to absorb impact energy, and also to prevent dramatic failure in seismically active areas, where structures are subjected not only to rapidly varying displacements, but also to large shear forces. Many of the important metropolitan areas of the world are indeed located in seismic regions and therefore this consideration must be adressed for HSC. The use of steel tubes to provide a confining force for concrete has been applied successfully in practise, most notably in Seattle [1], to improve the ductility of HSC -columns.
However, a more general method of attaining this beneficial improvement is needed; a method more easy to implement in practise, and to a wider range of element types.
One possibility is through the use of fiber reinforced HSC, the subject of this thesis.
1.1
Objectives and scope of the research program
1.1.1
Objectives
The main objectives of this research program are to try to gain a better understanding for the shear behavior of high strength fiber reinforced concrete beams subjected to shear loading, and to try to obtain a means of predicting the behavior of such members.
1.1.2
Scope
In order to satisfy these objectives, it is necessary to divide the research into an experimental and a theoretical program.
The aims of the experimental program are to investigate the influence on the shear behavior of HSC beams when the following properties are varied :
1. the volume fraction of fibers
(
V1 )2. the shear span to depth ratio ( a/d )
3. the aggregate size ( d. )
4. the aspect ratio ( Il/d ) of the fibers.
The experimental program allows for an effective investigation of some of the factors influencing the shear strength of these specimens.
In the theoretical program, the results of these experiments, as well as the results from previous research studies, will be applied to try to obtain a predictive equation and model which will enable the shear strength of steel fiber reinforced HSC beams to be quantified successfully.
1.1.3
Organisation of thesis
This thesis is divided into six main sections :
Chapter 2 provides a brief review and discussion of the literature associated with this field of study,
Chapter 3 explains the model used in this thesis, Chapter 4 outlines the experimental program,
Chapter 5 provides the observations and results from this program, Chapter 6 contains a discussion of the results,
Chapter 2
Review of the shear behavior of
concrete beams
2.1
Shear behavior of plain concrete
Research over the last forty years has contributed significantly to attainment of a more complete understanding of the behavior of concrete specimens.
Essentially, failure in concrete beams develops as a result of the interaction be-tween the applied flexural and shear stresses, cracking occurring when this biaxial state of stress exceeds the capacity of the concrete.
There are generally two mechanisms for the transfer of shear forces within beams : a) Beam action (Figure 2-1), and
b) Arch action (Figure 2-2),
the dominance of any one particular type of mechanism being determined by the
a/d ratio of the specimen [5, 6] .
Beam action, dominant at large a/d values when the load cannot be transferred to the supports by the arch supporting mechanism, is generally considered to result from the resistance offerred by the uncracked concrete, the longitudinal reinforcement ( dowel action ) and the aggregate interlock mechanism.
Arch action, dominant at low a/d, generally results in the direct transfer of shear load from the point of application, to the supports. As the support is approached
Compression zone
1 iE S- r
Figure 2-1: Beam action[5]
d
Figure 2-2: Arch action[5]
16
P
Line of thrust
.jd
by the load, the depth of the compression zone increases, and thus the mechanism is facilitated, the horizontal resistance to the opening of the arch being provided by the longitudinal reinforcement.
2.2
Shear behavior of normal strength fiber
rein-forced concrete beams
In this section, the basic trends which occur when NC beams, reinforced with fibers, are subjected to shear, are presented.
The application of short, randomly distributed fibers to improve the properties of building materials is not a new concept, and indeed, its application is recorded in the scriptures [7].
The major effect of fibers occurs in the post-cracking state, when the fibers bridge across the cracks that have propogated in the matrix, thereby influencing the ultimate strength and deformation behavior of the SFRC composite, and its mode of failure.
Fibers generally result in a more uniform redistribution of stresses in the matrix, and so when these types of specimens are tested, it is generally observed that not only are the cracks smaller, more numerous, and at a closer spacing, but also spalling of the concrete is eliminated due to the ability of the fibers to hold parts of the concrete together in the post-cracking stages [8, 9] .
Fiber addition also results in an increase in the post-cracking stiffness of the concrete, when the stress-strain behavior begins to deviate from the pseudo-linear response [10].
In terms of the effect of fiber addition on the ultimate load capacity of fiber reinforced specimens, some researchers have noted an increase by as much as 30%
[9] , but the majority of reports have shown that fibers have no significant effect on
the shear strength of NC specimens [8, 12, 9] , although the first cracking strength does improve slightly, indicating an improvement in the tensile strength.
The post-peak ductility is also observed to notably increase on addition of fibers
Figure 2-3: Transition layer, containing calcium-hydroxide, around a fiber[7] during the pullout of the steel fibers from the matrix, resulting from the presence of a weak interface between fiber and matrix in normal concrete specimens, -due to the accumulation of a weak calcium-hydroxide layer(see Figure 2-3) at the interface [7].
It has also been observed that fibers also help to improve the contribution from
dowel action to shear resistance, making failures more ductile [11, 15] . This occurs
due to the ability of the fibers to maintain the integrity of the concrete to which the dowel forces are transferred, thereby preventing the degradation of this shear resisting mechanism.
As previously mentioned, there are primarily two transfer mechanisms responsible for shear transfer in beam specimens : beam action and arch action. However, as fibers do not significantly improve the compressive strength of NC specimens [16, 17] , the contribution of fibers to arch action is not as significant [12], and the main effectiveness
of fibers is in the beam mechanism ( for larger shear spans ) when the fibers help
bridge across the cracks which propagate in the matrix, and maintain the effectiveness of the dowel contribution.
10000 8000 Compressive Stress, 6000 4000 2000 0 0 5000 10000 15000 20000
Axial Strain, millionths
Figure 2-4: Improved post-peak ductility due to fiber addition[17]
2.3
Shear behavior of high strength fiber
rein-forced concrete beams
One of the directions in which the ACI suggested research into HSC be guided, was towards the incorporation of fibers in the material [18] .
Very limited research efforts have, however, been concentrated on this area of research, a brief summary of these findings being presented below.
2.3.1
General properties of high strength fiber reinforced
concrete
(
HSFRC
)
The results of tests carried out on the behavior of HSFRC specimens show that the use of fibers enables the post-peak behavior to be better investigated [16, 8], as opposed to plain HSC, where the cracks grow rapidly and unstably(Figure 2-4) .
in-creases the strain corresponding to the peak stress, and the inclusion of steel fibers provides further increase of this strain. While HSRFC reaches its peak stress at a compressive strain slightly higher than for lower strength concrete, the ultimate strain is lower for HSC. A value for ultimate strain of 0.003, specified by ACI com-mittee 318, could be less conservative for HSC. The presence of steel fibers would, however, increase this ultimate strain, thereby allowing HSFRC to withstand larger deformations before failure.
It was also found that if smooth fibers were used and the Vf increased, there was not a noticeable increase in f., but that if deformed or hooked end fibers were used, there was a noticeable increase, thus indicating that bond improvement helps bring about this change [19] .
Change in Vf was also found to be more significant for HSC than for NC, in terms of increased strength, as fibers tend to yield in HSC as opposed to simple pullout, due to the improved matrix-fiber interface properties resulting from the addition of silica fume and the reduction in water content ( silica reacts with the weak calcium-hydroxide to form a cementitious compound, and as calcium-calcium-hydroxide precipitation is initiated in areas of high water content, the reduced water content causes reduced precipitation ).
It was observed ( for V1 = 1.25%
)
that an increase inf,
of approximately 5 % wasobtained [20], and that the modulus of rupture was increased by 67-82 %, compared
with an increase for NC of 50-70 %.
The splitting tensile strengths were also higher than for NC with fibers, and 60 % higher than for plain HSC.
2.3.2
Behavior of plain high strength concrete beams in
shear
Results from investigations on the behavior of HSC beams in shear have shown that the failure mode is indeed very brittle [21]
P=5.04% p
aid=3
secondar ocal | A j:allure atr ilg- h , lea ds AV Iprimary =5 .04% aid a local allure a•t high loadFigure 2-5: Dependancy of failure mode on shear span ratio[21]
a/d > 2.5, failure was by diagonal tension(Figure 2-5) .
Nilson [22] stated that for high strength beams, aggregate interlock is the first
mechanism to break down, dowel action and shear in the compresion zone providing
the residual shear resisting mechanisms.
If the state of stress meets the failure criterion for the concrete in the
compres-sion zone, an abrupt and sometimes explosive failure occurs. If dowel resistance is
the controlling mechanism, vertical tension in the concrete around the bars causes
splitting cracks along the reinforcement.
Paulay [5] also provides information for NC which is relevant to HSC.
He postulates that at advanced stages of cracking, inclined cracks propagate
to-wards the compression zone and debilitate the cantilever action considerably, resulting
in large rotations at the free end, which may result in exhaustion of the dowel
ca-pacity. When dowel cracks form, a large proportion of the load, for NC, is taken by
aggregate interlock. A reduction in aggregate interlock forces due to some reason,
such as widening of cracks on one side of the cantilever mechanism, causes inbalance
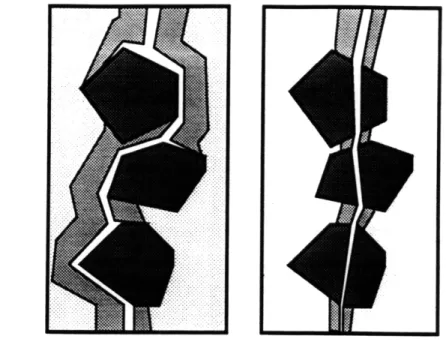
Figure 2-6: a)Crack propagation in NC b)Crack propagation in HSC
and further crack propagation, leading to diagonal tension failure, which is sudden. Hence, as for HSC the crack surface is smooth due to crack propagation through the aggregates(Figure 2-6), aggregate interlock forces are minimised and so failure may follow the aforementioned stages, ignoring the aggregate interlock stage.
It was also observed in previous studies that the reinforcement ratio ( p ) played
a significant role in controlling the type of shear failure.
This is because, not only of the contribution from dowel action to the shear resist-ing mechanism, but also because an important factor that affects the rate at which a flexural crack develops into an inclined one is the magnitude of stresses near the crack tip. The intensity of principle stresses above the flexural crack depends on the depth of penetration of the crack, and the greater the value of p, the less the
penetration of the flexural crack - The less the penetration of the flexural crack, the
less the principle stress for a given load, and consequently, the greater must be the shear force to cause the principle stresses that will result in diagonal tension cracking
increased moment at a section, and hence the increased possibility of flexural cracks with increased crack lengths. Hence, the possibility that these cracks would develop into diagonal cracks would increase, and consequently, it would be expected that for
increased a/d, the specimen shear capacity would decrease) .
2.3.3
Behavior of high strength fiber reinforced concrete
beams in shear
Review of Ashour
The results of this research indicated the same general relationships between the aid ,atio and the mode of failure previously discussed [21] .
The tests indicated a marked improvement in the post-peak behavior of the spec-imens, with a significant increase in the ductility. The effect of the fibers on beam ductility became more pronounced as the a/d ratio increased, and this suipports the idea [12] that the fibers are more effective in contributing to the beam transfer mech-anism, than to the arch mechanism.
Most significantly, the results confirmed those noted by Valle [8] , in that it was observed that the addition of fibers to the specimens caused a noticeable increase in the shear strength(Figure 2-7).
Two formulae (in MPa) were also proposed for the prediction of the shear capacity of HSFRC beams :
S= (0.7f + 7F)- + 17.2p (I)
a aand,
vU = (2.11r
+
7F)(pd)0.3 3 3 (II)a
(F = (l/d)Vfdf and d1 is the fiber effectiveness)
When compared with the results obtained by Shahbazker [24] (see Table 2.1 (units in psi)), it was, however, observed that these give extremely conservative predictions, for deep beams, and therefore are not satisfactory for practical applications.
see -ee 2eei 2310 1/ a .d C e 3 43 da 0a 7a Defecieo n at seassa in 4N 3 ... 4 e -as
Do, eisc an at asesan (as
Figure 2-7: Effect of V1 on shear capacity[23]
Vf vI(Shabaz.) Eqtn. I Eqtn. II
0
1271.1
721.6
758.0
0.4 1502.2 789.4 835.0 0.8 1608.9 895.6 942.2
Table 2.1: Application of eqtns. I and II to the specimens tested by Shahbazker
__ __ __
a
Examination of the results of this research, and the methods of analysis adopted by the authors, indicate that there are two main reasons for the conservative predictions of these proposed equations :
a) In considering the contribution from the fibers, fiber pull-out was considered as the dominant mechanism, though verification of this was not provided,
b) Even though flexural failure occurred in many of the specimens, the peak loads for these specimens was taken as the shear capacity of the specimens, and these results included in the linear regression analysis used to obtain the final design equations. Thus, as the results used for the situations where flexural failure occurred are conservative estimates of the shear capacity of the specimens, it would be expected that the equations derived would likewise be conservative.
Review of Shahbazker
The results of this research confirm many of the observations made by Ashour [23] and Valle [8, 40] .
Experiments were also performed in this program incorporating stirrups, and this was found to result in much greater improvements in ductility, as expected.
The results also seem to indicate that the contribution from fibers and stirrups to the peak shear stress is not additive, possibly due to a lack of correspondence of peak strains, the overestimate being of the order of 15 % if the contributions are added directly.
It should, however, be noted that tests were only performed for a single specimen
in each case ( as indeed were the tests performed by Ashour ) and therefore this
suggests that it would be useful to repeat several of these tests to confirm the actual quantitative results obtained.
Also, in using Bazant's equation (in psi) [25]:
v
=
10V [v + 3000 p/(a/d)]
1 + d/25da
ac-a/d V1 p v,(exper.) eqtn. I ve(Baz.'84) ve(s'baz.) 1 0.5 2.84 1318.1 1394.9 1399.0 1882.0 2 0.5 2.84 698.9 548.1 468.1 951.1
1 1.0 2.84
1847.3
1703.8
1394.0
2100.1
2 1.0 2.84 878.7 662.7 462.9 1169.1 2 1.0 4.58 975.9 765.6 604.8 1432.9Table 2.2: Application of Shahbazker's eqtn. to the results obtained by Ashour[23] tion perhaps underestimated, but also the equation has been assumed to not account for dowel action, which it does.
Examining Table 2.2, when the equation proposed by Shahbazker,
v = 10
r,,
[V
+3000 p/(a/d)
5
+ 70F]
1 + d/25da
where F = (1/d)V•V. 5 4 8d is applied to the results of Ashour [23] ( using only those
results in which shear failure was known to have occurred ), it can be seen that the
shear capacities of the sections are dramatically overestimated, suggesting the need for further modifications to the proposed equation. Modifications to this equation are discussed in this thesis
Chapter 3
Load-deformation predictions for
high-strength fiber reinforced
deep beams
In attempting to model the behavior of the beams in this program of study, it is essential to account for their deep nature, as this significantly effects the mode of shear transfer .
The model adopted in this study is based on the deep beam shear transfer model proposed by Hsu and Mau [27], as a review of the existing literature confirms the effectiveness of this model in accurately predicting the shear transfer response of specimens [8, 28, 29, 30]
The aim in utilising this model was to enable :
* the peak load capacity for HSFRC beams to be predicted, * the central span deflection behavior to be predicted, and
P } Qtc ,T.s = P f I ---- t C
---'
-L11C ~
vLIIIi$
rc--lc Crs z PftT
7
ReinforcedConcrete Concrete Reinforcement
I
Concrete
Figure 3-1: Truss model for reinforced concrete element [29]
3.1
Deep beam shear model
The deep beam shear model has developed from the softened truss approach ( which
relies on the ability to characterise the softening behavior of concrete ), and the
Modified Compression Field Theory [31, 32] .
The principle attraction of this model is that, in addition to not relying on the assumption of a pre-existing failure plane, it also introduces an effective transverse compression in the beam web, thus accounting for the arch transfer mechanism.
It is assumed that when the concrete cracks on application of load, the concrete struts so formed act in conjunction with the longitudinal and transverse reinforce-ment to form a truss-like mechanism (Figure 3-1) which resists the shear loading ( It should therefore be noted that for small loadings, when the concrete is uncracked, the predictions of this model will be inappropriate ) .
A key to the variables is provided below :
Crr 1•d
V.
sym.
t
½
T d'd dv
I I
V V
Figure 3-2: Deep beam stress condition[27]
a = normal stress
7 = shear stress
f
= stress in steelp = reinforcement ratio
a = the angle of inclination of the d axis with respect to the x axis (positive counterclockwise'
The subscripts z, y, d, and r correspond to the chosen axis .
Though no transverse reinforcement ( stirrups ) have been provided in this research program, the truss mechanism is still valid as it is expected that the fibers will be effective in performing the role of stirrups .
It is assumed that the moment in the concrete section is taken by the couple formed by the steel reinforcement and an equivalent depth of concrete d' ( where d'
= half the depth needed to provide a compressive force in concrete to balance the
The shear load is then resisted by the concrete depth d,, where :
d, = d - d'
Essentially the truss mechanism formed must satisfy the laws of compatibility and equilibrium, and the material laws .
3.1.1
Equilibrium equations
After cracking, the principle stress directions are denoted by d and r (compressive
and tensile respectively - see Figure 3-1) and the angle of inclination of the principle
axis, a .
Hence, using the Mohr's circle stress transformations, and assuming that the steel reinforcement can take only longitudinal stresses, the following equilibrium equations are obtained :
O, = ad Cos2 a +
-,
sin 2 a + (3.1)a, = ad sin2 a + , Cos2 a + pfI (3.2)
r7, = (ad - ar) sin a cos a (3.3)
( p, is the equivalent area of fiber steel across the shear plane and it should be noted that the fibers are considered to be only effective in the y-axis direction as the contribution to the x-axis direction is negligible compared to the area of longitudinal steel )
3.1.2
Compatibility equations
Again using the Mohr's circle stress transformations, and utilising the result from the Modified Compression Field Theory that the principle stress and strain inclinations correspond to the inclination of the concrete struts formed, the following equilibrium results are obtained :
ey = ed sin2 a + e, Cos2 a
(3.5)
^Ny = 2(Ed - e) sin a cos a
(3.6)
where :
ex, Cy = average normal strains in the x and y directions (tension positive), respectively,
7.y = average shear strain,
Ei, E, = average principle compressive and tensile strains respectively
3.1.3
Material laws
Steel reinforcementThe longitudinal bars, and the steel fibers, are assumed to demonstrate elastic-perfectly plastic stress-strain characteristics, as shown in Figure 3-3 (the high bond strength for steel fibers in HSC allows this assumption to be made for the fibers, even though in reality some fiber debonding will occur before the yield strength is
reached) .
f,
= E, , < fy (3.7)where E, and f, are the Young's Modulus and the yield stress of the steel rein-forcement respectively .
Concrete
The principle compressive stress-strain curve for HSFRC, which incorporates the softening effect due to the biaxial state of stress, is shown in Figure 3-4 :
The ascending portion is represented by :
rd = f[ 2(e ) - A(d)2 ] (3.8)
for Ed Ep,
and is the same as for NC, as there is essentially no sigificant change when fibers are added .
Figure 3-3: Stress-strain relationship for steel
fc.
0
Ed
Er x10"3)
Figure 3-5: Tensile stress-strain relationship for concrete For the descending portion :
L
((3.9)
CO=)2 ifor Ed _> EP
where E, = Eo/A, and lambda is a coefficient to account for the softening
phe-nomenon, where :
A = /0.7- (3.10)
Ed
This is again the same relation as used for NC because, due to the addition of fibers, it is expected that the post-peak behavior for HSC would be improved only to the extent that the ductility would be comparable to that for NC .
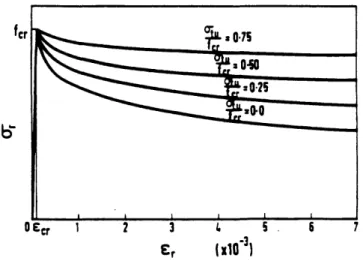
The assumed principle tensile stress-strain relation was also taken to consist of two portions : a pre- and a post-cracking behavior (Figure 3-5) :
Before cracking, the ascending portion is given by :
(, = eE,
(3.11)
for E,. •c,
where Ec is the Young's Modulus of concrete and ec, is the cracking strain of fiber concrete,
f, = 7.5 /
Ec = 40000VI + 1.0 x 10⁶
ACI 363[35] notes that for, curing conditions followed by air drying, the use of 7.5Vff is probably fairly close to the full strength range for high strength concrete .
The post-cracking behavior is given by :
fc. +
(ptu)
(312)
r, = (3.12)
1+3
=
0
050
(3.13)for E, > fce
This post-cracking behavior occurs because, after cracking, the stress across the
cracks is still quite significant due to the presence of fibers . This stress across the
cracks is denoted by ate, where,
t 771 7
7%
V
l
7,r2r'
r' is the ratio of the area of cross section to the perimeter of the fiber .
The ultimate bond strength of the fibers, r,, has been calculated to be the bond stress at yielding of the fibers, to account for the higher bond properties of HSC .
3.1.4
Simplifying assumptions
At this stage, there exist 14 unknowns but only 11 equations, and therefore it is necessary to make several simplifying assumptions to enable a solution to be obtained.
As the depth d. is assumed not to carry any flexure, then it can be assumed that :
Y= 0
Also, Hsu and Mau [29] have shown that :
at = Kr
where K is the ratio of maximum transverse stress to maximum shear stress, and is given by :
d, h 4 2 a
h a 3 3 h
for 0.5 < a/h < 2
This value takes into account the variation in the distribution of the stresses within the shear span, when the magnitude of the shear span is varied, as shown in Figure 3-6 .
Hence, making these two assumptions, for a given value of Ed ( chosen because it
is expected to increase monotonically), the 14 unknowns can be obtained, as outlined in Section 3.1.6 .
3.1.5
Modifications to existing shear model
Dowel contribution
As the proposed model by Hsu [29] does not account for the dowel contribution from the longitudinal steel, and does not account for aggregate interlock, it is necessary to modify the modify the model to attain a higher degree of accuracy .
For HSC, when cracks propagate, they generally pass through the aggregate, as
a 4 a h/2 '/ \- ,, Distribution / of Transverse Compression -j, h/2 , / h/2 .. - Isostatic Compressive / I -S / Curve (b) a/h = 0.25 (c) a/h = 0.5 a=h 8 - , h I i~- / a = 2h /
(d) a/h = 1 (e) a/h = 2
Figure 3-6: Distribution of compressive stresses for different values of a/d[27] smooth as there are no protruding aggregate particles .
Thus, aggregate interlock shear transfer is nominal [35], and so will be ignored in this study.
It is, however, expected that the dowel contribution will be an important shear transfer process as the area of longitudinal steel is quite high, and so will be incorpo-rated in this model.
The formulation [33] used to calculate the dowel contribution is based on the 'beam on elastic foundation theory' (Figure 3-7) .
Failure, in this model, is assumed to occur when a plastic hinge is developed at the section of maximum moment in the bar, by which point a crushed zone of length
c has developed from the crack face under the longitudinal bars .
It should be noted that this approach has been developed for typical beam-column joints, as shown in Figure 3-8, but is nevertheless valid for this experimental study,
as at failure the shear crack propagates close to the support, which in turn performs
the function of the column ( Figure 3-9 ) .
PLASTIC fINwE
f~
%
BEARINC. STRESS : BENOD '4 41t:NTFigure 3-7: Dowel action idealization: (a)dowel bar, (b) beam on an elastic foundation model, (c)failure condition[33]
dowel action at beam-col. joint
Figure 3-8: Dowel action at beam-column joint[33]
DU
T
dowel action of bars
support
Figure 3-9: Dowel action at beam support
The theory would not therefore be as appropriate for cracks developed away from the supports of a beam .
Taking moment equilibrium about the plastic hinge (see Figure 3-7) results in the following expression for the ultimate dowel contribution :
DU
=
0.5
fb
(0.37
-
db
- c)
2+ 0.45
f,
d2 (1 - T /TI)/T
where fb, the bearing strength of the concrete underneath the dowel bar, is given by :
fb = 154
fl/
dbdb = dowel bar diameter,
Kf = concrete foundation modulus (1 x 10⁶psi),
7 = E, /Kfdb,
T = dowel bar axial force,
T, = dowel bar yield axial force
It is then necessary to use emperical relations in order to calculate the dowel load for a given shear displacement .
The deflection at ultimate load is given by:
S, = 4.26 x 10- 6 D, + 0.00945
and the load D for a given deflection S, is given by :
D= D.• S/ (3.14)
for S < Su, and:
S-S,
D = D, - D, 0.4 - 0.4D0 (3.15)
0.4/db - Su
for S Su
Flexural deflections
By virtual work, the central deflection of the beam is given by : 601.6 P
6
Eclewhere P is the load applied at each of the four load points (Figure 3-10), and Ie, the effective moment of inertia, is given by :
Me)3 M[
-P.a -P.a
a) Beding moment diagram b) Shear force diagram
a) Bending moment diagram b) Shear force diagram
Figure 3-10: (a)
Bending moment diagram (b)
Shear force diagram
Mc, = moment at first cracking,
Ma = applied moment at the section,
Ig = gross moment of inertia of the section,
I, = moment of inertia of the cracked transformed section
It should be noted that the stiffening effect of the fibers has not been included in the calculation of I, and therefore the predicted deflections are expected to be higher than the practical values obtained, for larger loads, when the fibers are effective in bridging the cracks which are developing .
The model used in this study therefore differs from the one used by Valle[8] in that the greater shear span ratio used has led to the inclusion of a term to account for the variation in stress within the shear span .
Also, this model includes a contribution from dowel action , as a much greater
predicted, as opposed to shear strains in the study by Valle .
In addition, for the contribution from the fibers in the material laws, alternative expressions have been used in some cases in order to try to improve the predictions of peak strength, which in the case of Valle's work, tended to be overpredicted slightly
. The fibers have also been taken as having a contributing effect to the transverse
steel, and thereby effecting an increase in the shear strength of the beams
3.1.6
Solution procedure
It is necessary to use an iterative procedure in order to solve for the required un-knowns, and this iterative procedure is outlined below :
1. Choose avalue of ed,
2. Assume a value for e,,
3. Find ad and c-, from the stress-strain relations,
4. Solve for a from eqtn. ,
5. Solve for the updated value of a, from the equilibrium eqtns.,
6. Compare the values of a, calculated from steps 3 and 5; if there is a significant difference, repeat steps 2-6,
7. Calculate the other desired unknowns - for this case r,, and y, .
A simple flow chart may be used to illustrate the solution procedure, as shown in Figure 3-11 .
Hence, in this manner, for different values of ed, the shear behavior of the beam
can be traced .
The shear deflection of the beam can then be calculated,
eed
Figure 3-11: Flow chart illustrating model solution procedure 42
and consequently, from eqtns. 3.14 and 3.15, the dowel contribution is obtained, enabling the total load acting on the specimen to be calculated :
Total load = r7,, d b + D
Finally, the overall deflection is simply the sum of the flexural and shear deflec-tions,
ST = S, + 6f ,
and hence the overall load-deflection behavior is obtained
A computer program to perform these operations was written in the 'C'
Chapter 4
Experimental work
4.1
Scope
The variables investigated in this program were :
1. Vf of fibers,
2. 1/d ratio of fibers,
3. a/d ratio of the specimens, 4. size effect of the aggregate, 5. fiber effectiveness .
A total of 22 laboratory size specimens were cast, and the compressive strength developed was approximately 10 000 psi .
In the remainder of this thesis, the following key will be used to represent the specimens :
Vf - (a/d) - (lf/d) - d,
where da = maximum aggregate size, and the other terms are as defined previously . A summary of the specimen types is provided in Table 4.1 .
Specimen Specimen type No. cast al 0.0-1.46-28.1-0.375 2 a2 0.4-1.46-28.1-0.375 3 a3 0.8-1.46-28.1-0.375 3 a4 1.2-1.46-28.1-0.375 2 bl 0.8-0.93-28.1-0.375 2 b2 0.8-1.73-28.1-0.375 2 cl 0.8-1.46-61.5-0.375 2 c2 0.8-1.46-50.0-0.375 2 dl 0.8-1.46-28.1-0.250 2 d2 0.8-1.46-28.1-0.090 2
Table 4.1: Specimen types investigated
4.2
Tests specimens
Figure 4-1 indicates the dimensions of the beams which have been used in this
inves-tigation .
The formwork used allowed two beams to be cast simultaneously, and was made from plexiglass (Figure 4-1)
Only tension steel was provided (See Section 4.3), and this consisted of 2 No. 5 and 1 No. 4 bars.
Stirrups were provided outside of the loaded span(Figure 4-1) in order to maintain the rebars in the correct location with the appropriate nominal cover requirement .
They therefore played no part in the shear transfer process, as it was felt necessary to first try to understand, and predict, the behavior of specimens without transverse reinforcement .
7
' 03
30
Section A-A
stirrup outside shear span
Notes :
a) All dimensions in inches b) Drawings not to scale c) Cover to main reinforcement
equals 0.44"
Side elevation
Sectional drawings
Bar No. Size Length
1 5 20 2 4 20
/
I\1
VZW
Figure 4-1:/.
S.v ,4.3
Design of HSFRC beams
4.3.1
Flexural analysis
The first stage in the flexural design of the beams, is the calculation of the balanced steel ratio, Pb :
Effective section size = 3" x 3.75"
As = (7r/4) [2 (5/8)2 + (4/8)2)] = 0.810 in.2 0.810 3 x 3.75 So, 10000 0.003 E, Pb = 0.65 x 0.85 x - x = 0.0708 60000 0.003 E, +
f,
Hence, as the beams are over-reinforced, only the balanced steel ratio will be used in the flexural calculations .
It is also advisable to provide this additional steel, because shear stresses will cause longitudinal stresses to develop in the steel, and so part of the steel area provided will not be available to resist flexure .
For the principle fibers used in this study, of square cross section,
fiber length, lj = 1" breadth = 0.045"
depth = 0.011"
Therefore, the effective diameter of the fiber, df, may be calculated :
r x df = 2 x (0.045 + 0.011)
hence,
df(effective) = 0.0357
and,
Ifl/df = 1/0.0357 = 28.1
Assumed
Beam Stress Strain
Section Distribution Diagram
b
0o.s85
o.oo0
I 1 C --- 4
--TI
rLT.I
F{
•* ..- _.-.. •; ..."...h NeutralAxIS
i
Ixi
1j jI A strain in rebarsT2 - tension in librous concrete
Figure 4-2: Stress-strain diagrams for beam cross-section[24] of the beams .
The flexural capacity of a normal fiber reinforced beam is given by [17, 34] :
a h e a
M, = A,.f, (d - 2) + .b (
2 2
where aft is the tensile strength of the fiber concrete, and is given by :
at = 0.41 x 0.82 x rd (1Ild) V1 Fb,
where Fbe is the fiber efficiency factor, taken as 1.2 for crimped fibers, and rd is the
dynamic bond stress of the fibers .
This equation has also been assumed to be valid for HSC [35], the improved bond strength being accounted for in the value of rd used (600 psi) .
Now :
((e±+ 0.003) 0.003
where ef is the strain in the fiber. Hence,
(g + 0.003)
0.003
ao is the tensile stress in the fibers during pullout (for normal concrete), and is
obtained by equating the tensile stress in the fibers to the bond stress :
Td
Fbe
if (bf +
wf)
S=w=
(Note that the fibers are of square cross section, the dimensions being given by w1
and bf .)
This value is independent of the volume fraction of the fibers and may be calcu-lated at this stage :
600 x 1.2 x 1 x (0.045 + 0.011)
0.045 x 0.011
As the yield strength of the fibers is 60 000 psi, then the above result would tend to indicate that the fibers will actually yield before pull-out occurs .
Thus af = 60 000 psi. Now, _ 60 000 e -- 2.069 x 10- 3 E, 29 x 106 therefore, 0.002069 + 0.003 e = c = 1.69 c 0.003 but a = 0.65 c, so : e = 2.60 a
The value of a (see Figure 4-2) is determined by equating the compression in the concrete section to the tension, and the resulting expression may be expressed as :
A, f, + aft b h
Specimen Moment capacity(lb in) Total load(kips) 0.0-1.46-28.1-0.375 134374 48.80 0.4-1.46-28.1-0.375 134918 49.06 0.8-1.46-28.1-0.375 135224 49.16 1.2-1.46-28.1-0.375 135529 51.28 0.8-0.93-28.1-0.375 135224 77.27 0.8-1.73-28.1-0.375 135224 41.60 0.8-1.46-61.5-0.375 135952 49.44 0.8-1.46-50.0-0.375 135339 49.21 0.8-1.46-28.1-0.250 135224 49.16 0.8-1.46-28.1-0.090 135224 49.16
Table 4.2: Summary of flexural calculations
The flexural capacity may then be determined using the aforementioned expression for M,, and consequently the ultimate load capacity obtained .
A summary of the results of the calculations for the different specimen types is provided in Table 4.2
4.3.2
Shear strength estimation
As the shear capacity of the members is the focus of this study, it is essential that the shear capacity be less than the flexural capacity of the members .
Even though the formula proposed by Shahbazker [24] needs further modification, it is nevertheless used to obtain an estimate of the shear capacity of the members.
V= 10" [-/ + 3000 p/(a/d)5 + 70 F]
1 + d/25da
and, VU = Ve + Vd where : vd ~ 0.25 v,pre-Specimen Vc (Ibs) V, (lbs) Total load (Ibs) 0.0-1.46-28.1-0.375 16.12 21.49 42.98 0.4-1.46-28.1-0.375 18.94 25.25 50.50 0.8-1.46-28.1-0.375 20.24 26.99 53.98 1.2-1.46-28.1-0.375 21.26 28.34 56.68 0.8-0.93-28.1-0.375 45.69 60.92 121.84 0.8-1.73-28.1-0.375 16.03 21.37 42.74 0.8-1.46-61.5-0.375 25.13 33.51 67.02 0.8-1.46-50.0-0.375 21.01 28.01 56.02 0.8-1.46-28.1-0.250 18.93 25.24 50.48 0.8-1.46-28.1-0.090 14.67 19.56 39.12
Table 4.3: Estimated shear capacities sented in Table 4.3 (all loads in kips):
Hence, it is expected that shear failure will occur before flexural failure for the specimens under investigation as the flexural calculations are very conservative .
4.4
Batch design and material selection
The materials used in the experimental program are outlined below :
* Type I Portland Cement, * Fine aggregate ( mortar sand ),
* Coarse aggregate ( pea gravel - 3/8"max. size ),
* Condensed silica fume ( Force 10 000 - 50% water by weight ) to enable a
stronger between fiber and matrix and a satisfactorily high strength to be ob-tained,
* Superplasticizer ( WRDA-19, ASTM C-494, type A & F ), used to increase the
workability of the mix with no loss in strength,
I/d = 28.1 I/d = 50.0 li/d = 61.5
Figure 4-3: Fiber types used 1. deformed fibers, lid = 28.1,1" x 0.011" x 0.044", 2. hooked end fibers, Ild = 61.5, 1.2" x 0 = 0.0195", 3. straigth fibers, l/d = 50.0, 1" x 0.022" x 0.01" .
The mixing proportions used to prepare the specimens are given in Table 4.4 , the mix being designed to obtain a strength of 10 000 psi at 28 days .
The quantities used in a typical mixing operation are provided below in Table 4.5
Variable Proportions sand/cement 2.0 gravel/cement 2.0 silica 10% superplasticiser 3% water/(cement + silica) 0.36
Material Quantity (lbs) cement 13 sand 26 gravel 26 silica fume 2.6 water 3.9 superplasticiser 0.39 fibers 1.75
Table 4.5: Quantities used in typical casting operation
4.5
Preparation and casting of specimens
The rebars were first assembled into a reinforcing cage utilising stirrups (outside the shear span), and these were all held together with steel wire .
The plexiglass formwork was then coated with bondbreaker, and the reinforcing cages placed inside the formwork .
The concrete was then prepared following the procedure outlined below :
1. The sand, cement and gravel were placed in a rotating-drum mixer(Figure 4-4) and mixed for 30 seconds,
2. At this stage, the water, silica fume and superplasticizer (which had all been previously mixed together) were then gradually added to the mixer,
3. If fibers were used, these were 'sprinkled' into the mixer, ensuring that they did not ball together as they were added,
4. The mixing was then discontinued 5 minutes after step 2 had been completed. The concrete was then placed in the formwork and, in addition, 4 test cylinders were cast.
The concrete was cast according to ACI code requirements [36, 37] and the spec-imens were then vibrated for 3 minutes .
Figure 4-4: Laboratory cement mixer
hours in order to allow setting of the concrete to occur . They were then demoulded and cured in water for 28 days [35]
4.6
Testing procedure
A 200 kip capacity 'Baldwin Testing Machine' was used for all the tests performed in this experimental program, and the signals from this machine were recorded using
an IBM AT computer (see Figure 4-5) .
4.6.1
Compression and splitting tensile tests
Of the four cylinders prepared during each casting sequence, two were used for for compression tests, and two for splitting tensile tests
Prior to testing, the cylinders for the compression tests were capped using hy-drostone, in order to ensure an even contact surface with the loading platens of the testing machine (Figure 4-6).
![Figure 2-4: Improved post-peak ductility due to fiber addition[17]](https://thumb-eu.123doks.com/thumbv2/123doknet/14150265.471728/19.918.146.716.132.456/figure-improved-post-peak-ductility-fiber-addition.webp)
![Figure 3-1: Truss model for reinforced concrete element [29]](https://thumb-eu.123doks.com/thumbv2/123doknet/14150265.471728/28.918.252.622.82.403/figure-truss-model-reinforced-concrete-element.webp)

![Figure 3-6: Distribution of compressive stresses for different values of a/d[27]](https://thumb-eu.123doks.com/thumbv2/123doknet/14150265.471728/36.918.106.731.105.527/figure-distribution-compressive-stresses-different-values-d.webp)
![Figure 3-7: Dowel action idealization: (a)dowel bar, (b) beam on an elastic foundation model, (c)failure condition[33]](https://thumb-eu.123doks.com/thumbv2/123doknet/14150265.471728/37.918.244.661.106.471/figure-dowel-action-idealization-elastic-foundation-failure-condition.webp)

![Figure 4-2: Stress-strain diagrams for beam cross-section[24]](https://thumb-eu.123doks.com/thumbv2/123doknet/14150265.471728/48.918.208.674.205.440/figure-stress-strain-diagrams-beam-cross-section.webp)

