Publisher’s version / Version de l'éditeur:
Cold Regions Science and Technology, 8, pp. 25-33, 1983
READ THESE TERMS AND CONDITIONS CAREFULLY BEFORE USING THIS WEBSITE. https://nrc-publications.canada.ca/eng/copyright
Vous avez des questions? Nous pouvons vous aider. Pour communiquer directement avec un auteur, consultez la première page de la revue dans laquelle son article a été publié afin de trouver ses coordonnées. Si vous n’arrivez pas à les repérer, communiquez avec nous à PublicationsArchive-ArchivesPublications@nrc-cnrc.gc.ca.
Questions? Contact the NRC Publications Archive team at
PublicationsArchive-ArchivesPublications@nrc-cnrc.gc.ca. If you wish to email the authors directly, please see the first page of the publication for their contact information.
NRC Publications Archive
Archives des publications du CNRC
This publication could be one of several versions: author’s original, accepted manuscript or the publisher’s version. / La version de cette publication peut être l’une des suivantes : la version prépublication de l’auteur, la version acceptée du manuscrit ou la version de l’éditeur.
Access and use of this website and the material on it are subject to the Terms and Conditions set forth at
Creep model of ice for monotonically increasing stress
Sinha, N. K.
https://publications-cnrc.canada.ca/fra/droits
L’accès à ce site Web et l’utilisation de son contenu sont assujettis aux conditions présentées dans le site LISEZ CES CONDITIONS ATTENTIVEMENT AVANT D’UTILISER CE SITE WEB.
NRC Publications Record / Notice d'Archives des publications de CNRC:
https://nrc-publications.canada.ca/eng/view/object/?id=33c343ca-fc70-41a3-9977-58b5e552dd26 https://publications-cnrc.canada.ca/fra/voir/objet/?id=33c343ca-fc70-41a3-9977-58b5e552dd260 .
1145
National Research
Conseil national
Council Canada
de recherches Canada
1
BLDG
ICREEP MODEL OF ICE FOR MONOTONICALLY INCREASING STRESS
I
byN.K. Sinha
Reprinted from
Cold Regions Science and Technology,
Vol. 8 (1983)
p. 25
-
33
DBR Paper No. 1145
Division of Building Research
Une mgthode d ' i n t s g r a t i o n numgrique pour p r a i r e l e s p r o f i l s d e ddformation correspondant
B
d e s c o n t r a i n t e s prolong'ees e t B t a b l i r p a r l a s u i t e l a r e l a t i o n c o n t r a i n t e d B f o r m a t i o n , a s t 6 mise au p o i n t pour d e s mat'eriaux p o l y c r i s t a l l i n s comme l a g l a c e ,a
de h a u t e s temp'eratures hornologues.La
m6thode e s t b a s h s u r une g q u a t i o n g6n6ralis'ee du f l u a g e i n c o r p o r a n t l ' e f f e t d e l a dimension d e s g r a i n s .On
p e u t a i n s i pr'evoir l e sddf ormations B l a s t i q u e s , Q l a s t i q u e s retard'ees, visqueuses e t permanentes. La th'eorie a
B t Q
i5prouv'ee avec s u c c k l o r s d ' e s s a i s de r s s i s t a n c e d e l a g l a c e3
d e s t e m p h a t u r e s v a r i a n t e n t r e-5
e t-30°C.
L'augmentation monotone du t a u x de dBformation observ'ee d u r a n t les e s s a i s3
une v i t e s s e c o n s t a n t e d ' a p p l i c a t i o n d e l a c o n t r a i n t e p e u t maintenant a t r e expliqu'ee analytiquement.Cold Regions Science and Technology, 8 (1983) 25-33
Elsevier Science Publishers B.V., Amsterdam - Printed in The Netherlands
CREEP MODEL OF ICE FOR MONOTONICALLY INCREASING STRESS N.K. Sinha
Geotechnical Section, Division of Building Research, National Research Council Cenada, Ottawa K I A OR6 (Canada)
(Received March 23, 1982; accepted in revised form September 22, 1982)
ABSTRACT
A numerical integration method of predicting the strain path corresponding to a given stress history, and hence the stress-strain relation, has been devel- oped for polycrystalline materials like ice at high homologous temperatures. The method is based on a generalized creep equation incoporating the grain size effect and predicts strain in terms of elastic, delayedelastic, and viscous or permanent strains. The theory has been tested successfilly during strength tests of ice in the temperature range of -5 to - 3 0 ' ~ . The monotonous increase in strain rate observed during testing under conditions o f constant cross-head displacement rate can now be explained analytically.
INTRODUCTION
The development of a phenomenological, non- linear, viscoelastic equation for polycrystalline ice of a given grain size has made it possible to explain, in a general way, inconsistencies in the results of earlier creep investigations of ice (Sinha, 1978a, b). The model was modified analytically to incorporate the effect of grain size, and a generalized consti- tutive equation was developed by comparing the creep response of ice with that of metals, alloys and other polycrystalline materials at high homologous temperatures (Sinha, 1979a). This allowed several other peculiarities of the creep behaviour of ice to be clarified (Sinha, 1979b).
It is the main purpose of the present paper to present the principles involved in utilizing the general- ized creep equation for predicting high temperature
response of polycrystalline materials such as ice sub- jected to loading conditions of variable stress. The meaning of "ice-like" will be clarified. Experimental results obtained during strength testing (Sinha, 1981) of columnar-grained ice have been used to test the theory.
The author earlier demonstrated that specimen strain rates were not constant during tests under constant cross-head rates (Sinha, 1981) and that consequently the strengths and stress-strain results were not representative of truly constant strain rate conditions; this investigation refuted the popular assumption of a constant strain rate correspond- ing to a constant cross-head displacement rate. The secondary purpose of the present paper is t o establish whether the experimental observations can be described analytically or not.
Generalized viscoelastic equation
Creep deformation in polycrystalline materials at high temperatures can be expressed generally by
where E, is the pure elastic deformation, ed is the recoverable, delayed elastic strain, and E, is the
viscous or permanent deformation. The term "vis- cous" will be used in a general sense to describe flow leading to permanent deformation. The term "plastic" is avoided here because it is commonly used to lump permanent and delayed elastic deformation.
For conditions where grain boundary diffusional processes do not play a dominating role and where the microstructure has not deteriorated by the for-
and due to o2 applied at t = f l (Fig. 1). Thus
Following the second term of eqn. (2), with s = 1,
this reduces to
(c) Viscous strain, according to the third term in eqn. (2), is stress- and timedependent, but strain rate is independent of time under constant stress. This type of flow under the present loading condi- tions, considered at t
>
t l , will therefore be given as the sum of the strain (Fig. 1) produced by olapplied for t l and the strain produced by o l
+
02applied for times greater than t l . It can be stated mathematically as
This gives, according to the third term in eqn. (2),
The total deformation will be the sum of the com- ponents given by eqns. (6b), (7b) and (8b) as shown in Fig. 1.
It must be noted that the principle enunciated in this analysis of delayed elasticity is applicable only for the class of polycrystalline material that exhibits
linear stress dependency (s = 1) in its delayed elastic
TABLE 1
Creep parameters for ice obtained independently from earlier creep experiments and analyses (Sinha 1978a. 1979a)
response. Material constants determined for ice
(Sinha, 1978a, b) and given in Table 1 indicates that
ice belongs to this class of material. As these prin- ciples will be applied next to the case of varying stress, the following analyses are applicable to "ice- like" materials.
Variable stress loading
Most strength tests are performed by increasing the stress until failure occurs. The usual continuous stress path can be presented in terms of a stepped stress path in the fashion of a series of creep loadings at equal intervals of time, At. Suppose Aol, Ao;,
.
..
, AUN, AUN+ 1 are the incremental increases instress corresponding to times 0, At, 2At, .
.
. ,
(N-l)At, NAt such that Aol represents the average
stress in the first interval of time, and Aol
+
Aaz inthe second interval, etc.
The stress step Aol applied at t = 0 will produce
an instantaneous elastic strain of Aol/E at t = 0' and
contributions from delayed elastic and viscous flow will be negligible. In accordance with the principles of (a), (b) and (c),
At the beginning of the second interval of time, t = l ~ t ' , there will be elastic strain due to total stress
of Ao,
+
Aa,. Delayed elastic strain will be the strainproduced by Aol applied for 1At; there will be negligible contribution at this time from Ao2 because this stress applied for 0' time introduces negligible delayed elastic strain. Viscous strain at this time will be the contribution of AD, applied for At with
no, or negligible, contribution from Aol
+
Ao2. Thus,at t = l ~ t '
~d = c1
- -
(1-
exp [--(aT l ~ t ) ~ ] )+0'(10b)(:)(:')
These methods of analysis can be applied for any other times. In general, the elastic components at
t = N A ~ + arc given by
The corresponding delayed elastic strain is given as
and the viscous strain by
The total strain will be given by the summation of
the components (1 la), (I lb) and (1 lc). Actual
loading conditions of continuous increase in load with time will be approached as At is decreased and therefore N is increased.
CONSTANT STRESS RATE
In the special case where stress rate is constant at 6 , equal intervals of time, At, result in equal stress steps
and the stress at the end of the Nth period of time is
a = NAo = NdAt (13)
Correspondingly, the elastic strain for t = NAt'
NAo
E, =
-
E
The average stress in the first interval will be Ao/2 and consequently that in the Nth interval will be
(N - %)AD. It is, however, simple to replace Aoi in
eqn. (1 lb) by Ao to get
This does not introduce any significant error in the calculations if N is large (as will be illustrated later). Similarly, eqn. (1 lc) gives
The elastic strain of eqn. (14a) in its integral form
can simply be given as
where o corresponds to the loading o f t = 016.
A simple closed-form integral solution appropriate to eqn. (14b) for the delayed elastic term has not been obtained so far, and calculations have to be made by the numerical integration method. Delayed
elastic strain, ed
,
at any time given by this equation,however, rapidly converges as At is decreased and
thereby makes the calculations relatively simple. This will be clarified later.
The viscous term, eqn. (14c), can be integrated by substituting do16 for At and a for iAo, and in- tegrating over the stress range of zero to the final stress, giving
Equations (15a) and (15b) can now be combined with eqn. (14b) for slightly better computed results, for a given At value chosen to calculate the delayed elastic strain, than the combination of eqns. (14a), (14b) and (14c).
EXPERIMENT
A conventional screwdriven test machine capable of delivering constant displacement rates was used to investigate the rate sensitivity of uniaxial strength of columnar-grained, S-2 ice of average cross-sectional grain diameter of 4 to 5 mm at - l o O c (Sinha, 1981). It was observed that the specimen strain rates were far from constant during the tests for a given nominal
strain rate,
tn
= i l l , corresponding to a cross-headrate i and specimen length I .
In spite of the observed constancy in cross-head displacement rates, strain rates in the specimens monotonously increased with time and approached the nominal strain rate only after reaching maximum stress for upper-yield type of failure. The initial strain rates were about an order of magnitude less than the subsequent maximum strain rate. The peak strain rate
in the specimen, Cp, estimated from a narrow range
S T R A I N . < 10.' 5IHL55 H A l I - I H ~ I O ~ M N ~ ~ ~ ' , ~
.
' ' ~ * - * " ' - ' Y *-
I 0 cn/
-
HISTORY 'J 10 20 30 4 0 5 0 6 0 70 80 90 0 T I M E I rFig. 2. Stress and strain history and stress-strain results on columnargrained ice o f average grain diameter of 4.5 rnrn
at --10°C for nominal strain rate o f 5 X 10 $ s - ' .
of strain-time data near yield point or after maxi- mum stress was reached, compared well with the
corresponding e n . These observations indicated that
the testing machine was able to impose the specified deformation rate on the specimen only when the specimen offered no more increase in resistance with further increase in deformation. The results, therefore, could not be construed (Sinha, 1981) as constant strain rate, although this is customarily assumed.
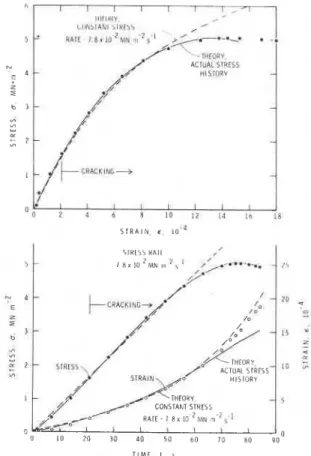
Analysis showed that the actual loading history comprised a nearly constant stress rate up to about 90% of yield stress, followed thereafter by a path
leading to a constant strain rate. An example of such
a test result is shown in Fig. 2, which gives stress
and strain history as well as the stress-strain diagram
for an imposed nominal strain rate of 5 X lo-' s-'.
In this case a constant stress rate of 7.8 X 10⁻² MN
,-z s-l describes the load path up to about 90%
of the maximum stress.
COMPARISON WITH THEORY
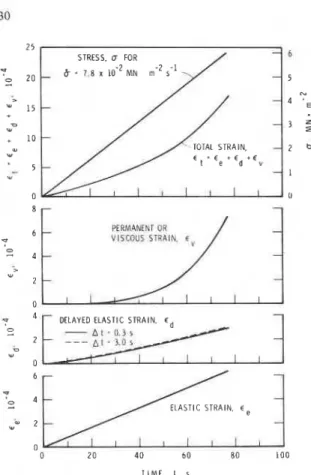
Computations using eqns. (15a) and (1 5b) for the elastic and viscous strains, respectively, and eqn. (14b) for delayed elastic strain for a constant stress
rate of 7.8 X 10-%N rn-' s-' are shown in Fig. 3.
Rapid convergence in the calculated delayedelastic strain with decrease in At is also shown. A solid line
for the delayedelastic strain was calculated using At =
0 3 s in eqn. (14b), whereas the broken line shows the
results for At = 3 s. Calculations were made using
the experimentally obtained average grain diameter
(Sinha, 1981), d = 4.5 mm, T = 263 K , and previous-
ly determined creep parameters (Sinha, 1978a;
1979a) given in Table 1.
These theoretical results for total strain are com-
pared with experimental observations in Fig. 2. As
stress rate deviated (significantly) from the constant
rate above a stress of about 4.5 MN m-2, or beyond
a loading time of about 60 s, theoretical results should not be applied beyond these stress or time limits. Figure 2 shows excellent agreement between theory and experiment within these stress and time limits. Beyond about 60 s the good agreement is only apparent, as may be seen when the theoretical stress-strain curve is compared with the experimental one.
2 5 STRESS. u FOR
-
6a
Z o-
b = 7 , 8 x 10" MN rn-2 8-1-
5 TOTAL STRAIN.-
2 b € = € + € + € t e d v-
Ir
DELAYED ELASTIC STRAIN, c,1
0 2 0 4 0 60 80 LOO
T I M E . I . 8
Fig. 3. Theoretical elastic, delayedelastic, viscous strains and hence total strain for a loading condition o f constant stress rate o f 7.8 X 10⁻² M N m-l s-I for ice with average grain diameter of 4.5 mm at -lO°C.
The time dependence of strain calculated from the actual stress history for the example under con- sideration is also shown in Fig. 2. Computations were made using eqns. (1 la), (1 lb) and (1 lc), Table
1, and measured stress steps at At = 1 s, keeping grain
size the same as before. The results show better agree- ment with the overall experimental observations than do the previous calculations. This is particularly noticeable in the stress-strain diagram. The time dependence of the strain shows, however, increasing
deviation in the latter calculatjon. This failure to
predict the proper time dependence of the strain, as the test progresses towards yield, indicates that the
theory is no longer applicable - probably because
of breakdown of the structure as a result of forma- tion of cracks.
The basic constitutive eqn. (2) does not take into account the contribution of microcracking to total strain. The present theory is expected to predict
less than the actual strain if cracking occurs. Internal cracks started to develop in the illustrated case at a loading time of about 21 s, or at a stress level of 1.6 MN m-2 (Fig. 2). Examination of the specimen after unloading at 84 s disclosed 470 long narrow
cracks in the central 10 X 10 cm area of the 5 X 10 X
25 cm specimen. These cracks were about 0.5 to 5 mm wide, 5 mm or more in length, and fractions of
1 mm in thickness. They occurred mainly at grain
boundaries (Sinha, 1981) and many were as long as the length of the columnar grains. It was realized that systematic studies of the formation of cracks and their influence on rheological response is re- quired for further improvement of the theory. In spite of these limitations the theoretical strain of
13.6 X lo4, predicted at an upper yield point of
5.04 MN m-2 reached at 77 s, is only about 10%
less than the corresponding experimental strain of
15.2 X lo4. Moreover, the theoretical (1.8 X lo-'
s-') and experimental (2.0 X lo-' s-') average strain
rates to peak stress are in reasonable agreement, although both are quite different from the nominal
strain rate of 5 X lo-' s-'. This example shows that
the agreement between theory and experiment is acceptable even for conditions of relatively severe
cracking activity
*.
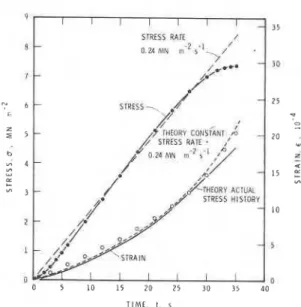
Further comparisons of theory and experiment are shown in Figs. 4 and 5 for tests conducted at
tn
= 1.3 X l o 4 s-' and 5 X 10-'s-', respectively.The rates are different from the loading rate used in Fig. 2 and as a result cracking activity also varied greatly. In the former, 700 cracks were counted
in the central 10 X 10 cm area after unloading, com-
pared with about 70 in the latter. The examples in support of the theory are only three of several ex- periments carried out during the test program re- ported by Sinha (1981). It is not possible to show all the results in the limited space available, but it is acknowledged that the discussion will not be complete without a brief, overall analysis.
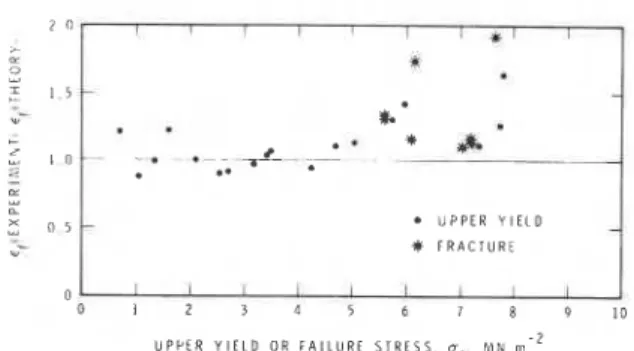
The maximum stress, o f , at upper yield or time
of premature splitting type failure is presented in
Fig. 6 as a function of average strain rate, t d , defined
as q / t f where ef is the strain at maximum stress and * I t may bc appropriate hcre to mention that analyses pre- sented by Sinha (1982b) strongly indicate that the present theory can be used to predict the onset of cracking activity in ice during strength tests.
STRESS R A l t
10 f
? i 6 STRESS-
/
25 3.T I M E . 1. s
Fig. 4. Stress and strain history of columnargrained ice of average grain diameter of 4.5 mm at -lO°C for a nominal strain rate of 1.3 X 10-' s-'.
Fig. 5. Stress and strain history of columnargrained ice of average grain diameter of 4.5 mm at - 1 0 ' ~ subjected to nominal strain rate of 5 X
lo-'
s-'.tf is the corresponding time. It is essential to recog-
nize that the premature failures show a large scatter of results, primarily reflecting the conditions of the specimen end surfaces. Results showing stresses
at 7 MN m-2 or higher were obtained with specimens
whose end surfaces were finished extremely care- fully. There is, however, significantly less scatter in the results associated with upper yield type failures.
The functional dependence of of on
Pd
for testresults exhibiting upper yield type of failure have been presented (Sinha, 1981) as
.
U P P E R Y I E L D*
F R A C T U R E1
* * * :
1Wt - 4 . 1 4 8 lo-l;,/*-
- -1' - I I I 1 1 1 0 . ~ 1 0 - I l o - 3 A V E R A G E S T R A I N R A T E 1 0 Y I E L D O R F A I L U R E . Ca,, 1 . 'Fig. 6. Dependence of stress at upper yield or premature failure by fracture on average strain rate at -lO°C for colum- nargrained S-2 ice of average grain diameter of 4 to 5 mm subjected to a wide range of constant cross-head displace- ment rates.
-
'- 3 0-
*
' I t L D ) E X P C R I M E N T F R A C T U R E-
2 5 - z Xt F R A C T U R E < " 0 - m b, z I 5 - g 1 0-
0 > 0 I I I I 1 0 ' ) 1 0 . ) A V E R A G E S T R A I N R A T E T O Y I E L D O R F A I L U R E 5 . 'Fig. 7. Dependence of strain at yield or fracture o n average strain rate for the results shown in Fig. 6.
Equation (16) is also shown in Fig. 6. This relation rather than the conventional of versus nominal strain
rate
in
has since been shown (Sinha, 1982a) to re-present the dependence of upper yield stress on truly
constant strain rate. The dependence of ~f on ;&was
~f = 2.3 X (Paf)0.25 (17)
(Sinha, 1981), but it was not graphically presented and compared with the experimental data. This is
now shown in Fig. 7, along with theoretical cal-
culations for each test in Fig. 6. Experimental and corresponding theoretical results are shown as pairs
(joined by a line). The theoretical results for ap- propriate grain diameter of 4.5 mm are based on recorded stress histories and equations (eqns. 1 l a , b and c) and on the material constants in Table 1. Note the increasing deviation of the theoretically predicted strain from the measured value as the rate of loading increased. It increased not only the stress level at upper yield but also the number of micro- cracks in the specimens at upper yield. This cor- roborates, as mentioned earlier, the physical restric- tions imposed on the theory. On the other hand, there is good agreement between theory and experi- ment, in spite of the associated high stresses, for failures for which the splitting type of fracture oc- curred early (indicated here as lower strains) in the test period. It was observed (Sinha, 1981) that the specimens suffered significantly less damage due to microcracking during these tests before fracture oc- curred. Figure 8 illustrates that the theory predicts reasonably well the experimentally observed upper yield strain for stress up to about 5 MN m-2. This range of applicability extends to a stress level of
about 7 MN m" for premature splitting type of
failure.
The applicability of the theory to test results at other temperatures can be made by introducing
the effect of temperature on
tv,
and aT using eqn.(3) to (5) provided the temperature is well below the melting point. It is not certain, however, what the upper temperature limit is for the shift function given by eqn. (5). Although this subject will not be dis- cussed in detail, it is thought that a set of examples will help to establish the merit of the theory. Figure 9 shows the stress histories obtained for columnar- grained ice at three different temperatures, using the experimental set-up described by Sinha (1981). In all these tests the cross-head rate, or nominal strain rate, used was the same, and tests were terminated soon after the upper yield stresses were reached. This was done in order to establish the internal damage in the specimens. Deformation data for these tests are presented in Fig. 10 along with the corre- sponding theoretical predictions based on actual stress paths and material constants in Table 1. The close agreement in each case between experiment and theory and the marked deviations from the nominal strain path are worth noticing. All the ice used for making these specimens was from different batches.
- U P P E R Y I E L D
# F R A C T U R E
Fig. 8. Comparison between the predicted and the experi- mental strain at peak stress as a function of this maximum stress.
Fig. 9. Stress histories at three temperatures recorded for columnargrained S-2 ice of average grain diameter of 4 to 5 mm subjected to a constant cross-head displacement rate of 7.5 X lo-' mm s-' or a nominal strain rate of 3 X 10-'s".
TIME 1 i
l'ig. 10. Comparison between the experimental and theo- retical strain histories for the tests shown in Fig. 9. The arrow indicates the occurrence of the peak stress.
The effect of the interaction between sample and test machine is also evident in the illustrations. In each case the specimen strain rate increased monotonically with time and approached a value comparable to that of the nominal rate as the peak stress was approached. These observations are con- sistent with previous ones discussed in detail by Sinha (1981). As the specimen at -5OC was relative- ly softer than that at - l o O c , the machine could im- pose the specified strain rate sooner at - 5 " ~ than at
-10°C. On the other hand, the machine was relative-
ly softer at - 3 0 " ~ in relation to the sample than it was at ---1o0C so that it took a longer time to ap- proach peak strain rate. In Fig. 10 the strain paths
described by
gd
are, however, comparable to eachother.
CONCLUSIONS
Simple methods of calculating elastic, delayed- elastic and permanent strain components during the most commonly applied engineering tests of uni- axial variable stress have been developed for a special class of non-linear, viscoelastic material that exhibits linear, delayedelastic dependence on stress. The principles of computation are simple and physically comprehensible, and the method of obtaining the total strain is devoid of mathematical abstractions. The agreement of theoretical predictions for ice with experimental observations may be considered good in view of the fact that the material sometimes ex- hibited severe cracking activity during the tests and the effect of microcracking has not yet been in- troduced into the basic constitutive equation. It has been shown that the previously proposed creep equation, which was developed primarily by means of experimental data for stresses in the range of 0.5 MN m-2, can be extrapolated reasonably well to very high stresses provided that the time involved is
short. Finally, the analysis corroborates the ob- servation that constant cross-head rate does not necessarily give a constant specimen strain rate.
ACKNOWLEDGEMENT
This paper is a contribution from the Division of Building Research, National Research Council Canada, and is published with the approval of the Director of the Division.
REFERENCES
Finnie, I. and Heller, W.R. (1959), Creep of Engineering Materials, McGrawNill, New York.
Hart, E.W., Li, C.Y., Yamada, H. and Wire, G.L. (1975), Phenomenological theory: A guide to constitutive rela- tions and fundamental deformation properties, in: Con- stitutive Equations in Plasticity, Argon, A.S. (Ed.), MIT Press, Cambridge, Massachusetts.
Lee, E.H. (19621, Viscoelasticity, in: Handbook of En- gineering Mechanics, Fliigge, W. (Ed.), M&raw-Hill, New York.
Sinha, N.K. (1978a), Rheology of columnar-grained ice, Exper. Mech., 18(12): 464-70.
Sinha, N.K. (1978b), Short-term rheology of polycrystalline ice, J.Glaciol., 21(85): 457-473.
Sinha, N.K. (1979a), Grain-boundary sliding in polycrystal- l i e materials, Phil. Mag. A, 40(6): 825-842.
Sinha, N.K. (1979b), Grain-size influence on effective mod- ules of ice, Proc. Workshop on Bearing Capacity of Ice Covers, Winnipeg, National Research Council Canada, Associate Committee on Geotechnical Research, TM
123, pp. 65 -79.
Sinha, N.K. (1981), Rate sensitivity of compressive strength of columnar-grained ice, Exper. Mech., 21(6): 209-218. Sinha, N.K. (1982a), Constant strain- and stress-rate com-
pressive strength of columnar-grained ice, J. Materials Sci., 17(3): 785-802.
Sinha, N.K. (1982b), Delayed elastic strain criterion for first cracks in ice, in Vermeer, P.A. and Luger, H.J. (Eds.), Proc. IUTAM Symp. on the Deformation and Failure of Granular Materials, Delft, 31 August-3 September 1982, A.A. Balkema, Rotterdam, pp. 323-330.
T h i s publication is being d i s t r i b u t e d by t h e Division of Building R e s e a r c h of t h e N a t i o n a l R e s e a r c h Council of Canada. I t should not b e r e p r o d u c e d i n whole o r i n p a r t without p e r m i s s i o n of t h e o r i g i n a l p u b l i s h e r . T h e Di- v i s i o n would b e glad t o b e of a s s i s t a n c e i n obtaining s u c h p e r m i s s i o n .
P u b l i c a t i o n s of t h e Division m a y b e obtained by m a i l - ing t h e a p p r o p r i a t e r e m i t t a n c e (a Bank. E x p r e s s , o r P o s t Office Money O r d e r , o r a cheque, m a d e payable t o t h e R e c e i v e r G e n e r a l of Canada. c r e d i t NRC) t o t h e National R e s e a r c h Council of Canada, Ottawa. K1A 0 R 6 . S t a m p s a r e n o t a c c e p t a b l e .
A l i s t of a l l p u b l i c a t i o n s of the Division is a v a i l a b l e and m a y be obtained f r o m the P u b l i c a t i o n s Section, Division of Building R e s e a r c h , National R e s e a r c h Council of Canada, Ottawa. KIA OR6.