Supporting Information
Improvement of DNA Vector Delivery of DOTAP Lipoplexes
by Short Chain Aminolipids
Jonas Buck
1, Dennis Mueller
2, Ute Mettal
2,3, Miriam Ackermann
2, Hiu Man Grisch-Chan
4,
Beat Thöny
4, Andreas Zumbuehl
2,5, Jörg Huwyler
1*, Dominik Witzigmann
1,61 Division of Pharmaceutical Technology, Department of Pharmaceutical Sciences, University of Basel,
Switzerland
2 Department of Chemistry, University of Fribourg, Switzerland
3 Institute for Insect Biotechnology, Justus-Liebig-University Giessen, Germany and Department of
Bioresources of the Fraunhofer Institute for Molecular Biology and Applied Ecology, Giessen, Germany
4 Division of Metabolism and Children's Research Center, University Children's Hospital Zurich, Switzerland
5 Acthera Therapeutics Ltd., Peter Merian-Strasse 45, 4052 Basel, Switzerland
6 Department of Biochemistry and Molecular Biology, University of British Columbia, Vancouver, British
Columbia, Canada.
S2
Supporting Results
1. Synthesis of Amino Lipids
1.1 Synthesis of
N
-decyl-
N
-(3-methyoxypropyl)decan-1-amine (AL-A10)
3-Methoxypropylamine (1.00 eq., 5.00 mmol, 0.51 mL), and decanal (2.20 eq., 11.00 mmol, 2.07 mL)
were dissolved in DCM (25 mL) and stirred for 3 h. Sodium triacetoxyborohydride (2.20 eq., 11.00
mmol, 2.33 g) was added and the mixture was stirred for 2 days. The product was purified by column
chromatography (Silica; EtOAc/MeOH (98:2 V/V) EtOAc/MeOH (90:10 V/V)) to yield a yellow liquid
(702 mg, 1.90 mmol, 38.0 %).
1H NMR (400 MHz, CDCl
3) = 3.47 (t, J = 5.5 Hz, 2H), 3.33 (s, 3H), 3.14-3.08 (m, 2H), 3.00-2.95 (m, 4H),
2.16-2.09 (m, 2H), 1.82-1.78 (m, 4H,), 1.35-1.27 (m, 28H), 0.89 (t, J
=7.0 Hz, 6H) ppm.
13C NMR (100 MHz, CDCl
3) = 69.3, 58.8, 52.4, 50.5, 31.8, 29.2, 29.0, 26.8, 24.1, 23.0, 22.6, 14.1 ppm.
IR ⱱ = 2924, 2853, 1718, 1579, 1466, 1379, 1256, 1119 cm
-1.
HRMS (ESI
+): m/z [M+H
]
+: calculated for [C
24
H
51NO+H]
+: 370.4048; found: 370.4037.
R
f(EtOAc / MeOH (9:1 V/V)) = 0.34.
S4
1.2 Synthesis of
N
-dodecyl-
N
-(3-methoxypropyl)dodecan-1-amine (AL-A12)
3-Methoxypropylamine (1.00 eq., 5.00 mmol, 0.51 mL), and lauraldehyde (2.20 eq., 11.00 mmol, 2.44
mL) were dissolved in DCM (25 mL) and stirred for 3 h. Sodium triacetoxyborohydride (2.20 eq., 11.00
mmol, 2.33 g) was added and the mixture was stirred for 5 days. The product was purified by column
chromatography (silica; DCM/MeOH (98:2 V/V) DCM/MeOH 90:10 V/V)) to yield a yellow, viscous
liquid (588 mg, 1.38 mmol, 28 %).
1H NMR (400 MHz, CDCl
3) = 3.49-3.39 (m, 2H), 3.31 (s, 3H), 3.10-3.06 (m, 2H), 2.97-2.93 (m, 3H),
2.05-1.98 (m, 4H), 1.74-1.62 (m, 3H), 1.31-1.25 (m, 36H), 0.87 (t, J = 6.9 Hz, 6H) ppm.
13C NMR (100 MHz, CDCl
3) = 69.5, 58.7, 52.0, 50.1, 31.9, 29.6, 29.6, 29.5, 29.3, 29.1, 26.8, 24.1, 23.0,
22.6, 14.1 ppm.
IR ⱱ = 2923, 2823, 1717, 1567, 1466, 1379, 1251, 1118 cm
-1.
HRMS (ESI
+) : m/z [M+H]
+: calculated for [C
28H
59NO+H]
+: 426.4674; found: 426.4661.
R
f(DCM / MeOH (9:1 V/V)) = 0.61.
S6
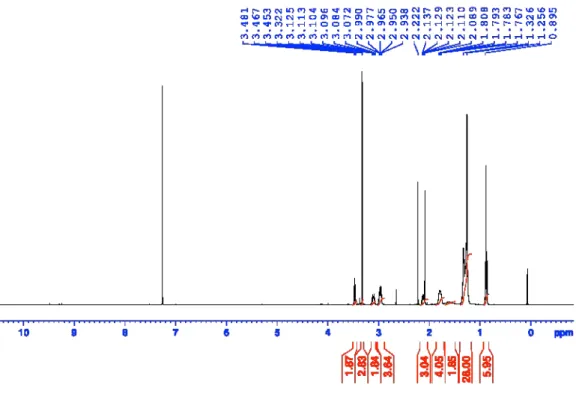
1.3 Synthesis of 3-(didecylamino)propan-1-ol (AL-B10)
3-Amino-1-propanol (1.00 eq., 5.00 mmol, 0.38 mL) and decanal (2.20 eq., 11.00 mmol, 2.07 mL) were
dissolved in DCM (25 mL) and stirred for 3 h. Sodium triacetoxyborohydride (2.20 eq., 11.00 mmol,
2.33 g) was added and the mixture was stirred for 5 days. The product was purified by column
chromatography (silica; DCM/MeOH/H
2O (89:10:1 V/V/V)) to yield a slightly yellow, viscous liquid
(1.380 g, 3.88 mmol, 78 %). Aldehyde is not fully reacted off.
1
H NMR (400 MHz, CDCl
3) = 3.75-3.72 (m, 2H), 3.14 (t, J
=7.2 Hz, 2H), 2.97-2.93 (m, 4H), 1.92 (qui, J
=
6.2 Hz, 2H), 1.65 (m, 4H), 1.30-1.25 (m, 28H), 0.87 (t, J = 6.8 Hz, 6H) ppm.
13C NMR (100 MHz, CDCl
3) = 59.0, 51.9, 50.2, 31.8, 29.4, 29.4, 29.2, 29.1, 26.8, 22.9, 22.6, 22.0, 14.0
ppm.
IR ⱱ = 2924, 2855, 1715, 1567, 1467, 1377, 1250, 1062, 1008 cm
-1.
HRMS (ESI
+) : m/z [M+H]
+: calculated for [C
23
H
49NO+H]
+: 356.3892; found: 356.3880.
R
f(DCM / MeOH / H
2O, (89:10:1 V/V/V)) = 0.40.
S8
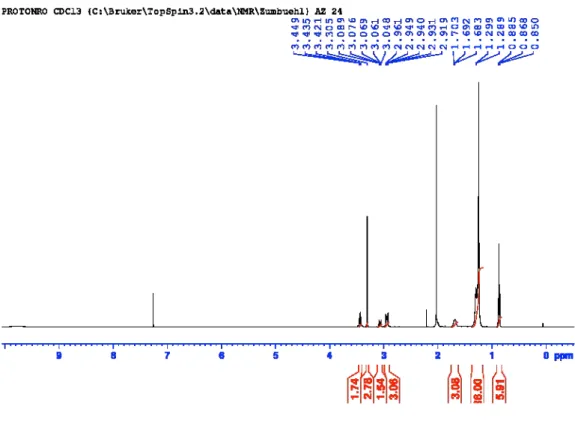
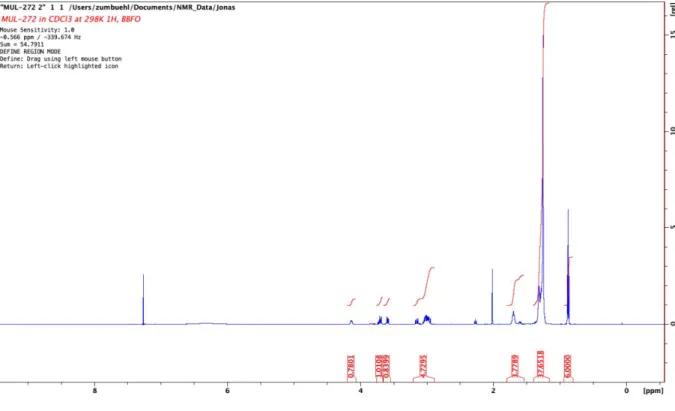
1.4 Synthesis of 3-(didodecylamino)propan-1-ol (AL-B12)
3-Amino-1-propanol (1.00 eq., 5.00 mmol, 0.38 mL), lauraldehyde (2.20 eq, 11.00 mmol, 2.44 mL) and
sodium triacetoxyborohydride (2.20 eq., 22.00 mmol, 2.33 g) were mixed in DCM and stirred for 2 days.
The product was purified by column chromatography (silica, DCM/MeOH (95:5 V/V)) to yield a yellow
liquid (428 mg, 1.04 mmol, 21 %). Aldehyde not fully reacted off.
1
H NMR (400 MHz, CDCl
3) δ = 3.76 (m, 2H), 3.47 (m, 1H), 3.21-3.17 (t, J = 7.2 Hz, 2H), 3.04-3.00 (m, 4H),
1.99-1.93 (q, J = 6.2 Hz, 2H), 1.68 (m, 4H), 1.30-1.24 (m, 36H), 0.88-0.85 (t, J = 6.7 Hz, 6H) ppm.
13C NMR (100MHz, CDCl
3) δ = 61.4, 59.0, 52.0, 51.9, 31.8, 29.5, 29.3, 29.3, 29.0, 26.7, 26.3, 22.8, 22.6,
21.1, 14.0 ppm.
IR ⱱ = 2924, 2855, 1713, 1379, 1237, 1008 cm
-1.
HRMS (ESI
+) : m/z [M+H]
+: calculated for [C
27
H
57NO + H]
+: 412.4513; found : 412.4512
R
f(DCM/MeOH (95:5 V/V)): 0.67.
Figure S11:
1H-NMR of 3-(didodecylamino)propan-1-ol (AL-B12).
S10
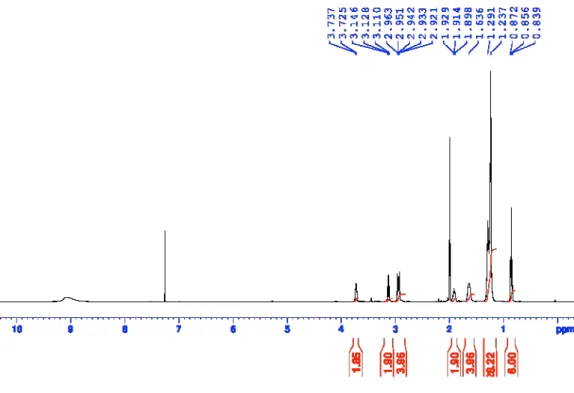
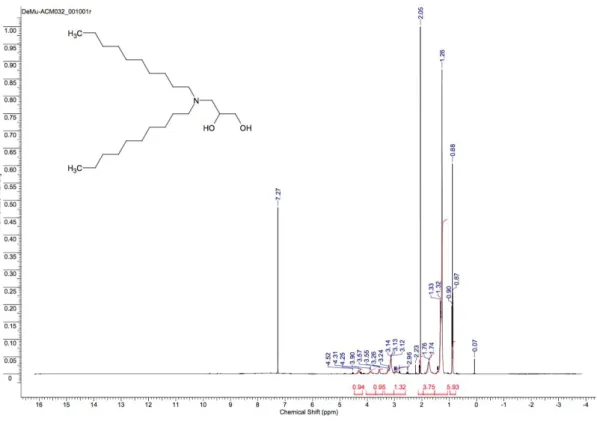
1.5 Synthesis of 3-(didecylamino)propane-1,2-diol (AL-C10)
(±)-3-Amino-1,2-propanediol (1.00 eq., 5.00 mmol, 0.51 mL), decanal (2.20 eq, 11.00 mmol, 2.07 mL)
and sodium triacetoxyborohydride (2.20 eq., 11.00 mmol, 2.33 g) were mixed in DCM and stirred for 2
days. The product was purified by column chromatography (silica; EtOAc/MeOH (98:2 V/V) →
EtOAc/MeOH (90:10 V/V)) to yield a yellow liquid (773 mg, 2.081 mmol, 42 %).
NMR data still showed impurities after several purification steps.
HRMS (ESI
+) : m/z [M+H]
+: calculated for [C
23
H
49NO
2+ H]
+: 372.3836; found : 372.3831
R
f(EtOAc/MeOH (90:10 V/V)): 0.25.
Figure S14:
1H-NMR of 3-(didecylamino)propane-1,2-diol (AL-C10).
S12
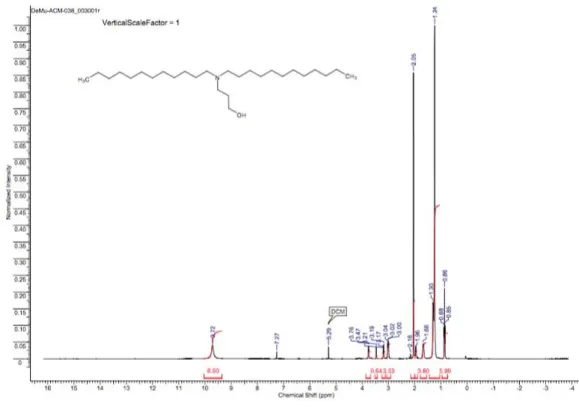
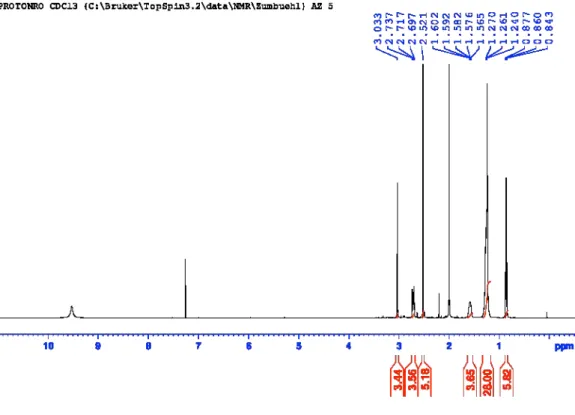
1.6 Synthesis 3-(didodecylamino)-1,2-propanediol (AL-C12)
Figure S16: Chemical structure of 3-(didodecylamino)-1,2-propanediol (AL-C12).
(±)-3-Amino-1,2-propanediol (1.00 eq., 5.00 mmol, 0.51 mL), lauraldehyde (2.20 eq, 11.00 mmol, 2.44
mL) and sodium triacetoxyborohydride (2.20 eq., 11.00 mmol, 2.33 g) were mixed in DCM and stirred
for 2 days. The product was purified by column chromatography (silica; DCM/MeOH (98:2 V/V)). The
yield was too low to be determined, but still sufficient for characterization by NMR and HRMS.
1
H NMR (600 MHz, CDCl
3) δ = 4.17-4.11 (m, 1H), 3.73-3.67 (m, 1H), 3.62-3.56 (m, 1H), 3.18-2.93 (m,
5H), 1.75-1.57 (m, 2H),1.36-1.20 (m, 38H), 0.91-0.85 (m, 6H) ppm.
13
C NMR (150 MHz, CDCl3) δ = 66.8, 64.7, 57.3, 54.2, 32.1, 29.8, 29.8, 29.7, 29.6, 29.5, 29.4, 27.1, 23.8,
22.9, 14.3 ppm.
HRMS (ESI
+): m/z [M+H]
+: calculated for [C
Figure S17:
1H-NMR of 3-(Didodecylamino)-1,2-propanediol (AL-C12).
S14
1.7 Synthesis of
N
,
N
’-didecyl-
N
,
N
’-dimethylethane-1,2-diamine (AL-D10)
N,N’’-Dimethylethylenediamine (1.00 eq., 5.00 mmol, 0.54 mL), and decanal (2.20 eq., 11.00 mmol,
2.07 mL) were dissolved in DCM (25 mL) and stirred for 3 h. Sodium triacetoxyborohydride (2.20 eq.,
11.00 mmol, 2.33 g) was added and the reaction was stirred for 2 days. The product was purified by
column chromatography (silica; DCM/MeOH/H
2O (89:10:1 V/V/V)) to yield a slightly yellow, cloudy and
viscous liquid (1.924 g, 5.21 mmol). Aldehyde not fully reacted off.
1
H NMR (400 MHz, CDCl
3
) = 3.04 (s, 4H), 2.75-2.71 (m, 4H), 2.53 (s, 6H), 1.61-1.57 (m, 4H), 1.28-1.25
(m, 28H), 0.87 (t, J = 6.9 Hz, 12 H) ppm.
13
C NMR (100 MHz, CDCl
3) = 56.8, 51.6, 40.6, 31.8, 29.4, 29.2, 27.0, 24.8, 22.6, 21.8, 14.0 ppm.
IR ⱱ = 2924, 2854, 1713, 1568, 1466, 1406, 1377, 1257 cm
-1.
HRMS (ESI
+) : m/z [M+H]
+: calculated for [C
24
H
52N
2+H]
+: 369.4209; found: 369.4209.
R
f(DCM / MeOH / H
2O, (89:10:1 V/V/V)) = 0.39.
S16
1.8 Synthesis of
N
,
N
,
N
’,
N
’-Tetrakis(decyl)propane-1,3-diamine (AL-E10)
1,3-Diaminopropane (1.00 eq., 5.00 mmol, 0.42 mL), and decanal (4.40 eq., 22.00 mmol, 4.14 mL) were
dissolved in DCM (25 mL) and stirred for 3 h. Sodium triacetoxyborohydride (4.40 eq., 22.00 mmol,
4.66 g) was added and the reaction was stirred for 2 days. The product was purified by column
chromatography (silica; EtOAc/MeOH (98:2) EtOAc/MeOH (90:10)) to yield a slightly yellow liquid
(855 mg, 1.36 mmol, 27 %).
1H NMR (400 MHz, CDCl
3) = 3.10
(m
,4H), 2.95-2.91 (m, 8H), 2.43-2.39 (m, 2H), 1.77-1.66 (m, 8H),
1.33-1.27 (m, 56H), 0.89 (t J = 7.0 Hz, 12H) ppm.
13C NMR (100 MHz, CDCl
3) = 52.5, 51.0, 31.8, 29.4, 29.4, 29.2, 29.1, 26.9, 23.4, 22.6, 14.1 ppm.
IR ⱱ = 2922, 2853, 1715, 1571, 1466, 1377, 1259 cm
-1.
HRMS (ESI
+): m/z [M+H]
+: calculated for [C
43
H
90N
2+H]
+: 635.7182; found: 635.7178.
R
f(EtOAc / MeOH (9:1 V/V)) = 0.54.
S18
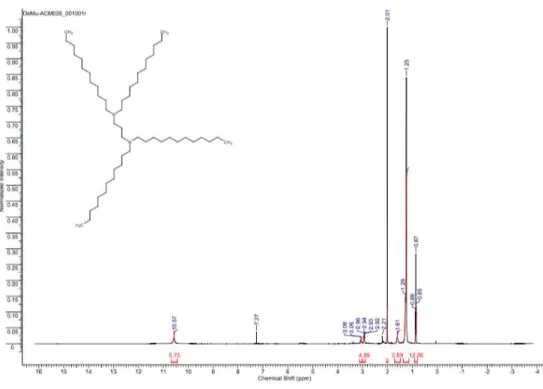
1.9 Synthesis of
N,N,N’,N’
-tetradodecylpropane-1,3-diamine (AL-E12)
1,3-Diaminopropane (1.00 eq., 5.00 mmol, 0.42 mL), lauraldehyde (4.40 eq, 22.00 mmol, 4.88 mL) and
sodium triacetoxyborohydride (4.40 eq., 22.00 mmol, 4.66 g) were mixed in DCM and stirred for 5 days.
The product was purified by column chromatography (silica; DCM/MeOH (98:2 V/V)) to yield a yellow
liquid (26 mg, 0.04 mmol, <1 %). Aldehyde not fully reacted off.
1
H NMR (400 MHz, CDCl
3) δ = 3.10-3.06 (t, J = 7.8 Hz 4H), 2.96-2.92 (q, J = 4.2 Hz, 8H), 2.24-2.08 (m,
2H), 1.61 (m, 8H), 1.29-1.25 (m, 72H), 0.89-0.85 (t, J = 6.9 Hz, 12H) ppm.
13
C NMR (100 MHz, CDCl3) δ = 51.8, 51.6, 49.8, 31.9, 29.6, 29.3, 29.1, 26.8, 22.9, 20.0, 22.6, 21.7, 14.0
ppm.
IR ⱱ = 2923, 2854, 1714, 1565, 1467, 1361, 1252, 1008 cm
-1.
HRMS (ESI
+): m/z [M+H]
+: calculated for [C
51
H
106N
2+ H]
+: 747.8429; found : 747.8426
R
f(DCM/MeOH (98:2 V/V)): 0.16.
Figure S26:
1H-NMR of N,N,N’,N’-tetradodecylpropane-1,3-diamine (AL-E12).
Figure S27:
13C-NMR of N,N,N’,N’-tetradodecylpropane-1,3-diamine (AL-E12).
S20
Benzylamine (1.00 eq., 5.00 mmol, 0.55 mL), and decanal (2.20 eq., 11.00 mmol, 2.07 mL) were
dissolved in DCM (25 mL) and stirred for 3 h. Sodium triacetoxyborohydride (2.20 eq., 11.00 mmol,
2.33 g) was added and the mixture was stirred for 2 days. The product was purified by column
chromatography (Silica; EtOAc/MeOH (98:2 V/V) EtOAc/MeOH (90:10 V/V)) to yield a dark yellow
liquid (666 mg, 1.72 mmol, 34.4 %).
1H-NMR (400 MHz, CDCl
3): = 7.27 – 7.10 (m, 5H), 3.46 (s, 2H), 2.36 – 2.26 (m, 4H), 1.45 – 1.31 (m,
4H), 1.17 (s, 28H), 0.81 (t, J = 6.8 Hz, 6H) ppm.
13C-NMR (100 MHz, CDCl
3): = 140.5, 129.0, 128.2, 126.7, 58.8, 54.0, 32.1, 29.83, 29.77, 29.75, 29.5,
27.5, 27.2, 22.8, 14.3 ppm.
HRMS (ESI
+): m/z [M+H]
+: calculated for [C
27
H
49N + H]
+: 388.3938; found : 388.3933.
R
f(DCM:MeOH (92:8 V/V)): 0.94.
Figure S30:
13C-NMR of (Benzyl)didecylamine (AL-F10).
1.11 Synthesis of [(1
H
-Imidazol-2-yl)methyl]didecylamine (AL-G10)
2-(Aminomethyl)imidazole dihydrochloride (1.00 eq., 5.00 mmol, 0.85 g), and decanal (2.20 eq., 11.00
mmol, 2.07 mL) were dissolved in DCM (25 mL) and stirred for 3 h. Sodium triacetoxyborohydride (2.20
eq., 11.00 mmol, 2.33 g) was added and the mixture was stirred for 2 days. The product was purified
by column chromatography (Silica; EtOAc/MeOH (98:2 V/V) EtOAc/MeOH (90:10 V/V)) to yield a
yellow liquid (1.36 g, 3.59 mmol, 71.9 %).
S22
1
H-NMR (400 MHz, CDCl
3
): =
11.23 (br s, 2H), 7.01 – 6.93 (m, 2H), 5.22 (s, 1H), 4.39 (s, 1H), 3.58
– 3.55 (m, 1 H), 2.86 – 2.81 (m, 2H), 1.98 (br s, 4H), 1.58 – 1.46 (m, 3H), 1.18 (br s, 28H), 0.83 – 0.79
(m, 6H) ppm.
The integrals are not fitting well due to impurities which could not be removed by chromatography.
Residual solvent peaks were found for DCM (5.33 ppm) and EtOAc 1.26 (s), 2.05 (t), 4.12 (q)
13
C-NMR (100 MHz, CDCl
3):
= 138.1, 122.9, 63.1, 52.9, 49.5, 37.7, 34.6, 32.9, 32.0, 32.0, 29.7, 29.7,
29.6, 29.6, 29.6, 29.5, 29.4, 29.3, 29.2, 29.0, 27.3, 27.3, 26.9, 25.9, 23.4, 22.8, 22.2, 14.2 ppm.
HRMS (ESI
+): m/z [M+H]
+: calculated for [C
24
H
47N
3+ H]
+: 378.3843; found : 378.3843.
R
f(DCM:MeOH (92:8 V/V)): 0.64.
Figure S33:
13C-NMR of [(1H-Imidazol-2-yl)methyl]didecylamine (AL-G10).
1.12 Synthesis [(4-Pyridyl)methyl]didecylamine (AL-H10)
4-(Aminomethyl)pyridine (1.00 eq., 5.00 mmol, 0.51 mL), and decanal (2.20 eq., 11.00 mmol, 2.07 mL)
were dissolved in DCM (25 mL) and stirred for 3 h. Sodium triacetoxyborohydride (2.20 eq., 11.00
mmol, 2.33 g) was added and the mixture was stirred for 2 days. The product was purified by column
chromatography (Silica; EtOAc/MeOH (98:2 V/V) EtOAc/MeOH (90:10 V/V)) to yield a brown liquid
(1.75 g, 4.51 mmol, 90.1 %). The spectrum still shows small acetic acid contaminations at approx. 2.1
ppm (
1H-NMR), 175 ppm, and 21 ppm (both
13C-NMR) that could not be removed with column
chromatography.
S24
1H-NMR (400 MHz, CDCl
3): = 8.54 – 8.49 (m, 2H), 7.32 – 7.29 (m, 2H), 3.56 (s, 2H), 2.44 – 2.36 (m,
4H), 1.49 – 1.39 (m, 4H), 1.24 (s, 28H), 0.87 (t, J = 6.8 Hz, 6H) ppm.
13C-NMR (100 MHz, CDCl
3): = 150.3, 149.1, 124.0, 57.8, 54.2, 32.0, 29.8, 29.71, 29.66, 29.5, 27.5,
27.0, 22.8, 14.2 ppm.
HRMS (ESI
+): m/z [M+H]
+: calculated for [C
26
H
48N
2+ H]
+: 389.3890; found : 389.3890.
R
f(DCM:MeOH (92:8 V/V)): 0.78.
Figure S36:
13C-NMR of [(4-Pyridyl)methyl]didecylamine (AL-H10).
2.
In vitro
experiments
2.1 Transfection experiments
Table S1: Results of transfection experiments for aminolipid- and DOTAP:chol-based lipoplexes.
Substance
Setting
GFP positive cells [%]
MFI [RFU]
AL-A10
1 µg DNA, 1:1 ratio
7.7
801
2 µg DNA, 1:1 ratio
28.7
1033
AL-A12
1 µg DNA, 1:1 ratio
10.3
785
2 µg DNA, 1:1 ratio
31.5
1606
AL-B10
1 µg DNA, 1:1 ratio
5.0
384
2 µg DNA, 1:1 ratio
11.5
928
AL-B12
1 µg DNA, 1:1 ratio
8.6
469
2 µg DNA, 1:1 ratio
8.3
358
AL-C10
1 µg DNA, 1:1 ratio
8.3
487
2 µg DNA, 1:1 ratio
9.5
215
AL-C12
1 µg DNA, 1:1 ratio
6.0
658
2 µg DNA, 1:1 ratio
4.2
451
AL-D10
1 µg DNA, 1:1 ratio
7.9
354
S26
AL-F10
1 µg DNA, 1:1 ratio
4.5
906
AL-G10
1 µg DNA, 1:1 ratio
4.7
714
AL-H10
1 µg DNA, 1:1 ratio
2.7
764
DOTAP:chol
1 µg DNA, 1:1 ratio
5.7
507
2 µg DNA, 1:1 ratio
13.2
756
Lipofectamine 3000
1 µg DNA, 1:1 ratio
47.5
7632
2.2 Cytotoxicity experiments
Table S2: LC10, LC50, and LC90 values corresponding to 90%, 50%, and 10% cell viability for aminolipid- and
DOTAP:chol-based systems. The values were calculated from MTT-assay data using the non-linear
dose-response function in Origin 2018.
Substance
LC10 (90% viability) [µM]
LC50 (50% viability) [µM]
LC90 (10% viability) [µM]
AL-A10
3.7
16.8
76.5
AL-A12
4.2
43.9
456.9
AL-B10
5.4
9.3
15.9
AL-B12
4.1
9.3
21.1
AL-C10
2.2
4.8
10.4
AL-C12
0.8
9.7
120.3
AL-D10
0.9
3.0
9.5
AL-E10
1.7
20.6
251.9
AL-F10
2.2
75.3
2548.8
AL-G10
9.7
42.2
182.7
AL-H10
2.0
20.6
213.7
DOTAP:chol
2.4
24.4
254.6
Table S3: Average cell viability results of three MTT assays.
Substance
% Survival
(4 µM)
% Survival
(16 µM)
% Survival
(25 µM)
% Survival
(64 µM)
% Survival
(128 µM)
AL-A10
77.5 ± 0.7
72.9 ± 1.0
65.3 ± 0.4
7.2 ± 0.3
2.5 ± 0.4
AL-A12
96.3 ± 0.7
88.9 ± 1.9
78.2 ± 2.8
48.2 ± 0.6
33.6 ± 0.5
AL-B10
79.2 ± 0.9
69.2 ± 0.6
3.4 ± 0.0
1.7 ± 0.2
1.7 ± 0.2
AL-B12
80.2 ± 1.8
67.4 ± 0.7
13.4 ± 0.2
2.0 ± 0.2
3.1 ± 1.9
AL-C10
62.8 ± 1.1
2.9 ± 0.1
1.4 ± 0.0
2.0 ± 0.6
2.2 ± 0.7
AL-C12
58.3 ± 0.2
53.6 ± 0.6
34.7 ± 0.3
3.6 ± 1.8
3.6 ± 0.1
AL-D10
36.5 ± 1.1
2.4 ± 0.1
3.3 ± 0.4
3.4 ± 0.1
3.5 ± 0.2
AL-E10
71.8 ± 1.5
62.2 ± 0.9
50.7 ± 0.9
22.5 ± 1.6
12.3 ± 1.2
AL-F10
84.7 ± 4.5
68.8 ± 2.0
69.4 ± 1.0
54.1 ± 1.6
39.1 ± 1.8
AL-G10
74.4 ± 7.9
73.4 ± 0.2
68.2 ± 0.1
29.7 ± 4.6
12.0 ± 2.4
AL-H10
80.1 ± 2.0
57.1 ± 2.5
50.5 ± 0.7
26.7 ± 0.9
11.4 ± 0.1
DOTAP:chol 78.4 ± 1.5
73.1 ± 1.1
65.3 ± 0.1
22.0 ± 0.2
17.4 ± 1.1
2.3 Structure-Activity-Relationship
The SAR was done for aminolipids AL-A10, AL-A12, AL-B10, AL-B12, and DOTAP:chol. A total of three
independent measurements with three replicates each was done to obtain the data necessary for
statistical evaluation. Statistical evaluation was carried out using Origin 2018 Pro (see Materials and
Methods).
2.3.1 Results of the Structure-Activity-Relationship experiments
Figure S37: Structure-Activity-Relationship for the most promising aminolipids A10, A12, B10,
AL-B12, as well as DOTAP:chol. The graph shows the influence of the headgroup on transfection efficiency (A, B)
and transgene expression (D, E) when the tail length stays constant and the influence of the tail length on
transfection efficiency (C) and transgene expression (F) when the headgroup stays constant. Methoxy
headgroups are superior to hydroxy headgroups (p < 0.001) and C
12tails are superior to C
10tails in both,
transfection efficiency (p < 0.1) and transgene expression (p < 0.001). The data were obtained from three
independent measurements with three replicates each. * p < 0.1, ** p < 0.001.
S28
2.3.2 ANOVA Tables for GFP (p < 0.1)
Table S4: Descriptive statistics for the one way ANOVA for GFP (p < 0.1). AL 1 corresponds to AL-A10, AL 2
corresponds to AL-A12, AL 3 corresponds to AL-B10, and AL 4 corresponds to AL-B12.
N Analysis N Missing Mean Standard Deviation SE of Mean
DOTAP/Chol 1 ug 8 1 6.0 0.7 0.3 AL 1 1 ug 9 0 7.9 1.9 0.6 AL 2 1 ug 9 0 11.2 4.2 1.4 AL 3 1 ug 9 0 4.7 2.0 0.7 AL 4 1 ug 9 0 7.6 3.1 1.0 DOTAP/Chol 2 ug 9 0 14.3 3.1 1.0 AL 1 2 ug 9 0 28.6 8.2 2.7 AL 2 2 ug 9 0 37.3 12.7 4.2 AL 3 2 ug 9 0 11.5 4.8 1.6 AL 4 2 ug 9 0 6.8 2.8 0.9
Table S5: Overall ANOVA table for the one way ANOVA for GFP (p < 0.1). Null Hypothesis: The means of all
levels are equal. Alternative Hypothesis: The means of one or more levels are different. At the 0.1 level, the
population means are significantly different.
DF Sum of Squares Mean Square F Value Prob>F
Model 9 9374.4 1041.6 33.9 0
Error 79 2428.6 30.7
Total 88 11803.0
Table S6: Fit statistics for the one way ANOVA for GFP (p < 0.1).
R-Square Coeff Var Root MSE Data Mean 0.794 0.406 5.545 13.661
Table S7: Means comparison Bonferroni test for one way ANOVA for GFP (p < 0.1). Sig equals 1 indicates that
the difference of the means is significant at the 0.1 level. Sig equals 0 indicates that the difference of the
means is not significant at the 0.1 level. AL 1 corresponds to AL-A10, AL 2 corresponds to AL-A12, AL 3
corresponds to AL-B10, and AL 4 corresponds to AL-B12.
MeanDiff SEM t Value Prob Alpha Sig LCL UCL
AL 1 1 ug DOTAP/Chol 1 ug 1.9 2.7 0.7 1 0.1 0 -6.6 10.4 AL 2 1 ug DOTAP/Chol 1 ug 5.2 2.7 1.9 1 0.1 0 -3.4 13.7 AL 2 1 ug AL 1 1 ug 3.2 2.6 1.2 1 0.1 0 -5.0 11.5 AL 3 1 ug DOTAP/Chol 1 ug -1.3 2.7 -0.5 1 0.1 0 -9.8 7.2 AL 3 1 ug AL 1 1 ug -3.2 2.6 -1.2 1 0.1 0 -11.5 5.0 AL 3 1 ug AL 2 1 ug -6.5 2.6 -2.5 0.7 0.1 0 -14.7 1.8 AL 4 1 ug DOTAP/Chol 1 ug 1.6 2.7 0.6 1 0.1 0 -6.9 10.1 AL 4 1 ug AL 1 1 ug -0.3 2.6 -0.1 1 0.1 0 -8.6 7.9 AL 4 1 ug AL 2 1 ug -3.6 2.6 -1.4 1 0.1 0 -11.8 4.7 AL 4 1 ug AL 3 1 ug 2.9 2.6 1.1 1 0.1 0 -5.4 11.2 DOTAP/Chol 2 ug DOTAP/Chol 1ug 8.3 2.7 3.1 0.1 0.1 0 -0.2 16.9 DOTAP/Chol 2 ug AL 1 1 ug 6.4 2.6 2.5 0.7 0.1 0 -1.8 14.7 DOTAP/Chol 2 ug AL 2 1 ug 3.2 2.6 1.2 1 0.1 0 -5.1 11.5 DOTAP/Chol 2 ug AL 3 1 ug 9.7 2.6 3.7 0.0 0.1 1 1.4 17.9 DOTAP/Chol 2 ug AL 4 1 ug 6.8 2.6 2.6 0.5 0.1 0 -1.5 15.0 AL 1 2 ug DOTAP/Chol 1 ug 22.6 2.7 8.4 7.4E-11 0.1 1 14.0 31.1 AL 1 2 ug AL 1 1 ug 20.6 2.6 7.9 6.2E-10 0.1 1 12.4 28.9 AL 1 2 ug AL 2 1 ug 17.4 2.6 6.7 1.5E-7 0.1 1 9.1 25.7
AL 1 2 ug AL 3 1 ug 23.9 2.6 9.1 2.4E-12 0.1 1 15.6 32.2 AL 1 2 ug AL 4 1 ug 21.0 2.6 8.0 3.5E-10 0.1 1 12.7 29.2 AL 1 2 ug DOTAP/Chol 2 ug 14.2 2.6 5.4 2.6E-5 0.1 1 6.0 22.5 AL 2 2 ug DOTAP/Chol 1 ug 31.3 2.7 11.6 4.3E-17 0.1 1 22.8 39.8 AL 2 2 ug AL 1 1 ug 29.4 2.6 11.2 2.2-16 0.1 1 21.1 37.6 AL 2 2 ug AL 2 1 ug 26.1 2.6 10.0 5.1E-14 0.1 1 17.9 34.4 AL 2 2 ug AL 3 1 ug 32.6 2.6 12.5 1.1E-18 0.1 1 24.3 40.9 AL 2 2 ug AL 4 1 ug 29.7 2.6 11.4 1.3E-16 0.1 1 21.4 38.0 AL 2 2 ug DOTAP/Chol 2 ug 22.9 2.6 8.8 1.2E-11 0.1 1 14.7 31.2 AL 2 2 ug AL 1 2 ug 8.7 2.6 3.3 0.1 0.1 1 0.5 17.0 AL 3 2 ug DOTAP/Chol 1 ug 5.4 2.7 2.0 1 0.1 0 -3.1 14.0 AL 3 2 ug AL 1 1 ug 3.5 2.6 1.4 1 0.1 0 -4.7 11.8 AL 3 2 ug AL 2 1 ug 0.3 2.6 0.1 1 0.1 0 -8.0 8.6 AL 3 2 ug AL 3 1 ug 6.8 2.6 2.6 0.5 0.1 0 -1.5 15.0 AL 3 2 ug AL 4 1 ug 3.9 2.6 1.5 1 0.1 0 -4.4 12.1 AL 3 2 ug DOTAP/Chol 2 ug -2.9 2.6 -1.1 1 0.1 0 -11.2 5.4 AL 3 2 ug AL 1 2 ug -17.1 2.6 -6.6 2.4E-7 0.1 1 -25.4 -8.9 AL 3 2 ug AL 2 2 ug -25.8 2.6 -9.9 8.4E-14 0.1 1 -34.1 -17.6 AL 4 2 ug DOTAP/Chol 1 ug 0.8 2.7 0.3 1 0.1 0 -7.8 9.3 AL 4 2 ug AL 1 1 ug -1.2 2.6 -0.5 1 0.1 0 -9.4 7.1 AL 4 2 ug AL 2 1 ug -4.4 2.6 -1.7 1 0.1 0 -12.7 3.9 AL 4 2 ug AL 3 1 ug 2.1 2.6 0.8 1 0.1 0 -6.2 10.3 AL 4 2 ug AL 4 1 ug -0.8 2.6 -0.3 1 0.1 0 -9.1 7.4 AL 4 2 ug DOTAP/Chol 2 ug -7.6 2.6 -2.9 0.2 0.1 0 -15.9 0.7 AL 4 2 ug AL 1 2 ug -21.8 2.6 -8.3 8.4E-11 0.1 1 -30.1 -13.6 AL 4 2 ug AL 2 2 ug -30.5 2.6 -11.7 3.1E-17 0.1 1 -38.8 -22.3 AL 4 2 ug AL 3 2 ug -4.7 2.6 -1.8 1 0.1 0 -13.0 3.6
2.3.3 ANOVA Table for GFP (p < 0.001)
Table S8: Descriptive statistics for the one way ANOVA for GFP (p < 0.001). AL 1 corresponds to AL-A10, AL 2
corresponds to AL-A12, AL 3 corresponds to AL-B10, and AL 4 corresponds to AL-B12.
N Analysis N Missing Mean Standard Deviation SE of Mean
DOTAP/Chol 1 ug 8 1 6.0 0.7 0.3 AL 1 1 ug 9 0 7.9 1.9 0.6 AL 2 1 ug 9 0 11.2 4.2 1.4 AL 3 1 ug 9 0 4.7 2.0 0.7 AL 4 1 ug 9 0 7.6 3.1 1.0 DOTAP/Chol 2 ug 9 0 14.3 3.1 1.0 AL 1 2 ug 9 0 28.6 8.2 2.7 AL 2 2 ug 9 0 37.3 12.7 4.2 AL 3 2 ug 9 0 11.5 4.8 1.6 AL 4 2 ug 9 0 6.8 2.8 1.0
Table S9: Overall ANOVA table for the one way ANOVA for GFP (p < 0.001). Null Hypothesis: The means of all
levels are equal. Alternative Hypothesis: The means of one or more levels are different. At the 0.001 level, the
population means are significantly different.
DF Sum of Squares Mean Square F Value Prob>F
Model 9 9374.4 1041.6 33.9 0
Error 79 2428.6 30.7
S30
0.794 0.406 5.545 13.661
Table S11: Means comparison Bonferroni test for one way ANOVA for GFP (p < 0.001). Sig equals 1 indicates
that the difference of the means is significant at the 0.001 level. Sig equals 0 indicates that the difference of the
means is not significant at the 0.001 level. AL 1 corresponds to AL-A10, AL 2 corresponds to AL-A12, AL 3
corresponds to AL-B10, and AL 4 corresponds to AL-B12.
MeanDiff SEM t Value Prob Alpha Sig LCL UCL
AL 1 1 ug DOTAP/Chol 1 ug 1.9 2.7 0.7 1 0.001 0 -10.2 14.1 AL 2 1 ug DOTAP/Chol 1 ug 5.2 2.7 1.9 1 0.001 0 -7.0 17.3 AL 2 1 ug AL 1 1 ug 3.2 2.6 1.2 1 0.001 0 -8.6 15.0 AL 3 1 ug DOTAP/Chol 1 ug -1.3 2.7 -0.5 1 0.001 0 -13.5 10.8 AL 3 1 ug AL 1 1 ug -3.2 2.6 -1.2 1 0.001 0 -15.0 8.6 AL 3 1 ug AL 2 1 ug -6.5 2.6 -2.5 0.7 0.001 0 -18.3 5.3 AL 4 1 ug DOTAP/Chol 1 ug 1.6 2.7 0.6 1 0.001 0 -10.6 13.7 AL 4 1 ug AL 1 1 ug -0.3 2.6 -0.1 1 0.001 0 -12.1 11.5 AL 4 1 ug AL 2 1 ug -3.6 2.6 -1.4 1 0.001 0 -15.4 8.2 AL 4 1 ug AL 3 1 ug 2.9 2.6 1.1 1 0.001 0 -8.9 14.7 DOTAP/Chol 2 ug DOTAP/Chol 1ug 8.3 2.7 3.1 0.1 0.001 0 -3.8 20.5 DOTAP/Chol 2 ug AL 1 1 ug 6.4 2.6 2.5 0.7 0.001 0 -5.4 18.2 DOTAP/Chol 2 ug AL 2 1 ug 3.2 2.6 1.2 1 0.001 0 -8.6 15.0 DOTAP/Chol 2 ug AL 3 1 ug 9.7 2.6 3.7 0.0 0.001 0 -2.1 21.5 DOTAP/Chol 2 ug AL 4 1 ug 6.8 2.6 2.6 0.5 0.001 0 -5.0 18.5 AL 1 2 ug DOTAP/Chol 1 ug 22.6 2.7 8.4 7.4E-11 0.001 1 10.4 34.7 AL 1 2 ug AL 1 1 ug 20.6 2.6 7.9 6.2E-10 0.001 1 8.9 32.4 AL 1 2 ug AL 2 1 ug 17.4 2.6 6.7 1.5E-7 0.001 1 5.6 29.2 AL 1 2 ug AL 3 1 ug 23.9 2.6 9.1 2.4E-12 0.001 1 12.1 35.7 AL 1 2 ug AL 4 1 ug 21.0 2.6 8.0 3.5E-10 0.001 1 9.2 32.8 AL 1 2 ug DOTAP/Chol 2 ug 14.2 2.6 5.4 2.6E-5 0.001 1 2.4 26.0 AL 2 2 ug DOTAP/Chol 1 ug 31.3 2.7 11.6 4.3E-17 0.001 1 19.1 43.4 AL 2 2 ug AL 1 1 ug 29.4 2.6 11.2 2.2E-16 0.001 1 17.6 41.1 AL 2 2 ug AL 2 1 ug 26.1 2.6 10.0 5.1E-14 0.001 1 14.3 37.9 AL 2 2 ug AL 3 1 ug 32.6 2.6 12.5 1.1E-18 0.001 1 20.8 44.4 AL 2 2 ug AL 4 1 ug 29.7 2.6 11.4 1.3E-16 0.001 1 17.9 41.5 AL 2 2 ug DOTAP/Chol 2 ug 22.9 2.6 8.8 1.2E-11 0.001 1 11.2 34.7 AL 2 2 ug AL 1 2 ug 8.7 2.6 3.3 0.1 0.001 0 -3.1 20.5 AL 3 2 ug DOTAP/Chol 1 ug 5.4 2.7 2.0 1 0.001 0 -6.7 17.6 AL 3 2 ug AL 1 1 ug 3.5 2.6 1.4 1 0.001 0 -8.3 15.3 AL 3 2 ug AL 2 1 ug 0.3 2.6 0.1 1 0.001 0 -11.5 12.1 AL 3 2 ug AL 3 1 ug 6.8 2.6 2.6 0.5 0.001 0 -5.0 18.6 AL 3 2 ug AL 4 1 ug 3.9 2.6 1.5 1 0.001 0 -7.9 15.7 AL 3 2 ug DOTAP/Chol 2 ug -2.9 2.6 -1.1 1 0.001 0 -14.7 8.9 AL 3 2 ug AL 1 2 ug -17.1 2.6 -6.6 2.4E-7 0.001 1 -28.9 -5.3 AL 3 2 ug AL 2 2 ug -25.8 2.6 -9.9 8.4E-14 0.001 1 -37.6 -14.0 AL 4 2 ug DOTAP/Chol 1 ug 0.8 2.7 0.28 1 0.001 0 -11.4 12.9 AL 4 2 ug AL 1 1 ug -1.2 2.6 -0.5 1 0.001 0 -13.0 10.6 AL 4 2 ug AL 2 1 ug -4.4 2.6 -1.7 1 0.001 0 -16.2 7.4 AL 4 2 ug AL 3 1 ug 2.1 2.6 0.8 1 0.001 0 -9.7 13.9 AL 4 2 ug AL 4 1 ug -0.8 2.6 -0.3 1 0.001 0 -12.6 11.0 AL 4 2 ug DOTAP/Chol 2 ug -7.6 2.6 -2.9 0.2 0.001 0 -19.4 4.2 AL 4 2 ug AL 1 2 ug -21.8 2.6 -8.4 8.3E-11 0.001 1 -33.6 -10.0 AL 4 2 ug AL 2 2 ug -30.5 2.6 -11.7 3.1E-17 0.001 1 -42.3 -18.7 AL 4 2 ug AL 3 2 ug -4.7 2.6 -1.8 1 0.001 0 -16.5 7.1
2.3.4 ANOVA Table for MFI (p < 0.1)
Table S12: Descriptive statistics for the one way ANOVA for MFI (p < 0.1). AL 1 corresponds to AL-A10, AL 2
corresponds to AL-A12, AL 3 corresponds to AL-B10, and AL 4 corresponds to AL-B12.
N Analysis N Missing Mean Standard Deviation SE of Mean
DOTAP/Chol 1 ug 8 1 417.5 21.4 7.6 AL 1 1 ug 9 0 409.4 40.0 13.3 AL 2 1 ug 9 0 623.7 152.2 50.5 AL 3 1 ug 8 1 333.3 23.6 8.4 AL 4 1 ug 9 0 320.8 78.8 26.3 DOTAP/Chol 2 ug 9 0 644.4 107.2 35.7 AL 1 2 ug 9 0 893.9 167.7 55.9 AL 2 2 ug 9 0 1459.3 478.0 159.3 AL 3 2 ug 9 0 247.3 103.9 34.6 AL 4 2 ug 9 0 250.8 67.1 22.4
Table S13: Overall ANOVA table for the one way ANOVA for MFI (p < 0.1). Null Hypothesis: The means of all
levels are equal. Alternative Hypothesis: The means of one or more levels are different. At the 0.1 level, the
population means are significantly different.
DF Sum of Squares Mean Square F Value Prob>F
Model 9 1.1E7 1.3E6 39.2 0
Error 78 2.5E6 32335.8
Total 87 1.4E7
Table S14: Fit statistics for the one way ANOVA for MFI (p < 0.1).
R-Square Coeff Var Root MSE Data Mean 0.819 0.319 179.822 564.239
Table S15: Means comparison Bonferroni test for one way ANOVA for MFI (p < 0.1). Sig equals 1 indicates
that the difference of the means is significant at the 0.1 level. Sig equals 0 indicates that the difference of the
means is not significant at the 0.1 level. AL 1 corresponds to AL-A10, AL 2 corresponds to AL-A12, AL 3
corresponds to AL-B10, and AL 4 corresponds to AL-B12.
MeanDiff SEM t Value Prob Alpha Sig LCL UCL AL 1 1 ug DOTAP/Chol 1 ug -8.1 87.4 -0.1 1 0.1 0 -284.5 268.4 AL 2 1 ug DOTAP/Chol 1 ug 206.2 87.4 2.4 0.9 0.1 0 -70.3 482.6 AL 2 1 ug AL 1 1 ug 214.2 84.8 2.5 0.6 0.1 0 -53.9 482.4 AL 3 1 ug DOTAP/Chol 1 ug -84.3 89.9 -0.9 1 0.1 0 -368.7 200.2 AL 3 1 ug AL 1 1 ug -76.2 87.4 -0.9 1 0.1 0 -352.6 200.2 AL 3 1 ug AL 2 1 ug -290.4 87.4 -3.3 0.1 0.1 1 -566.8 -14.0 AL 4 1 ug DOTAP/Chol 1 ug -96.7 87.4 -1.1 1 0.1 0 -373.1 179.7 AL 4 1 ug AL 1 1 ug -88.7 84.8 -1.0 1 0.1 0 -356.8 179.5 AL 4 1 ug AL 2 1 ug -302.9 84.8 -3.6 0.0 0.1 1 -571.1 -34.7 AL 4 1 ug AL 3 1 ug -12.5 87.4 -0.1 1 0.1 0 -288.9 263.9 DOTAP/Chol 2 ug DOTAP/Chol 1 ug 226.9 87.4 2.6 0.5 0.1 0 -49.5 503.4 DOTAP/Chol 2 ug AL 1 1 ug 235.0 84.8 2.8 0.3 0.1 0 -33.2 503.2 DOTAP/Chol 2 ug AL 2 1 ug 20.8 84.8 0.2 1 0.1 0 -247.4 288.9 DOTAP/Chol 2 ug AL 3 1 ug 311.2 87.4 3.6 0.0 0.1 1 34.8 587.6 DOTAP/Chol 2 ug AL 4 1 ug 323.7 84.8 3.8 0.0 0.1 1 55.5 591.8
S32
AL 1 2 ug AL 2 1 ug 270.2 84.8 3.2 0.1 0.1 1 2.1 538.4 AL 1 2 ug AL 3 1 ug 560.6 87.4 6.4 4.5E-7 0.1 1 284.2 837.1 AL 1 2 ug AL 4 1 ug 573.1 84.8 6.8 1.0E-7 0.1 1 304.9 841.3 AL 1 2 ug DOTAP/Chol 2 ug 249.4 84.8 2.9 0.2 0.1 0 -18.7 517.6 AL 2 2 ug DOTAP/Chol 1 ug 1041.8 87.4 11.9 1.3E-17 0.1 1 765.4 1318.3 AL 2 2 ug AL 1 1 ug 1049.9 84.8 12.4 1.9E-18 0.1 1 781.7 1318.1 AL 2 2 ug AL 2 1 ug 835.7 84.8 9.9 1.1E-13 0.1 1 567.5 1103.8 AL 2 2 ug AL 3 1 ug 1126.1 87.4 12.9 2.3E-19 0.1 1 849.7 1402.5 AL 2 2 ug AL 4 1 ug 1138.6 84.8 13.4 2.5E-20 0.1 1 870.4 1406.7 AL 2 2 ug DOTAP/Chol 2 ug 814.9 84.8 9.6 3.2E-13 0.1 1 546.7 1083.1 AL 2 2 ug AL 1 2 ug 565.4 84.8 6.7 1.5E-7 0.1 1 297.3 833.6 AL 3 2 ug DOTAP/Chol 1 ug -170.2 87.4 -1.9 1 0.1 0 -446.6 106.3 AL 3 2 ug AL 1 1 ug -162.1 84.8 -1.9 1 0.1 0 -430.3 106.1 AL 3 2 ug AL 2 1 ug -376.3 84.8 -4.4 0.0 0.1 1 -644.5 -108.2 AL 3 2 ug AL 3 1 ug -85.9 87.4 -1.0 1 0.1 0 -362.3 190.5 AL 3 2 ug AL 4 1 ug -73.4 84.8 -0.9 1 0.1 0 -341.6 194.7 AL 3 2 ug DOTAP/Chol 2 ug -397.1 84.8 -4.7 5.3E-4 0.1 1 -665.3 -128.9 AL 3 2 ug AL 1 2 ug -646.6 84.8 -7.6 2.2E-9 0.1 1 -914.7 -378.4 AL 3 2 ug AL 2 2 ug -1212.0 84.8 -14.3 7.6E-22 0.1 1 -1480.2 -943.8 AL 4 2 ug DOTAP/Chol 1 ug -166.7 87.4 -1.9 1 0.1 0 -443.1 109.7 AL 4 2 ug AL 1 1 ug -158.7 84.8 -1.9 1 0.1 0 -426.8 109.5 AL 4 2 ug AL 2 1 ug -372.9 84.8 -4.4 0.0 0.1 1 -641.1 -104.7 AL 4 2 ug AL 3 1 ug -82.5 87.4 -0.9 1 0.1 0 -358.9 193.9 AL 4 2 ug AL 4 1 ug -70.0 84.8 -0.8 1 0.1 0 -338.2 198.2 AL 4 2 ug DOTAP/Chol 2 ug -393.7 84.8 -4.6 6.1E-4 0.1 1 -661.8 -125.5 AL 4 2 ug AL 1 2 ug -643.1 84.8 -7.6 2.7E-9 0.1 1 -911.3 -374.9 AL 4 2 ug AL 2 2 ug -1208.6 84.8 -14.3 9.0E-22 0.1 1 -1476.7 -940.4 AL 4 2 ug AL 3 2 ug 3.4 84.8 0.0 1 0.1 0 -264.7 271.62.3.5 ANOVA Table for MFI (p < 0.001)
Table S16: Descriptive statistics for the one way ANOVA for MFI (p < 0.001). AL 1 corresponds to AL-A10, AL 2
corresponds to AL-A12, AL 3 corresponds to AL-B10, and AL 4 corresponds to AL-B12.
N Analysis N Missing Mean Standard Deviation SE of Mean
DOTAP/Chol 1 ug 8 1 417.5 21.4 7.6 AL 1 1 ug 9 0 409.4 40.0 13.3 AL 2 1 ug 9 0 623.6 152.2 50.7 AL 3 1 ug 8 1 333.3 23.6 8.3 AL 4 1 ug 9 0 320.8 78.8 26.3 DOTAP/Chol 2 ug 9 0 644.4 107.2 35.7 AL 1 2 ug 9 0 893.9 167.7 55.9 AL 2 2 ug 9 0 1459.3 478.0 159.3 AL 3 2 ug 9 0 247.3 103.9 34.6 AL 4 2 ug 9 0 250.8 67.1 22.4
Table S17: Overall ANOVA table for the one way ANOVA for MFI (p < 0.001). Null Hypothesis: The means of all
levels are equal. Alternative Hypothesis: The means of one or more levels are different. At the 0.001 level, the
population means are significantly different.
DF Sum of Squares Mean Square F Value Prob>F
Model 9 1.1E7 1.3E6 39.2 0
Error 78 2.5E6 32335.8
Table S18: Fit statistics for the one way ANOVA for MFI (p < 0.001).
R-Square Coeff Var Root MSE Data Mean 0.819 0.319 179.822 564.239
Table S19: Means comparison Bonferroni test for one way ANOVA for MFI (p < 0.001). Sig equals 1 indicates
that the difference of the means is significant at the 0.001 level. Sig equals 0 indicates that the difference of the
means is not significant at the 0.001 level. AL 1 corresponds to AL-A10, AL 2 corresponds to AL-A12, AL 3
corresponds to AL-B10, and AL 4 corresponds to AL-B12.
MeanDiff SEM t Value Prob Alpha Sig LCL UCL AL 1 1 ug DOTAP/Chol 1 ug -8.1 87.4 -0.1 1 0.001 0 -402.5 386.4 AL 2 1 ug DOTAP/Chol 1 ug 206.2 87.4 2.4 0.9 0.001 0 -188.2 600.6 AL 2 1 ug AL 1 1 ug 214.2 84.8 2.5 0.6 0.001 0 -168.4 596.9 AL 3 1 ug DOTAP/Chol 1 ug -84.3 89.9 -0.9 1 0.001 0 -490.1 321.6 AL 3 1 ug AL 1 1 ug -76.2 87.4 -0.9 1 0.001 0 -470.6 318.2 AL 3 1 ug AL 2 1 ug -290.4 87.4 -3.3 0.1 0.001 0 -684.8 104.0 AL 4 1 ug DOTAP/Chol 1 ug -96.7 87.4 -1.1 1 0.001 0 -491.1 297.7 AL 4 1 ug AL 1 1 ug -88.7 84.8 -1.0 1 0.001 0 -471.3 294.0 AL 4 1 ug AL 2 1 ug -302.9 84.8 -3.6 0.0 0.001 0 -685.5 79.7 AL 4 1 ug AL 3 1 ug -12.5 87.4 -0.1 1 0.001 0 -406.9 381.9 DOTAP/Chol 2 ug DOTAP/Chol 1 ug 226.9 87.4 2.6 0.5 0.001 0 -167.5 621.4 DOTAP/Chol 2 ug AL 1 1 ug 235.0 84.8 2.8 0.3 0.001 0 -147.6 617.6 DOTAP/Chol 2 ug AL 2 1 ug 20.8 84.8 0.2 1 0.001 0 -361.9 403.4 DOTAP/Chol 2 ug AL 3 1 ug 311.2 87.4 3.6 0.0 0.001 0 -83.2 705.6 DOTAP/Chol 2 ug AL 4 1 ug 323.7 84.8 3.8 0.0 0.001 0 -59.0 706.3 AL 1 2 ug DOTAP/Chol 1 ug 476.4 87.4 5.5 2.5E-5 0.001 1 82.0 870.8 AL 1 2 ug AL 1 1 ug 484.4 84.8 5.7 8.6E-6 0.001 1 101.8 867.1 AL 1 2 ug AL 2 1 ug 270.2 84.8 3.2 0.1 0.001 0 -112.4 652.9 AL 1 2 ug AL 3 1 ug 560.6 87.4 6.4 4.5E-7 0.001 1 166.2 955.1 AL 1 2 ug AL 4 1 ug 573.1 84.8 6.8 1.0E-7 0.001 1 190.5 955.7 AL 1 2 ug DOTAP/Chol 2 ug 249.4 84.8 2.9 0.2 0.001 0 -133.2 632.1 AL 2 2 ug DOTAP/Chol 1 ug 1041.8 87.4 11.9 1.3E-17 0.001 1 647.4 1436.2 AL 2 2 ug AL 1 1 ug 1049.9 84.8 12.4 1.9E-18 0.001 1 667.3 1432.5 AL 2 2 ug AL 2 1 ug 835.7 84.8 9.9 1.1E-13 0.001 1 453.0 1218.3 AL 2 2 ug AL 3 1 ug 1126.1 87.4 12.9 2.3E-19 0.001 1 731.7 1520.5 AL 2 2 ug AL 4 1 ug 1138.6 84.8 13.4 2.5E-20 0.001 1 755.9 1521.2 AL 2 2 ug DOTAP/Chol 2 ug 814.9 84.8 9.6 3.2E-13 0.001 1 432.3 1197.5 AL 2 2 ug AL 1 2 ug 565.4 84.8 6.7 1.5E-7 0.001 1 182.8 948.1 AL 3 2 ug DOTAP/Chol 1 ug -170.2 87.4 -1.9 1 0.001 0 -564.6 224.2 AL 3 2 ug AL 1 1 ug -162.1 84.8 -1.9 1 0.001 0 -544.7 220.5 AL 3 2 ug AL 2 1 ug -376.3 84.8 -4.4 0.0 0.001 0 -759.0 6.3 AL 3 2 ug AL 3 1 ug -85.9 87.4 -1.0 1 0.001 0 -480.3 308.5 AL 3 2 ug AL 4 1 ug -73.4 84.8 -0.9 1 0.001 0 -456.1 309.2 AL 3 2 ug DOTAP/Chol 2 ug -397.1 84.8 -4.7 5.3E-4 0.001 1 -779.7 -14.5 AL 3 2 ug AL 1 2 ug -646.6 84.8 -7.6 2.2E-9 0.001 1 -1029.2 -263.9 AL 3 2 ug AL 2 2 ug -1212.0 84.8 -14.3 7.6E-22 0.001 1 -1594.6 -829.4 AL 4 2 ug DOTAP/Chol 1 ug -166.7 87.4 -1.9 1 0.001 0 -561.1 227.7 AL 4 2 ug AL 1 1 ug -158.7 84.8 -1.9 1 0.001 0 -541.3 224.0 AL 4 2 ug AL 2 1 ug -372.9 84.8 -4.4 0.0 0.001 0 -755.5 9.7 AL 4 2 ug AL 3 1 ug -82.5 87.4 -0.9 1 0.001 0 -476.9 311.9 AL 4 2 ug AL 4 1 ug -70.0 84.8 -0.8 1 0.001 0 -452.6 312.6 AL 4 2 ug DOTAP/Chol 2 ug -393.7 84.8 -4.6 6.1E-4 0.001 1 -776.3 -11.0 AL 4 2 ug AL 1 2 ug -643.1 84.8 -7.6 2.7E-9 0.001 1 -1025.7 -260.5
S34
2.3.6 Outlier Detection
Table S 20: Outlier detection for GFP at 1µg/mL DNA and a lipid-to-DNA ratio of 1. Outliers (red) were defined
as values larger than the upper fence or lower than the lower fence and were excluded from analysis.Upper
fence is defined by Q3 + 1.5x interquartile range (IQR) and lower fence is defined by Q1 – 1.5x IQR. Only one
oulier could be identified.
Control DOTAP:chol AL-A10 AL-B10 AL-A12 AL-B12
0.12 0.12 6.52 6.52 8.28 8.28 4.90 4.90 5.25 5.25 4.05 4.05 0.06 0.06 4.74 4.74 6.14 6.14 4.05 4.05 7.18 7.18 8.42 8.42 0.12 0.12 6.75 6.75 8.17 8.17 9.01 9.01 15.20 15.20 9.65 9.65 5.98 5.98 11.50 11.50 4.28 4.28 6.34 6.34 6.34 6.34 5.26 5.26 6.72 6.72 2.27 2.27 12.50 12.50 4.83 4.83 6.52 6.52 7.95 7.95 5.76 5.76 15.60 15.60 9.67 9.67 10.5 8.32 8.32 3.07 3.07 9.67 9.67 4.88 4.88 5.78 5.78 5.00 5.00 3.16 3.16 12.60 12.60 6.66 6.66 6.54 6.54 9.23 9.23 5.66 5.66 16.10 16.10 13.8 13.8 Q1 0.06 Q1 5.52 Q1 6.43 Q1 3.12 Q1 6.76 Q1 4.86 Q3 0.12 Q3 6.65 Q3 8.78 Q3 5.71 Q3 15.4 Q3 9.66
IQR 0.06 IQR 1.13 IQR 2.35 IQR 2.60 IQR 8.64 IQR 4.81
Upper Fence 0.21 Upper Fence 8.33 Upper Fence 12.29 Upper Fence 9.60 Upper Fence 28.36 Upper Fence 16.87
Lower Fence -0.03 Lower Fence 3.83 Lower Fence 2.91 Lower Fence -0.78 Lower Fence -6.20 Lower Fence -2.35
Median 0.12 Median 6.25 Median 8.17 Median 4.28 Median 12.5 Median 6.66
Average 0.10 Average 6.01 Average 7.92 Average 4.68 Average 11.16 Average 7.59
S.D. 0.03 S.D. 0.67 S.D. 1.76 S.D. 1.89 S.D. 3.95 S.D. 2.94
Table S21: Outlier detection for GFP at 2µg/mL DNA and a lipid-to-DNA ratio of 1. Outliers (red) were defined
as values larger than the upper fence or lower than the lower fence and were excluded from analysis.Upper
fence is defined by Q3 + 1.5x interquartile range (IQR) and lower fence is defined by Q1 – 1.5x IQR. No outlier
could be identified.
Control DOTAP:chol AL-A10 AL-B10 AL-A12 AL-B12
0.10 0.10 10.60 10.60 19.50 19.50 11.20 11.20 17.30 17.30 9.78 9.78 0.11 0.11 16.20 16.20 33.50 33.50 7.91 7.91 45.20 45.20 7.43 7.43 0.09 0.09 12.60 12.60 33.40 33.40 8.00 8.00 44.50 44.50 12.70 12.70 10.60 10.60 16.70 16.70 7.92 7.92 22.00 22.00 3.99 3.99 17.00 17.00 32.70 32.70 9.37 9.37 43.00 43.00 6.41 6.41 16.30 16.30 37.10 37.10 8.74 8.74 53.00 53.00 4.93 4.93 11.30 11.30 17.40 17.40 11.70 11.70 23.80 23.80 5.23 5.23 19.10 19.10 32.80 32.80 22.20 22.20 44.60 44.60 5.91 5.91 15.40 15.40 34.00 34.00 16.00 16.00 42.10 42.10 4.43 4.43 Q1 0.09 Q1 10.95 Q1 18.45 Q1 7.96 Q1 22.90 Q1 4.68 Q3 0.11 Q3 16.65 Q3 33.75 Q3 13.85 Q3 44.90 Q3 8.61
IQR 0.02 IQR 5.70 IQR 15.30 IQR 5.89 IQR 22.00 IQR 3.93
Upper Fence 0.14 Upper Fence 25.20 Upper Fence 56.70 Upper Fence 22.69 Upper Fence 77.90 Upper Fence 14.49
Lower Fence 0.06 Lower Fence 2.40 Lower Fence -4.50 Lower Fence -0.87 Lower Fence -10.10 Lower Fence -1.21
Median 0.10 Median 15.40 Median 32.80 Median 9.37 Median 43.00 Median 5.91
Average 0.10 Average 14.34 Average 28.57 Average 11.45 Average 37.28 Average 6.76
S.D. 0.01 S.D. 2.95 S.D. 7.69 S.D. 4.53 S.D. 11.95 S.D. 2.68
RSD 9.12 RSD 20.58 RSD 26.93 RSD 39.60 RSD 32.07 RSD 39.62
Table S22: Outlier detection for MFI at 1µg/mL DNA and a lipid-to-DNA ratio of 1. Outliers (red) were defined
as values larger than the upper fence or lower than the lower fence and were excluded from analysis.Upper
fence is defined by Q3 + 1.5x interquartile range (IQR) and lower fence is defined by Q1 – 1.5x IQR. Only two
ouliers could be identified.
Control DOTAP:chol AL-A10 AL-B10 AL-A12 AL-B12
182 182 409 409 379 379 333 333 424 424 294 294 127 127 398 398 395 395 354 354 451 451 290 290 147 147 461 461 426 426 420 819 819 328 328 425 425 430 430 344 344 451 451 277 277 401 401 477 477 313 313 582 582 291 291 407 407 402 402 329 329 752 752 438 438 596 392 392 291 291 714 714 224 224 405 405 340 340 335 335 653 653 281 281 434 434 444 444 367 367 767 767 464 464 Q1 127 Q1 403 Q1 385.5 Q1 321 Q1 451 Q1 279 Q3 182 Q3 447.5 Q3 437 Q3 360.5 Q3 759.5 Q3 383
IQR 55 IQR 44.5 IQR 51.5 IQR 39.5 IQR 308.5 IQR 104
Upper
Fence 264.50 UpperFence 514.25 UpperFence 514.25 UpperFence 419.75 UpperFence 1222.25 UpperFence 539.00
Lower
Fence 44.50 LowerFence 336.25 LowerFence 308.25 LowerFence 261.75 LowerFence -11.75 LowerFence 123.00
Median 147 Median 408 Median 402 Median 334 Median 653 Median 291
Average 152.00 Average 417.50 Average 409.44 Average 333.25 Average 623.67 Average 320.78
S.D. 22.73 S.D. 20.04 S.D. 37.67 S.D. 22.08 S.D. 143.53 S.D. 74.33
S36
Table S 23: Outlier detection for MFI at 2µg/mL DNA and a lipid-to-DNA ratio of 1. Outliers (red) were defined
as values larger than the upper fence or lower than the lower fence and were excluded from analysis.Upper
fence is defined by Q3 + 1.5x interquartile range (IQR) and lower fence is defined by Q1 – 1.5x IQR. No outlier
could be identified.
Control DOTAP:chol AL-A10 AL-B10 AL-A12 AL-B12
132 132 489 489 816 816 212 212 745 745 303 303 133 133 663 663 966 966 151 151 1972 1972 153 153 148 148 570 570 937 937 151 151 1658 1658 164 164 531 531 694 694 308 308 968 968 238 238 733 733 1063 1063 151 151 1492 1492 209 209 753 753 956 956 164 164 2283 2283 253 253 564 564 577 577 317 317 1155 1155 304 304 774 774 1082 1082 427 427 1437 1437 354 354 723 723 954 954 345 345 1424 1424 279 279 Q1 132 Q1 547.5 Q1 755 Q1 151 Q1 1061.5 Q1 186.5 Q3 148 Q3 743 Q3 1014.5 Q3 331 Q3 1815 Q3 303.5
IQR 16 IQR 195.5 IQR 259.5 IQR 180 IQR 753.5 IQR 117
Upper
Fence 172.00 UpperFence 1036.25 UpperFence 1403.75 UpperFence 601.00 UpperFence 2945.25 UpperFence 479.00
Lower
Fence 108.00 LowerFence 254.25 LowerFence 365.75 LowerFence -119.00 LowerFence -68.75 LowerFence 11.00
Median 133 Median 663 Median 954 Median 212 Median 1437 Median 253
Average 137.67 Average 644.44 Average 893.89 Average 247.33 Average 1459.33 Average 250.78
S.D. 7.32 S.D. 101.09 S.D. 158.10 S.D. 97.97 S.D. 450.66 S.D. 63.26