Publisher’s version / Version de l'éditeur:
Vous avez des questions? Nous pouvons vous aider. Pour communiquer directement avec un auteur, consultez la première page de la revue dans laquelle son article a été publié afin de trouver ses coordonnées. Si vous n’arrivez pas à les repérer, communiquez avec nous à [email protected].
Questions? Contact the NRC Publications Archive team at
[email protected]. If you wish to email the authors directly, please see the first page of the publication for their contact information.
https://publications-cnrc.canada.ca/fra/droits
L’accès à ce site Web et l’utilisation de son contenu sont assujettis aux conditions présentées dans le site LISEZ CES CONDITIONS ATTENTIVEMENT AVANT D’UTILISER CE SITE WEB.
Building Research Note, 1983-01
READ THESE TERMS AND CONDITIONS CAREFULLY BEFORE USING THIS WEBSITE. https://nrc-publications.canada.ca/eng/copyright
NRC Publications Archive Record / Notice des Archives des publications du CNRC :
https://nrc-publications.canada.ca/eng/view/object/?id=46942319-b799-486a-9ab4-5476df7bb558 https://publications-cnrc.canada.ca/fra/voir/objet/?id=46942319-b799-486a-9ab4-5476df7bb558
NRC Publications Archive
Archives des publications du CNRC
This publication could be one of several versions: author’s original, accepted manuscript or the publisher’s version. / La version de cette publication peut être l’une des suivantes : la version prépublication de l’auteur, la version acceptée du manuscrit ou la version de l’éditeur.
Access and use of this website and the material on it are subject to the Terms and Conditions set forth at
A Case Study of a Daylight-Linked Dimming System for Fluorescent
Lamps
A CASE STUDY OF A
DAYLIGHT-LINKED
DIMMING SYSTEMFOR
FLUORESCENT LAMPS bY
R.R. Jaekel and M,S. R e a
INTRODUCTION
A pilot case study was conducted to obtain first-hand knowledge of the operating characteristics of a commesclally a v a i l a b l e daylight-
linked dimming system.
To
avold any inferred sanctions or condemnations of particular products, trade names have not been used In this report. The particular aspects of the s i t e of thLs study limit the general use of these results for other installations. However, it is hoped that theissues presented in t h i s repart would be considered when evaluating the
performance p o t e n t i a l af any phatoelactrtc dimming system.
TIIE TEST SLTe
An open-plan offfce, hausing library adnrLnistrative staff, was
chosen as a test area*. The test area is an the south side of the second f l o o r (Figure I ) , with an adjacent o f f i c e as a reference area.
S t a f f members in both areas were n o t informed of the testing.
'Phe south sFde of the bulldlng faces an open f i e l d . Windows extend
t h e full length of the t e s t area's south s i d e . Each wfndow is 1.7 m
high, extending from 81 cm above the f l o o r to 3 cm below the ceiling.
Each window cantaLns a venetian blind assembly between its glazing5 and although the pitch of the venetian b l i n d lalrvers can be manipulated by t h e occupants, t h e b l i n d s cannot be retracted. A covered atrim with
skylights and incandescent lamps bounds the north s i d e of the t e s t
area,
AttZficial illumination in the two areas 1s supplded by recessed
fluorescent luminaires using two warm white fluorescent lamps. These l u d n a i r e s are flush with the ceiling and covered with clear prismatic
l e n s e s . One switch c o n t r o l s the artificial lighting far both the t e a t
and reference areas. Although the lighting was ortginally deafgned to
operate on 347 V, i t 8 actual e l e c t r i c a l potential was approximately
322 V prior to
and
during the test p e r i o d * (The managing e l e c t r i c a leagfneer reduced the voltage to save energJr s u p p l i e d to incandescent
Lamps in the bu%1dfngts atrium.)
*
Canada Institote f o r Scientific and Techntcal Information ( C I S T I ) , B u i l d f n gM-55,
National Research Council of Canada, O t t a w a .TESTING PROCEDURES
Retrofitting
The daylight-linked dimrdng system and monitoring equipment were
TnstalPed in a small room w e l l o u t s i d e the occupants' a c t i v i t y areas.
The dimming system conveniently allowed for remote control of three
zones ( F i g u r e 1 ) :
Zone 1: two rows o f luminaires adjacent t o the windows,
Zone 2: middle four rows 0 5 luminatres,
Zone 3: two rows of luminaires adjacent to the atrium.
The output of the lamps in each zone was modulated by two
photosensors, wtred in parallel, for that zone (Figures 1 , 2 ) . The
hours of usage and the energy consumed (kflowatt hours)
in
each zone andfn the reference area were monitored separately. Only energy consumed
during working hours, 0800 t o 1700, was used for analysis.
New b a l l a s t s and lamps were installed in the test area. The
o r f g i n a l , conventtonal ballaets w e r e replaced with dfmmlng ballasts. New lamps were also substituted in the reference area, but the o r i g i n a l
b a l l a s t s were retafned.
The operation of the dimming system was established
In
accordancewith the manufacturer's recommendations, Figure 3 is a schematic of the control system. The d i d n g system was f i r s t adjusted t o supply maximum
current ta the lamps in the t e s t area (A, F i g u r e 3 ) . To save l i g h t i n g
energy, the managing electrical engineer had implemented a delamping program independent of t h i s case study
and
well before the t e s t period. Because the illuminance levels were already lower t h a n the originald e s i g n l e v e l , maximum output of the lamps was d e s i r a b l e , even though the dimming system afforded the p o s s i b i l i t y of fureher reducing the luminous output. Second, the integrated luminous flux reaching each of the three s e t s of photosensors from the artificial 1Sghts alone (i.e., at night)
w a s taken as producing the criterion photocurrent for daylight-linked
d i d a g in a zone (B, F i g u r e 3). Therefore, light reaching the
photosensors from natural and a r t i f i c i a l sources t h a t produced a photocurrent larger than the "night t i m e " criterion resulted in a
reduction of the luminous output from the ceiling lamps. Increasing the amount of l i g h t reaching the photosensors would dim the output of the luminaires u n t i l a l m e r l i m i t , 20% of maximum output, was reached (C,
Figure 3).
Protocol
For three weeks prior to the actual testing period, the energy consumption rate ( k i l m a t t hours/hwr) was measured durkng working hours in bath the test and reference areas, whfLe the d l d n g system was in the "manual" mode. This rate (or average load) d i d n o t vary by more
than 2% in either area for every monitored p e r i o d during this pretesting
session.
O n the first day of operating the dimmfng system in t h e "automa~ic" mode, however, occupants complained about low task brightness. On
checking the site it was agreed that the task brightnesses were very low despite "a l o t of l i g h t
in
the a f f l c e areab*. The dimmfng system wasq u i c k l y returned to the manual mode.
During nonworking hours over a one week p e r i o d , adjustments were
made to the dimming s y s t m
i n
an effort t o make the luminous environmentacceptable to the occupants. Because light could reach the sensors d i r e c t l y from the windrrws, circular b a f f l e s vere fitted on the sensors
(Figure 4) to l i m i t t h e i r phetosensitive f i e l d to the floor and task
areas. This appeared to be s t i l l inadequate f o r e l e v a t i n g task
brightness levelst The criterion photocurrent necessary far d i d n g was
increased so that more light from the w i n d w s was required b e f o r e
dinunkng took place. F i n a l l y , in Zone 1, which was p e r i o d i c a l l y bathed
with direct s u n l i g h t , the minimum output of the lamps was e l e v a t e d from
20% t o 50%. Therefore whatever the natural 1um;lnous conditions i n Zone 1 were, the output from the lamps would never be lesa than half of
maxi~mrm. Figure 5 i l l u s t r a t e s the changes designed to make the lumfnoue
environment acceptable to the occupants and more conducfve t o good
visual performance.
After these modifications, msniroring was c a r r i e d out between
January 10 and September 2, 1981. The dimming system performed r e l i a b l y throughout the t e s Ling period and no f a r t h e r complaints about the
l i g h t i n g conditions were r e g i s t e r e d by the occupants. Rearranging the o f f i c e furnfture and partttions t o
make
better use of d a y l i g h t might a l s o have eliminated workersf complaints about the l i g h t h g .RE SUETS Illudnance Measurements
Rough illuminance measurements w e r e taken In bath the reference and t e s t areas under the o r i g i n a l operating conditions (before the dimming
system was installed) and after 100 hours in the pretesting session. Illuminance measurements were always taken (a) a t n i g h t , ( b ) in the center of the area away from partitions, (c) directly under one luminaire, and ( d ) with a "standard" position for the hand-held
instrument. After Installation, when the output of the lamps In the test area
was
maximum, the illuminance waa about: the same as i t had been o r i g i n a l l y (illuminances ranged from 680-720 1x1. The illuminance in*
Sensors used with dimudng systems integrate luminous flux from allareas within t h e i r photosensitive f i e l d ukthout regard for luminous v a r i a t i o n s . In an o f f i c e with regular, closely-spaced c e i l i n g luminaires, the distribution of flux reflected ta a ceiling-mounted
sensor
is
r e l a t i v e l y u n f f o m at night. Conversely the distribution offlux reaching a ce~ling-mounted sensor from windows on one s f d e of an o f f i c e c a n be q u i t e inhomogeneous. Similar l u d n o u s variations seen
by occnpants can k both uncomfortablel D~ p 3 b 4 and deleterious to v i s u a l performance5 t6. As phatosensors, unlike human occupants, disregard luminous inhomogeneities, the response of the sensor
the reference area, however, went from about 700 lx t o about 900 lx, an Increase in excess of 20% aver both t h e pretest readtng and the t e s t
area illuminance.
Three factors contributed to these results: (1) higher luminous
o u t p u t s from new lamps, ( 2 ) differences
in
ballast characteristics inthe two areas, ( 3 ) l o w operating voltage supplied to the lighting.
The higher illuminance in the reference area is e a s i l y explained by
the f f r s t factor: new lamps have higher l u m i n m s output, and, because
the other t w o factors
were
h e l d constant, higher illuminances w e r e obtained. The change in b o t h ballasts and laraps in the test area,however, coincidently compensated f o r one another at t h e Pow operating voltage, resulting in the same illuminance.
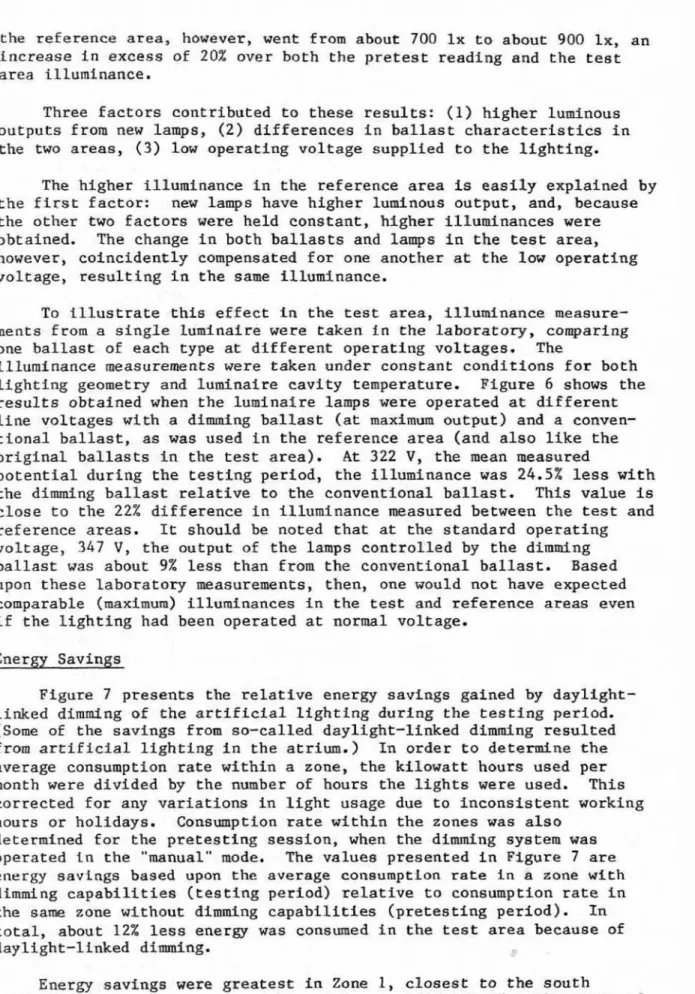
To i l l u s t r a t e t h i a e f f e c t in the test area, illuminance meaeure-
ments from a single luminaire were taken i n the Laboratory, comparing one ballast of each type at d i f f e r e n t operating voltages. The
illuminance measurements were taken under constant conditions for both l i g h r i n g geometry and lumtnaire cavity temperature. Figure 6 shows the
r e s u l t s obtafned when the l u m i n a i r e lamps w e r e operated a t d i f f e r e n t
l i n e voltages with a d i d n g ballast (at maximum output) and a conven-
t i o n a l ballast, as was used in the reference area
(and
also like the original ballastsin
the test area). At 322 V, t h e mean measuredpotential during the testLng period, t h e illuminance was 24.5X less d t h
the dimming ballast relative t o the conventional ballast, This valve i s
close t o the 22% difference in illuminance measured between the test and
reference areas.
It
should be noted that at the standard operatingvoltage, 347 V , the output of the lamps controlled by the dimming ballast was about 9% less than from the conventional b a l l a s t . Based
upon these laboratory measurements, then, one would not have expected comparable (maximum) illumFnances dn the test and reference areas even
if the l f g h t i n g had been operated at normal voltage. Energy Savings
Figure 7 presents the r e l a t f v e energy savings gained by daylight-
l i n k e d dimming of t h e a r t i f f c i a 1 l i g h t i n g during the testing period. (Some of the savings from so-called d a y l i g h t - l i n k e d dimming resulted from artificial lighting in the atrium,) In order to determine the
average consumption rate within a zone, the ktlowatt hours used p e r
month w e r e divided by the number of hours the Efghts were used. This corrected for any variations in light usage due t o inconsistent working hours or holidays. Consumption rate within the zones was also
derermined for the pretesting session, when the dimming system was operated in t h e "manual"' mode. The values presented in Figure 7 are energy savings based upon the average consumptLon rate in a zone with
dtmming capabilities (testlng p e r i o d ) relative to consumption r a t e in the same zone without dimming capabilities (pretesting p e r i o d ) . In
t o t a l , about 12% less energy was consumed i n the test area because of
daylight-linked dimming.
Energy savings were greatest in Zone 1, closest to the south
diffuse and
direct natural fllumination. Further, there w a s ad unknown amount of window blind manipulation by the occupants. Modest andrelatively constant energy savings
were
also observed in Zone 3 , c l o s e s t t o the atrium, Skylights and artificial incandescent lamps in theatrlum provided some indirect i l l u m i n a t i o n , and consequently, energy
constmption i n t h i s zone
was
reduced. Energy savings In Zone 2, themiddle zone, were apparent only durPng winter months; these s m a l l
savings resulted from deeper penetration o f d i r e c t s u n l i g h t into t h i s
test zone from the south windows, Because the energy savings in Zones 2
and 3 were not correlated, and because the savings in Zone 2 were zero
f o r mast months, it was assumed that Zones 1 and 2 were unaffected by
light from the atrium. Thus these results i n d i c a t e savings from windows and f rum the a d j acent atrium separately.
An addletonal, but not precisely determined, amount of energy was saved in the t e s t area relative to the reference area. From measure-
ments obtained from the one sampled dimming ballast and the one sampled conventional ballast, relative energy savings can be estimated far the test and reference areas. Using the same 40 W lamps, the measured power consmption for t h e conveatioual hallast: was 96.6 W; f o r the dZmming
ballast it was 81.2 W. These values agree f a l r l y closely w i t h t h e i r rated powers ( 9 7 W and 83 W, respectively). A t 322 V, t h e mean measured potential s u p p l i e d t o the lighting in the test and reference areas, the pcrwer consumption dropped to 99.2 W f o r the conventional ballast and 6 3 . 8 W for the dimming ballast. Extrapolating t o predict the relative
savings
in
the t e s t area, onewould
expect a savings o f about 30%relative to the reference area because the electrical p o t e n t i a l to the l f g h t i n g was 322
V.
This value would compare to an expected savllngs ofabout L6X if the p o t e n t i a l had been the standard 347 Y. These valvee
are
independent of the daylight-linked savings.One further point should be made about the energy c~nsumption and the IllurrtinatFon levels. For l f n e voltages between 315 and 355 V, the
flluminance provided by the lamps controlled by the dimming ballast was l e a s than if contralPed by the conventional ballast. However, the lamps
controlled by the d i d n g ballast produced abaut 8 1 more illuminance p e r w a t t under laboratory condftions than the same lamps
with
the conven-tional b a l l a s t . This difference in r e l a t i v e e f f i c i e n c y for the two
b a l l a s t s held almost independent of supply voltage. B a l l a ~ t Characterlstfcs
Power factors were also determined for t h e conventional and dimming ballasts. The l i n e voltage was varied from 315 to
355
VAC f o r these determinatfons. The conventional b a l l a s t provided power factors higherthan 0.9 fox these voltages, whereas the dlmming ballast p r o d d e d lagging power factors between 0.5 and 0 . 6 .
It should also
be
noted t h a t t h e l i n e current for the d3mmingballast, resulting from bath l i g h t i n g load and reactive load, was rated 67% higher than with t h e conventional ballast.
DISCUSSION
It
is d i f f i c u l t to generalize to other s i t e s and other daylight-l f n k e d dimming systems, b u t these results provide some useful guidelines
t o potential users of such a system.
F i r s t , A t appears that the daylight-linked systems must be
carefully integrated into the envtronment, because the response of the
photosensors fs not lfke the response of Ehe occupants' eyes. Sensors
are "blind" to glare and excessive luminance ratios that can cause
d ~ s c o m f o r t or low visual performance for occupants. Making the
daylight-l-lnked dimming system amenable t o occupants can reduce the
expected energy savings.
Second, given a luminous environment that does not reeult i n occupant dissatlafaction, i t is difficult t o obtain any energy savings from south window d a y l i g h t in interior zones, V i r t u a l l y no savings were
measured in the Interior zone (Zone 2) except for those winter months when there was deep penetration of sunlight. Only in peripheral zones
close to windows (or other sources of illumination) were daylight-linked
savings r e a l l z e d .
Third, dimming ballasts clearly consumed less energy and w e r e more
e f f l c t e n t than the conventional ballasts tested, These advantages would
he offset, however, by higher l i n e currents and paor power factor, that
could result in additional c o s t s f o r larger gauge wiring and adjuvant power factor correcting equipment.
Fourth, the b a l l a s t a employed in the dimdug system substantially
reduced the amount of energy consumed i n the t e s t area. These savings were realized by a coebFnatfon of daylight-linked d i d n g , relatively mote efficient ballasts, and a lower than t y p i c a l voltage s u p p l i e d to
t h e lighting system. Relatfve t o t h e reference area, savings were
estimated to be in the neighbourhood of 42%
f o r
the entire floor. Thebulk of these savings, about 302, would come from the combination of
dimming ballasts and lower than t y p i c a l operating potential. The other
12% would come from daylight. The 30% savings would have been about 1 6 %
if the potential had been the more t y p i c a l 347 V.
The combination of d i d n g ballasts and low operating p o t e n t i a l ,
hawever, a l s o produced lower illumination levels; without the relamping
procedure implemented prior t o the t e s t i n g sessfan, illumfnances would have been well below pretesting levels. Further, as the l a m p s aged I n
the test area, the early light l e v e l s were n o t mafatafned. Even at the
more t y p i c a l 347 V , t h e illuminance l e v e l s would have been a l i t t l e lower in the test area. The lower absolute illuminances produced by the
dimming sys tern should always be considered, especially f f reducing
voltage In buildfngs becomes more widespread with emphasis on energy
savings
.
F i f t h , a few estimates of energy savings from daylight-linked
dimming systems have been publ~shed ,7 '8 *9 P r e d i c t i n g savings from daylight 5s difficult because of the complexity in t h e interrelated
factors that a f f e c t dimming system performance, Some of these factors
are: natural and artificial lighting geometries, characrterfstics of i n t e r n a l partitfons, sensor desfgn, proximity
of
dfmming zone towindaws,
l i n e voltage, and occupant use of w i n d o w b l i n d s or manualswiltcMng. U n t i l algorithms consider these factors, it is difficult to predict accurately the actual energy and financial savings p o s s f b l e with dimmlng systems.
ACKNOWLEDGMENTS
The authors would llb to thank Dr. A.W. L e v y and Mr, R. Boudreau for their contributions at the i n c e p t i o n of the p r o j e c t and for
commenting on the manuscri-pt. We would a l s o l i k e to thank MT. T. West f o r permission to use t h e areas i n buildfng M-55.
REFERENCES
1. Kaufmaa, J.E. (ed.), T.E.S. Lighting Handbook, Reference Volume, Illuminating Engkneering Society, New York, 1981.
2. F r y , G.A., The Evaluation of Discomfort Glare, Illuminating
Engineering, November, 1956, p.722-728.
3 . S a n d e r s , J . E , , The Role of the Level and Diversity of Rorizontal
Illumination in an Appraisal of a S l m p l e O f f i c e
Task,
LLghtingResearch and Technology, V o l . 1, No. 1 , 1969, p.37-46.
4. Bennett, C . A , , The Demographic Variables of Discomfort Glare, Lighting Design and A p p l i c a t i o n , Janaury, 1977, p.22-24.
5. Kaufman, J.E, ( e d . ) , I.E.S. Lighting Handbook, A p p l i c a t i o n Volume, Illuminating Engineering S o c i e t y , New York, 1981(b).
6. Lythgoe, R . J . , The Measurement of Visual Acuity, H i s Majesty's
Stationary
Off
ice, Medical Research Council, Report No. 173, 1932.7. Hunt, D.R.G., S i m p l e e x p r e s s i o n f o r predfcting energy savings from
photo-electric control of l i g h t i n g . Lighting Research 6 Technology,
Vol. 9 , No, 2, 1977, p.93-102.
8. Hunt, D.R.G., Field s t u d i e s of the use of a r t i f i c i a l lighting in o f f i c e s : 2. Possible energy savings from photoelectric control8. Bullding Research Establishment Current Paper
(CP)
47/47,
1978,p.24-55.
9 . Anonymous, Automatic L i g h t i n g Output System, Energy Engineering,
--- S K Y L I G H T S
a
Z O N E 3 L U M I N A I R E S @P H O T O
S E N S O R C O N T R O L A R E A L U M I N A I R E S Z O N E 1 L U M I N A I R E S S E C U R I T Y L U M I N A I R E S Z O N E2
L U M I N A I R E SL U M I N A I R E S N O T
I N C L U D E DI N
S T U D Y o I N C A N D E S C E N T L A M P S P E R I M E T E R W I N D O WH O U S l N G
V E N E T I A N B L I N D S F I G U R E 1 T E S T S I T E A N D V A R I O U S S O U R C E SOF
I L L U M I N A T I O N C O N S I D E R E DI N
C A S E S T U D YFIGURE 2
C E I L I N G
M O U N T E D
PHOTOSENSORS U P P L I E D
B Y
M A N U F A C T U R E R
F I G U R E
4
C E I L I N G
MOUNTED
PHOTOSENSOR
M O D I F I E D
WITH
A
F I G U R E
5
H Y P O T H E T l C A L D I M M I N G S Y S T E M O P E R A T I O N
A
-
FICTITIOUS
C H A N G E
I N
A V A I L A B L E
D A Y L I G H T
I N
TEST
A R E A
B
-
RESPONSE
1OF
D I M M I N G SYSTEM TO
D A Y L I G H TBEFORE
M O D I F I C A T I O N S
C
-
RESPONSE
OFD I F M I N G
S Y S T E M TO D A Y L I G H TA F T E R M O D I F I C A T I O N S
I
-
EXTENDED P L A T E A URESULTS
FROM
ALTERA-
T r O N S TO Z C N E CONTROL U N I T
S E N S O R
C A L I B R A T I O N
ADJUSTMENT A N DFROM
INSTALLATION
O F B A F F L E
A R O U N D
PHOTO-
SEFESOR
2