HAL Id: hal-02379428
https://hal.archives-ouvertes.fr/hal-02379428
Submitted on 28 Nov 2019
HAL is a multi-disciplinary open access
archive for the deposit and dissemination of
sci-entific research documents, whether they are
pub-lished or not. The documents may come from
teaching and research institutions in France or
abroad, or from public or private research centers.
L’archive ouverte pluridisciplinaire HAL, est
destinée au dépôt et à la diffusion de documents
scientifiques de niveau recherche, publiés ou non,
émanant des établissements d’enseignement et de
recherche français ou étrangers, des laboratoires
publics ou privés.
Hugues Giovannini, Anne Sentenac
To cite this version:
Awoke Negash, Thomas Mangeat, Patrick C. Chaumet, Kamal Belkebir, Hugues Giovannini, et al..
Numerical approach for reducing out-of-focus light in bright-field fluorescence microscopy and
super-resolution speckle microscopy. Journal of the Optical Society of America. A Optics, Image Science,
and Vision, Optical Society of America, 2019, �10.1364/JOSAA.36.002025�. �hal-02379428�
Numerical approach for reducing out-of-focus
light in bright-field fluorescence microscopy and
superresolution speckle microscopy
Awoke Negash,
1Thomas Mangeat,
2Patrick C. Chaumet,
1Kamal Belkebir,
1Hugues Giovannini,
1AND
Anne Sentenac
1,*
1Aix Marseille Univ, CNRS, Centrale Marseille, Institut Fresnel, Marseille, France
2LBCMCP, Centre de Biologie Intégrative (CBI), Université de Toulouse, CNRS, UPS, France
*Corresponding author: [email protected]
Received 10 July 2019; revised 22 October 2019; accepted 22 October 2019; posted 23 October 2019 (Doc. ID 370695); published 19 November 2019
The standard two-dimensional (2D) image recorded in bright-field fluorescence microscopy is rigorously modeled by a convolution process involving a three-dimensional (3D) sample and a 3D point spread function. We show on synthetic and experimental data that deconvolving the 2D image using the appropriate 3D point spread function reduces the contribution of the out-of-focus fluorescence, resulting in a better image contrast and resolution. This approach is particularly interesting for superresolution speckle microscopy, in which the resolution gain stems directly from the efficiency of the deconvolution of each speckle image. © 2019 Optical Society of America
https://doi.org/10.1364/JOSAA.36.002025
1. INTRODUCTION
In fluorescence microscopy, the light emitted by any source located above or below the focal plane will eventually reach the detector. When the illumination is not localized about the focal plane, as in bright-field or structured illumination microscopy (SIM), it naturally excites the fluorescence of out-of-focus sample structures. The latter generates a slowly varying inten-sity background on the camera, which deteriorates the image contrast and may hinder the visualization of in-focus sample features. When a three-dimensional (3D) image stack of the sample is available, an appropriate 3D deconvolution permits reassigning of the out-of-focus blurred light to its origin [1–4]. This technique results in a significant improvement of the resolution and contrast of the sample reconstruction.
On the other hand, in the often-encountered case where only one image of the sample is recorded, the computational reduction of the out-of-focus light remains empirical. It is often performed through the subtraction of an in-homogeneous “background” that is estimated from the image usinga priori information on its frequency content (with a low-pass filtering, for example) [5]. In this study, inspired by some preliminary work in the framework of SIM [6], we propose a simple and physically sound technique for reducing the out-of-focus light when only one image is available. We first describe the method and apply it to classical bright-field fluorescence images; then we show its interest for superresolution speckle microscopy.
2. THEORY
The proposed reconstruction technique relies on the simple fact that the two-dimensional (2D) image obtained in a bright-field fluorescence microscope stems from a process involving a 3D sample and a 3D point spread function (PSF). More precisely, we assume that the sample fluorophore densitys is described over a 3D volume, which is discretized in P pixels, and the fluorescence lightI is recorded on the 2D camera surface with N pixels. In the following, I is considered an N-vector, while the fluorophore densitys is a P -vector. The intensity recorded by the camera can be modeled as
I = As, (1)
whereA is anN × P matrix defined by
As(xn, yn) = N X n=1 s(xp, yp, zp)h(xn−xp, yn−yp, 0 − zp), (2) where(xn, yn, 0) is the coordinate of the nth pixel on the
cam-era (z = 0 corresponding to the focal plane),(xp, yp, 0) is the
coordinate of thepth pixel in, and h is the 3D point spread function of the microscope.
From this image formation model one can infer a 2D to 3D reconstruction procedure that consists in searching iterativelys so as to minimize the cost functional,
N-vector data recorded experimentally on the camera. In this work, we have improved the deconvolution procedure by taking advantage of the positivity ofs . Introducing s =ξ2, we actually minimize the cost functional,
F(ξ) =
N
X
n=1
kMnmes−(Aξ2)nk2. (4)
The minimization is performed following a standard gradient algorithm as detailed in Ref. [7]. More precisely, at iterationi,ξ is modified along
ξi+1=ξi+αdi, (5)
wherediis the Polak–Ribière combination of the gradients ofF
with respect toξ, gi, andgi−1with
gi= −2ξiAtri, (6) and the residueri is equal toMmes−Aξ2−1
n . [8] Note thatri
is anN-vector, giis a P -vector, and Atis aP × N matrix. We use the early stopping of the iterative process to introduce a Tikhonov-like regularization [9]. Basically, when noise-induced artifacts such as hot spots or a granular background start to appear in the reconstruction, the process is stopped.
Basically, the 2D-to-3D inverse technique amounts to esti-mate a 3D sample so that its 3D convolutionrestricted to the focal plane best matches the recorded image. Of course, this approach is not expected to estimate properly the sample outside the focal plane, due to the lack of constraining data, but it is hoped to partly reallocate the out-of-focus light away from the focal plane. In all the following reconstructions, both the camera surface and are discretized along the same square meshing in the transverse plane so that P = PxPyPz and M = PxPy.
The number of planesPztaken in the reconstruction and their
spacing1zare chosen to describe accurately the axial variation
of the point spread function and to cover the depth of field of the objective. We have observed that increasing the number of planes beyond this limit did not bring any improvement in the reconstructions.
3. RESULTS
A. Synthetic Data
We first check our algorithm on synthetic data and compare the 2D-to-3D deconvolution procedure to a classical 2D decon-volution. Note that, for a fair comparison, the deconvolutions are performed using the same conjugate gradient technique and account for the positivity of the sought parameter.
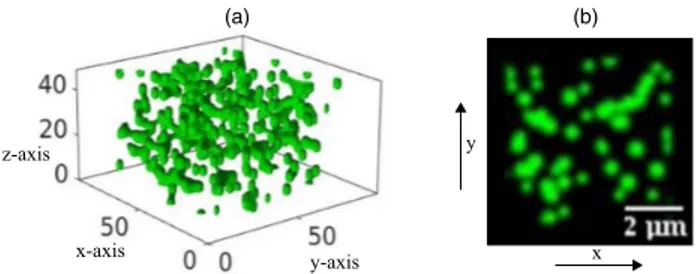
We have generated a synthetic 3D object composed of ran-domly distributed microspheres (of diameter 0.6 µm) in a volume of 100 voxels × 100 voxels × 50 voxels, as shown in Fig.1(a). We assume a wavelength of 550 nm, numerical aper-ture (NA) of 0.95, pixel size in the transverse plane of 69 nm and in the axial direction of 183 nm. We estimate numerically the 3D point spread function of the microscope with the expression
Fig. 1. Synthetic microscopy experiment. (a) The 3D sample is composed of randomly distributed microspheres discretized in a box of 100 voxels × 100 voxels × 50 voxels of size 64 nm. (b) Selectedx y section through the center of the 3D sample that corresponds to the focal plane.
(a) (b) (c) (d)
(e) (f) (g) (h)
Fig. 2. Demonstration of the interest of 2D-to-3D deconvolution on a synthetic fluorescence image. The sample is made of a random superposition of fluorescent beads (see Fig.1). (a) Section at the focal plane of the 3D sample; (b) section at the focal plane of the 3D image stack obtained via the convolution of the 3D sample with the 3D point spread function of the microscope. The out-of-focus fluorescence stemming from the beads above and below the focal plane is clearly visible. (c) 2D deconvolution using a 2D point spread function (Airy function) of the bright-field image (b). (d) Section at the focal plane of the 3D deconvolution of the 3D image; (e) 2D-to-3D deconvolution of (b) taken at the focal (central) plane. (f )–(h) Estimated out-of-focus contributions from the 2D-3D deconvolution at a distance of 185, 370, and 555 nm above the focal plane, respectively.
given in Ref. [7]. Convolving the 3D object with the 3D point spread function and adding Poisson noise (with a maximum of 40,000 photons per pixel) yields a 3D stack of images from which we extract the one at the focal plane. A section of the sam-ple at the focal plane and its image are shown in Figs.2(a)and
2(b). The 2D deconvolution of the image using the standard 2D Airy point spread function is shown in Fig.2(c). In addi-tion, we apply a 3D deconvolution procedure to the 3D stack of images and display the result restricted to the focal plane in Fig.2(d). We show in Figs.2(e)–2(h)the 2D-to-3D deconvo-lution obtained at and above the focal plane, respectively. We observe that the 2D-to-3D reconstruction at the focal plane [Fig.2(e)] is very similar to the 3D deconvolution [Fig.2(d)] and is significantly better than the classical 2D deconvolution [Fig.2(c)]. As expected, the reconstructions obtained above and below the focal plane carry some of the out-of-focus fluorescence [Figs.2(f )–2(h)], although they are not able to recover the beads that are outside the focal plane. To obtain a 3D reconstruction
from a 2D image, one would need a stronger constraint on the object than the sole positivity (high sparsity, for example) and also a 3D-to-2D point spread function that does not dim too rapidly the object high transverse frequencies when the latter moves away from the focal plane, such as the one engineered in Ref. [10].
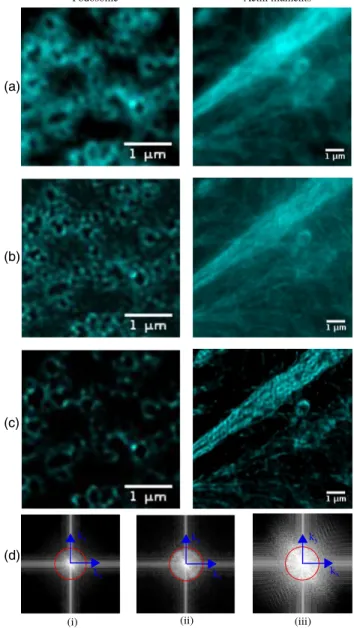
B. Experimental Data
In Fig.3, we illustrate the potential of the 2D-to-3D reconstruc-tion on experimental images of tagged podosomes and dense actin filaments emitting at 520 nm. One image of the samples is recorded under bright-field illumination using a 100×, 1.49 NA oil immersion objective. The number of planes taken for the 2D-to-3D reconstruction is equal to nine, with an axial step size of 100 nm. We observed that the noise-induced artifacts
(a)
(b)
(c)
(d)
Fig. 3. Experimental images of podosomes (left column) and dense actin filaments (right column). (a) Raw bright-field images; (b) 2D deconvolution; (c) 2D-to-3D deconvolution; (d) (i–iii) Fourier trans-forms of (a)–(c), respectively. The red circle shows the optical transfer function cutoff frequency.
appeared later in the iterative process with the 2D-to-3D decon-volution than with the 2D decondecon-volution. The former yields better contrasted images with less granular background than the latter (Fig.3). It is seen that the reconstruction obtained with the 2D-to-3D deconvolution exhibits frequencies beyond the optical transfer function cutoff. This result is a consequence of the use of a positivity prior in the inversion scheme. However, it should always be taken with caution, as the positivity constraint has been shown to induce some artifacts such as the thinning and dimming of weakly marked features.
The efficiency of the 2D-to-3D reconstruction makes it a par-ticularly adaptive tool for superresolution speckle fluorescence microscopy. Speckle illumination in fluorescence microscopy has been first introduced for improving the optical sectioning of the image [11]. More recently, it was proposed as an alternative to SIM for forming superresolved images when the control (and the knowledge) of the light grid patterns are difficult to obtain, (for example, in the case of strong sample distortion or when the imaging is done over long period of time [12]). Superresolution speckle microscopy consists in illuminating the sample with many uncontrolled speckle patterns and forming numerically a superresolved reconstruction from the stack of low-resolution speckle images. Presently, the most efficient and simplest recon-struction technique consists in deconvolving each speckle image under sparsity or positivity constraints and summing them. The deconvolution of the speckle images aims at recovering the product of the fluorophore density with the illumination. Now the latter is sparser and thus better adapted to sparsity or positivity constraints than the fluorophore density alone [7,13]. Thus, deconvolving speckle images under sparsity or positivity constraints yields spatial frequencies beyond the PSF cutoff that are more likely to be meaningful than those obtained when processing an image obtained under homogeneous illu-mination. Yet, the out-of-focus background that appears on the images, even under speckle illumination, is most detrimental to the activation of these constraints. Thus, using the 2D-to-3D reconstruction (using the positivity constraint) for processing each speckle image seems a particularly appropriate approach for superresolution speckle microscopy (when only one plane of the sample needs to be imaged). It is worth noting that, contrary to the data processing applied to speckle images for improving the optical sectioning, which consists in taking the variance or higher moments of the image stack, the average of the 2D-to-3D deconvolved speckle images maintains, in principle, the linear dependence between the reconstruction and the sample.
When L uncontrolled speckles illuminate the sample suc-cessively, theith image can be modeled using Eq. (2), except thats is now replaced by si =ρSi, whereρ is the fluorophore
density andSiis the intensity of theith speckle. The 2D-to-3D
deconvolution applied to each speckle image separately yields a 3D estimation ˆsiofsifrom the 2Dith image. Then, assuming
that the speckle average is homogeneous, one estimates the fluorescence density via ˆρ =6L
i=1
ˆ
si. Thus, in practice, the only
modification of the 2D-to-3D deconvolution procedure in speckle (or any other structured illumination) configuration lies in the additional step of averaging the deconvolved images.
To illustrate the interest of the 2D-to-3D deconvolution procedure on speckle data, we have considered a 2D planar
(c) (d)
(e) (f)
Fig. 4. Interest of 2D-to-3D deconvolution in speckle superres-olution microscopy on synthetic beads. (a) Bright-field image from homogeneous illumination; (b) low resolution image under one speckle illumination. The data are deteriorated with Poisson noise with a maximum of 10,000 photons per pixel for the bright-field image (corresponding to 100 photons per pixel maximum for the speckle images). (c) 2D deconvolution of the bright-field image; (d) aver-age of the 2D deconvolution of each speckle imaver-age; (e) 2D-to-3D deconvolution of the bright-field image; (f ) average of the 2D-to-3D deconvolution of each speckle image. It is clearly the best approach to remove the out of focus light.
beads sample corresponding to the section depicted in Fig. (1) and added a quasi-homogeneous fluorescent plane at two wave-lengths below the focal plane to increase the out-of-focus light. We have simulated a classical bright-field image and 100 speckle images [see Figs. 4(a)and 4(b)]. Then, we compare the 2D-to-3D and 2D deconvolution procedures on the speckle and bright-field data. The average of the 2D-to-3D deconvolution of each speckle image yields the best removal of the out-of-focus background (see Fig.4).
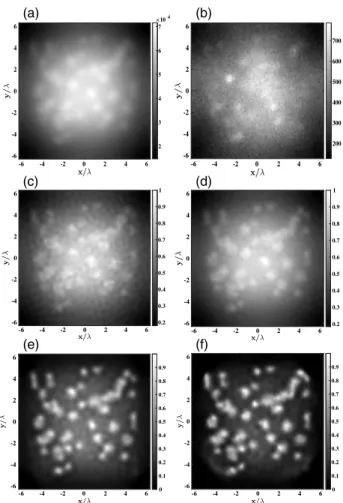
The same comparison is performed in Fig.5on experimental speckle data. We have recorded 100 images of the vimentin sample under uncontrolled speckles. The speckle 2D-to-3D reconstruction outperforms all the other techniques in terms of contrast and resolution.
Fig. 5. Interest of 2D-to-3D deconvolution in speckle superreso-lution microscopy on experimental data stemming from a vimentin sample. (a) Bright-field image of vimentin filaments (average of 100 speckle images); (b) one raw speckle image; (c) 2D deconvolution of the bright-field image; (d) 2D-to-3D deconvolution of the bright-field image; (e) average of the 2D deconvolved speckle images; (f ) average of the 2D-to-3D deconvolved speckle images.
4. CONCLUSION
In conclusion, 2D-to-3D deconvolution should be preferred to standard 2D deconvolution for improving images of fluores-cence microscopes. It dims the out-of-focus fluoresfluores-cence and significantly ameliorates the contrast and resolution. We have shown the efficiency of this technique on bright-field images and pointed out its major interest for superresolution speckle microscopy.
Funding. Erasmus Mundus Doctorate Program Europhotonics (159224-1-2009-1-FR-ERA MUNDUS-EMJD).
Acknowledgment. Awoke Negash is supported by the Erasmus Mundus Doctorate Program Europhotonics. We also acknowledge INSERM Plan Cancer 2014-2019. The authors, for the preparation of the samples, acknowledge R. Poincloux
and A. Bouissou, IPBS, UMR 5089, Toulouse, France; E. Vega and A. Mazard of Genotool TRI, I2MC, Toulouse, France. REFERENCES
1. S. Bolte and F. P. Cordelière, “A guided tour into subcellular colo-calization analysis in light microscopy,”J. Microsc.224, 213–232 (2006).
2. W. Wallace, L. H. Schaefer, and J. R. Swedlow, “A workingperson’s guide to deconvolution in light microscopy,” BioTechniques 31, 1076–1097 (2001).
3. J. G. McNally, T. Karpova, J. Cooper, and J. A. Conchello, “Three dimensional imaging by deconvolution microscopy,”Methods19, 373–385 (1999).
4. M. G. Gustafsson, D. Agard, and J. Sedat, “I5m: 3d widefield light microscopy with better than 100nm axial resolution,”J. Microsc.195, 10–16 (1999).
5. J. C. Waters, “Accuracy and precision in quantitative fluorescence microscopy,”J. Cell Biol.185, 1135–1148 (2009).
6. A. Jost, E. Tolstik, P. Feldmann, K. Wicker, A. Sentenac, and R. Heintzmann, “Optical sectioning and high resolution in single-slice structured illumination microscopy by thick single-slice blind-SIM reconstruction,”PLoS ONE10, e0132174 (2015).
7. A. Negash, S. Labouesse, N. Sandeau, M. Allain, H. Giovannini, J. Idier, R. Heintzmann, P. C. Chaumet, K. Belkebir, and A. Sentenac, “Improving the axial and lateral resolution of three-dimensional fluo-rescence microscopy using random speckle illuminations,”J. Opt. Soc. Am. A33, 1089–1094 (2016).
8. E. Polak and G. Ribiere, “Note sur la convergence de méthodes de directions conjuguées,” Rev. Fr. Inf. Rech. Opér. Sér. Rouge 3, 35–43 (1969).
9. M. Bertero and P. Boccacci, Introduction to Inverse Problems in Imaging (Institute of Physics, 1998).
10. S. R. P. Pavani, M. A. Thompson, J. S. Biteen, S. J. Lord, N. Liu, R. J. Twieg, R. Piestun, and W. E. Moerner, “Three-dimensional, single-molecule fluorescence imaging beyond the diffraction limit by using a double-helix point spread function,”Proc. Natl. Acad. Sci. USA106, 2995–2999 (2009).
11. C. Ventalon and J. Mertz, “Quasi-confocal fluorescence sectioning with dynamic speckle illumination,”Opt. Lett.30, 3350–3352 (2005). 12. E. Mudry, K. Belkebir, J. Girard, J. Savatier, E. L. Moal, C. Nicoletti, M.
Allain, and A. Sentenac, “Structured illumination microscopy using unknown speckle patterns,”Nat. Photonics6, 312–315 (2012). 13. S. Labouesse, A. Negash, J. Idier, S. Bourguignon, T. Mangeat, P.
Liu, A. Sentenac, and M. Allain, “Joint reconstruction strategy for structured illumination microscopy with unknown illuminations,”