Publisher’s version / Version de l'éditeur:
Cement and Concrete Composites, 26, Apr 3, pp. 217-233, 2004-04-01
READ THESE TERMS AND CONDITIONS CAREFULLY BEFORE USING THIS WEBSITE.
https://nrc-publications.canada.ca/eng/copyright
Vous avez des questions? Nous pouvons vous aider. Pour communiquer directement avec un auteur, consultez la
première page de la revue dans laquelle son article a été publié afin de trouver ses coordonnées. Si vous n’arrivez pas à les repérer, communiquez avec nous à PublicationsArchive-ArchivesPublications@nrc-cnrc.gc.ca.
Questions? Contact the NRC Publications Archive team at
PublicationsArchive-ArchivesPublications@nrc-cnrc.gc.ca. If you wish to email the authors directly, please see the first page of the publication for their contact information.
NRC Publications Archive
Archives des publications du CNRC
This publication could be one of several versions: author’s original, accepted manuscript or the publisher’s version. / La version de cette publication peut être l’une des suivantes : la version prépublication de l’auteur, la version acceptée du manuscrit ou la version de l’éditeur.
For the publisher’s version, please access the DOI link below./ Pour consulter la version de l’éditeur, utilisez le lien DOI ci-dessous.
https://doi.org/10.1016/S0958-9465(03)00041-6
Access and use of this website and the material on it are subject to the Terms and Conditions set forth at
Electrochemical evaluation of the performance of corrosion-inhibiting systems in concrete bridges
Qian, S. Y.; Cusson, D.
https://publications-cnrc.canada.ca/fra/droits
L’accès à ce site Web et l’utilisation de son contenu sont assujettis aux conditions présentées dans le site
LISEZ CES CONDITIONS ATTENTIVEMENT AVANT D’UTILISER CE SITE WEB.
NRC Publications Record / Notice d'Archives des publications de CNRC:
https://nrc-publications.canada.ca/eng/view/object/?id=f6b453a6-ec0c-4b96-a9c3-7a33cc36b000 https://publications-cnrc.canada.ca/fra/voir/objet/?id=f6b453a6-ec0c-4b96-a9c3-7a33cc36b000
Electrochemical evaluation of the performance of corrosion-inhibiting systems in concrete bridges
Qian, S.; Cusson, D.
NRCC-45400
A version of this document is published in / Une version de ce document se trouve dans : Cement and Concrete Composites, v. 26, no. 4, May 2004, pp. 217-233
Electrochemical evaluation of the performance of
corrosion-inhibiting systems in concrete bridges
Shiyuan Qian and Daniel Cusson
Institute for Research in Construction, National Research Council Canada Ottawa, Ontario, Canada K1A 0R6
Abstract
Corrosion of steel reinforcement is the most significant factor in the deterioration of reinforced concrete structures. Applying corrosion inhibitors to the concrete to reduce the rate of corrosion of the steel has been shown to be effective. Generally, the inhibitor is adsorbed on the surface of the metal and modifies the composition and structure of the double layer or induces passivity. Many types of inorganic- and organic-inhibiting systems are available, including concrete admixtures, rebar coatings and migrating compounds. Conclusions from previous studies on the effectiveness and field performance of these inhibiting systems on corrosion of reinforcing steel are controversial.
In this paper, eight commercial corrosion-inhibiting systems for reinforcing steel in concrete have been evaluated from a newly reconstructed barrier wall of a highway Bridge. Results from a five-year field survey and laboratory electrochemical study are presented. The methods and procedures of testing these systems are also discussed.
Keywords: Concrete admixture, corrosion inhibitor, reinforcement corrosion, half-cell potential polarisation resistance, cyclic voltammetry.
Introduction
Corrosion of reinforcing steel is a widespread problem in concrete bridges. Corrosion inhibitors are considered one of the most cost-effective solutions. During the last 15 years, they have been used more and more in both new and existing reinforced concrete bridges.
Earlier studies of corrosion inhibitors focussed on sodium benzoate1,2, various nitrites (sodium, potassium and barium) and chromates/dichromates3,4 as concrete admixtures to inhibit corrosion in reinforced concrete. None of these performed satisfactorily without detrimental effects on the strength development of the concrete. A study of the efficiency of calcium and sodium nitrite as inhibitors was conducted in the 1970s5. Since then, calcium nitrite has been a commercially available admixture, and has been studied and used extensively for reinforced concrete in the presence of chlorides6,7,8. During the 1990s, a number of organic inhibitors were developed, including various amines, alkanolamines, their salts with organic and inorganic acids9 and emulsified mixtures of esters, alcohols and amines10.
Corrosion inhibitors used in concrete may be inorganic or organic, or both. The inhibition mechanisms of these substances are still not very clear. It is believed some inorganic-inhibiting
compounds act as anodic inhibitors, by increasing the rate of formation of an oxide film barrier on the reinforcing steel surface. Some organic compounds inhibit corrosion by adsorbing onto the steel surface, preventing the breakdown of the passive film.
There are many corrosion-inhibiting systems commercially available: rebar coatings, concrete admixtures and coatings applied to the concrete surface. Very little information is available on the effectiveness of these corrosion-inhibiting systems in field applications, especially on long-term performance. Engineers and bridge owners have difficulty selecting corrosion inhibitors that are more effective in the long term for new concrete structures, and compatible with the repair materials and original concrete in restorative applications.
In this paper, the effectiveness and performance of eight commercial corrosion-inhibiting systems were evaluated. Ten consecutive spans of a newly reconstructed barrier wall at the Vachon Bridge, located north of Montreal, Canada were selected as the test site for the
application of the corrosion-inhibiting systems (including epoxy-coated rebar and a control span for comparison). Field corrosion measurements, such as half-cell potential, linear polarization, concrete resistivity and measurements on special embedded rebar ladders were performed (details on the ladder construction and location can be found elsewhere11). Comparison laboratory corrosion tests were also carried out to evaluate the effects of inhibitors on the corrosion of reinforcing steel in saturated Ca(OH)2 and simulated concrete pore solutions. Tests
on concrete properties were also performed to support the study of corrosion-inhibiting systems.
EXPERIMENTAL
Field installation and exposure conditions
The rehabilitation work for this study included rebuilding ten 34-m spans of a concrete barrier wall using different corrosion inhibiting systems installed according to the manufacturers’ requirements. Steel reinforcement of the barrier wall consisted of eight 15-mm longitudinal bars in the wall cross-section (including 4 bars near the front surface), and 15-mm transverse bars spaced at 230 mm along the wall length. The grade of steel was 400R (CAN/CSA G30.18-M), except in one of the 10 test spans (Span 12) in which epoxy-coated reinforcement was used. The concrete had a water-cement ratio of 0.36 and a 28-day compressive strength of 45 MPa tested on moist-cured 150x300 mm cylinders. More details on the field site, including the concrete mixture design and a layout of the test spans can be found in a previous publication11.
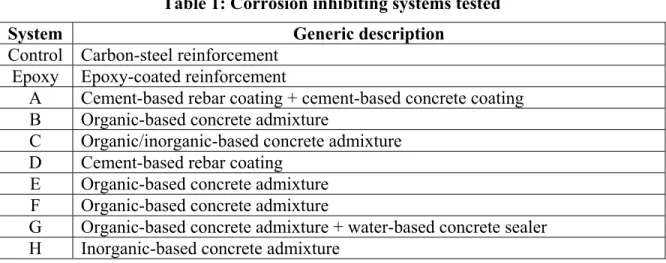
The commercial names of the corrosion inhibiting systems tested in this study were not identified in the paper to maintain confidentiality as requested by the product suppliers. As shown in Table 1, each test system has been given an arbitrary label and a brief generic description.
Over the 5-year duration of the project, the bridge structure has experienced harsh climatic conditions, as typically encountered in Canada. Ambient temperature extremes ranged from –25°C in the winter to +30°C in the summer. Several wet-dry cycles (30-100% RH) and up to 23 freeze-thaw cycles were measured over 5 years. More details on the exposure conditions are presented in a separate paper12.
Severe restrained shrinkage cracking was observed in the barrier wall just a few days after construction13. The transverse cracks had an average spacing of 0.8 m and a maximum width of 0.3 mm. This raised a concern for premature rebar corrosion due to moisture and salt ingress. Such cracking usually leads to initiation of reinforcing steel corrosion and eventually results in spalling of the protective concrete cover.
Table 1: Corrosion inhibiting systems tested
System Generic description
Control Carbon-steel reinforcement Epoxy Epoxy-coated reinforcement
A Cement-based rebar coating + cement-based concrete coating B Organic-based concrete admixture
C Organic/inorganic-based concrete admixture D Cement-based rebar coating
E Organic-based concrete admixture F Organic-based concrete admixture
G Organic-based concrete admixture + water-based concrete sealer H Inorganic-based concrete admixture
Field corrosion surveys
On-site corrosion surveys were performed once a year on the 10 spans and on the special rebar ladders embedded in the bridge spans. The survey included measurement of half-cell potential, the corrosion rate and concrete resistivity. A saturated copper/copper sulphate reference electrode (CSE) and a Fluke multimeter 867B were used to measure the half-cell potentials following the procedure provided in ASTM C876-99. The measurements were taken at 110 mm, 345 mm, 550 mm and 780 mm from the top of the barrier walls and horizontally at 300-mm intervals over the central 15-m section of each 35-m span of the barrier wall. Half-cell potential readings were also taken at the centre point of each bar of the two special rebar ladders installed in every span of barrier wall. These rebar ladders had different concrete covers after being embedded in the barrier wall, with only 13 mm of concrete cover for the upper bar and 25 mm, 38 mm and 50 mm respectively for the others. This design allows for the earliest possible evaluation of the performance of applied corrosion-inhibiting systems.
Corrosion rates and concrete resistivity were measured using sensors A and B of a GECOR 6 instrument (James Instruments Inc., Chicago Illinois). In each span, measurements were taken on vertical and horizontal bars at cracked and uncracked locations. Two to three readings were taken and then averaged at each location.
Laboratory corrosion studies
Electrochemical tests
The electrochemical tests performed in the laboratory included cycle voltammetry, linear polarization and AC impedance spectroscopy. These tests were made using a Solartron SI 1287
(or 1286) Electrochemical Interface coupled with SI 1260 (or 1255) HF Frequency Response Analyzer (FRA) controlled by a PC computer. Zplot and Corr-Ware software were used to perform the electrochemical measurements. All tests were performed in the electrochemical cells composed of three electrodes: a working electrode (steel sample), a counter electrode made of platinum foil or mesh, and a saturated calomel reference electrode (SCE, -74 mV vs. Cu/CuSO4).
A Luggin capillary was used to reduce the IR drop between the SCE reference and the working electrodes.
Two types of electrolyte were used for the laboratory study: a saturated calcium hydroxide [Ca(OH)2] solution (pH=12.6) and a simulated pore solution containing 0.002 M Ca(OH)2 + 0.45
M NaOH + 0.26M KOH (pH=13.5)14,15,16. The inhibitors were added to the cells in the concentrations according to the product instructions one week after electrode samples were immersed in the solution. Afterward, sodium chloride (NaCl) was added to the cells. Its concentration was increased 0.2% to 0.5% every week until corrosion developed.
Two sets of steel samples were prepared for each inhibitor test. The electrochemical tests for the first set included half-cell potential and linear polarization; for the second set, cyclic
voltammetry was also carried out. Cyclic voltammetry was measured at a scan rate of 1 mV s-1. The potential range of the cyclic voltammetry was adjusted for different inhibitors to avoid excess reduction or oxidation reactions on the electrode surface. The samples were tested daily. Three linear polarization measurements were taken and an average polarization resistance, RP,
was calculated. For the second set, a cyclic voltammogram was performed at the end of the linear polarization measurements. Attempts to correct the IR-drop between the Luggin capillary of the reference electrode and the working electrode were made using an AC impedance method. The effect of the IR-drop was found to be negligible on these measurements because of the high electrical conductivity of the electrolyte and the small current measured.
Preparation of electrodes
Electrode samples used for the laboratory experiment were machined from reinforcing steel to a size of 10 mm in length and 8 mm in diameter. Each was soldered to a 10-gauge copper wire, which was isolated from the solution by a glass tube. The carbon steel samples then were embedded in epoxy to protect all other areas and left with only one side (surface area of 50.2 mm2) exposed to the solution. Before testing, samples were polished with 320, 400 and 600 silicon carbide paper and immersed in a saturated calcium hydroxide solution or a simulated pore solution.
RESULTS FROM THE FIELD CORROSION SURVEYS Half-cell potential
General considerations
The half-cell potential or corrosion potential of a steel rebar can be used as an indication of the probability of corrosion activity in that location. The voltage reading between a standard half-cell and a steel rebar is usually compared to guideline values (ASTM C876-99), which have been
empirically developed to indicate relative probabilities of corrosion activity. Evaluation of a large number of closely spaced half-cell potentials taken on a structure is necessary to evaluate the probability of corrosion of the reinforcing steel in concrete.
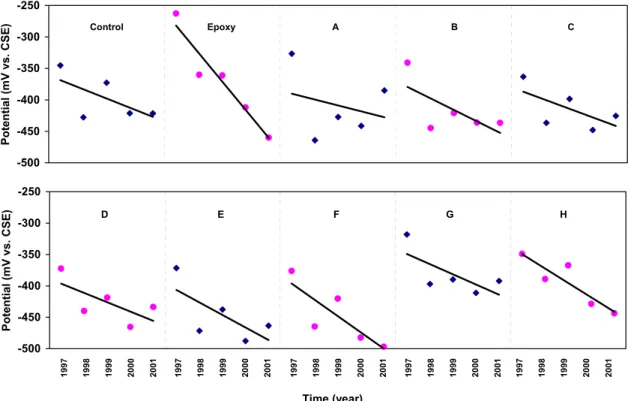
The field half-cell potential measurement of the reinforcing steel in the test barrier wall was carried out once a year. The half-cell potentials measured along the top three horizontal bars in the barrier wall were analysed using the linear regression method and are shown in Fig. 1. The half-cell potentials show gradual shifting toward more negative values in almost all spans, due probably to the depletion of the oxygen concentration in the concrete (since high-density concrete was used) or the initiation of reinforcing steel corrosion at cracked areas.
Discussion on interpretation of potentials by the ASTM standard
According to the ASTM standard, there is a 90% probability that reinforcing steel corrosion is occurring if half-cell potentials vs. Cu/CuSO4 are more negative than –350 mV. This guideline is
valid only when regular concrete is used and the concrete thickness is 4 cm to 6 cm, and it is not saturated by water. Under other conditions, the interpretation of the half-cell results requires modification based on knowledge of the particular corrosion conditions. For instance, oxygen depletion caused by water-saturated concrete can shift half-cell potential more negatively by 100 mV to 200 mV17. However, if the potential is substantially negative and overcomes the shift caused by other factors and at the same time the corrosion current shows high values, then a high probability of steel corrosion can be predicted with confidence.
For all spans, the half-cell potential values were about –350 mV starting in 1997 (except in the span with epoxy-coated rebar and Span G). Results were much more negative than –350 mV in 1998. According to the ASTM standard, all spans should be rated as having a high probability of corrosion. Obviously, it is not suitable to rate rebars in all these spans as having a high
probability of corrosion within one or two years. Since high-density concrete was used for the barrier wall, the oxygen depletion in the concrete could result in the negative potential shift. It was noticed that earlier age cracks had appeared in many spans. These cracks could cause early corrosion of reinforcing steel near these areas due to moisture, oxygen and salt ingress, leading to the localized negative potential shift. Another possible factor to consider is the presence of different corrosion-inhibiting systems in the test spans. Some inhibiting systems are concrete admixtures containing organic or inorganic chemicals. Some are rebar coatings or concrete coatings. The addition of concrete admixtures containing ions possibly affects the half-cell potential readings. The application of a coating on concrete might further enhance the oxygen depletion. The characteristics of the concrete probably would be changed more or less by application of these inhibitors.
Treatment of the measured potentials by the cumulative frequency method
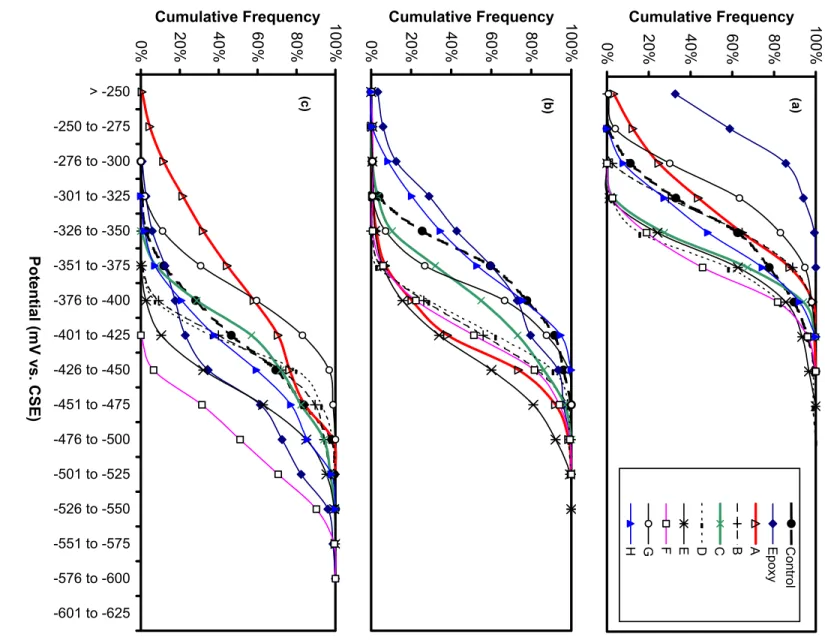
Figure 2 show the cumulative frequencies of half-cell potentials calculated for the 10 spans carried out in June 1997, May 1999 and May 2001. Curves with gentle slopes have wide
potential spreads (i.e., the potential readings vary widely with the locations on a given span - see the curves for Span 12 and System A in Fig. 2c). The more negative potentials are usually indicative of a higher probability of corrosion activity, if the same type of concrete is used or if
the addition of the corrosion-inhibiting systems does not significantly interfere with the measurement of half-cell potential.
It can be seen that the half-cell potentials were less negative and spread in a narrower range (except the epoxy-coated span) in 1997 (Fig. 2a) than in 1999 (Fig. 2b). The half-cell potentials shifted toward a more negative value and the potentials spread over a wider range in 2001 (Fig. 2c). This indicates corrosion, or the effect of corrosion-inhibiting systems, in these spans is developing. The cumulative frequency curve on Span 12 with epoxy-coated reinforcement shows less negative half-cell potentials than all other spans in 1997 due to the high resistance of epoxy coating on the reinforcement surface. Its curve had a substantial negative shift and exhibited a shape with three plateaus in the 2001 results (Fig. 2c). This is probably due to the galvanic effect of corrosion on the epoxy-coated rebar. Some areas with damaged or scratched coatings, or near the cracked areas, would corrode more than the other areas leading to a wider potential spread. It has been noted that Span G also showed quite high (less negative) half-cell potential readings in 1997, 1999 and 2001. This is probably related to the high resistance of the concrete due to the corrosion-inhibiting system applied on this span.
Span F showed the most negative potential followed by the span with epoxy-coated rebar and Span E. The control span showed an average half-cell reading while Spans G and A showed less negative half-cell potential. It seems the inhibiting systems have some effect on the half-cell potential of rebar in the concrete. Therefore, evaluation of the corrosion in these concrete spans cannot be based on the half-cell potential values. It is necessary to analyse the results together with other corrosion measurements.
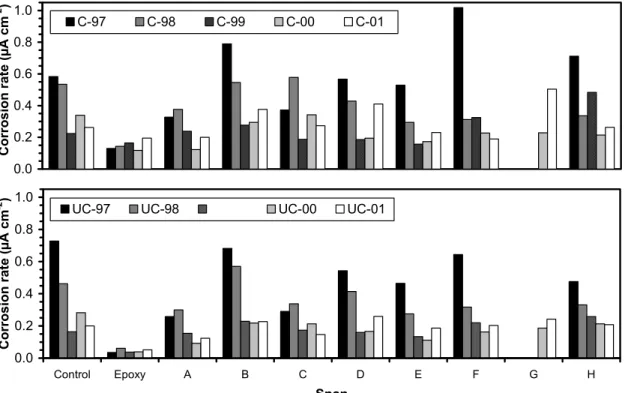
Corrosion rate and concrete electrical resistance
The average corrosion rates obtained on 10 spans are shown in Fig. 3. They were calculated based on the results from field measurements at cracked locations (C) and uncracked locations (UC) on each span. The corrosion rates were low in all spans in 2001 although some spans showed relatively high rates in 1997 and 1998 probably due to the formation of the passive film. The rates decreased with time in almost all spans probably related to the presence of the
corrosion inhibiting systems or to oxygen depletion at the metal surface. Comparing the
corrosion rate obtained at different locations, one can find a higher rate at cracked locations than at uncracked locations in most spans, as expected. On the span with epoxy-coated rebar, the corrosion rate was small, especially at uncracked locations, but increased continuously over time, probably due to the metal dissolution at the damaged or scratched areas of the epoxy coating near the cracked areas. In Span G, equipment limitations made it impossible to measure the corrosion rates in the first three years, due to the poor conductivity of concrete as a result of the application of this corrosion-inhibiting system on the concrete. Considering the overall corrosion rates measured in 2001, they were in the low rate category (≤0.5 µA cm2)18 in all spans and locations, indicating the effects of inhibiting systems. More time is needed to evaluate the effectiveness of the corrosion-inhibiting systems.
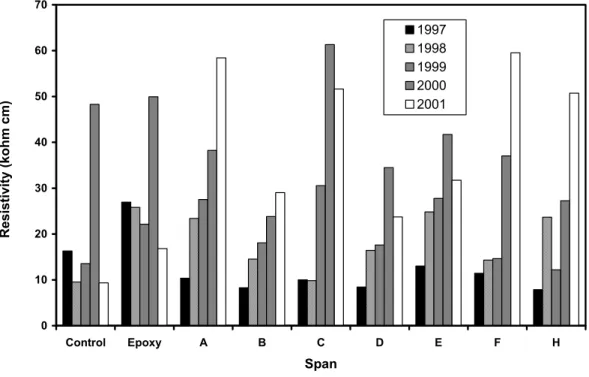
The results of on-site concrete resistivity are shown in Fig. 4. Concrete resistivity was relatively small in 1997 in most spans, probably due to the high moisture content in the new concrete. It increased with time in most spans except in Spans 12 (epoxy) and 21 (control).
In Span 12 (epoxy), the resistivity decreased with time, probably due to the deterioration of the epoxy coating on the rebar. GECOR6 equipment was used to measure the resistivity between the rebar surface and a counter electrode, which was placed on the top of the concrete cover.
Although a pulse signal was used to perform the measurement, the resistivity of epoxy on the rebar surface was still included in the overall resistivity readings. Therefore, the coatings applied to the rebar can lead to a higher resistivity (see 1997 reading on Epoxy span in Fig.4). The development of corrosion at the areas where the epoxy coating was very thin or had been scratched can lead to reduced overall resistivity. Due to some measurement difficulties, the resistivity results on Span G were not shown in Fig. 4.
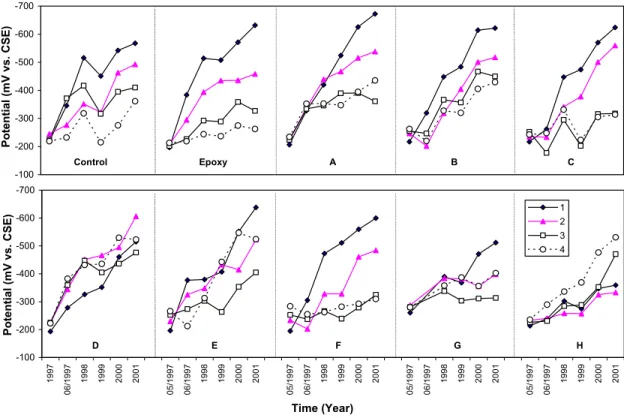
Measurements on the rebar ladders
Half-cell potentials measured on the special rebar ladders in each span are shown in Fig. 5. The numbers 1, 2, 3 and 4 shown in this figure represent the rebar level from top to bottom with concrete cover thickness of 13 mm, 25 mm, 38mm and 50 mm, respectively. It can be clearly seen that the half-cell potentials become more negative with time in all spans. Half-cell
potentials have the most significant change on the top bars (Bar 1) and less change on the lower bars (Bars 2, 3 and 4) in most spans, including the control span (except in Spans D and H). This is because corrosion occurred sooner at the locations with a thinner concrete cover due to the salt ingress to the reinforcement (see next section).
The half-cell potentials had reached –500 mV to –600 mV vs. Cu/CuSO4 on the top bars with
thinner concrete cover (oxygen depletion was not likely) in many spans indicating the corrosion probability was high. On Span D, the half-cell potential difference between the bars is the smallest, although they also shifted to more negative values. On Span H, half-cell potentials on lower bars changed more significantly than on the top ones. This was not expected. The reason behind this unusual result is still not clear.
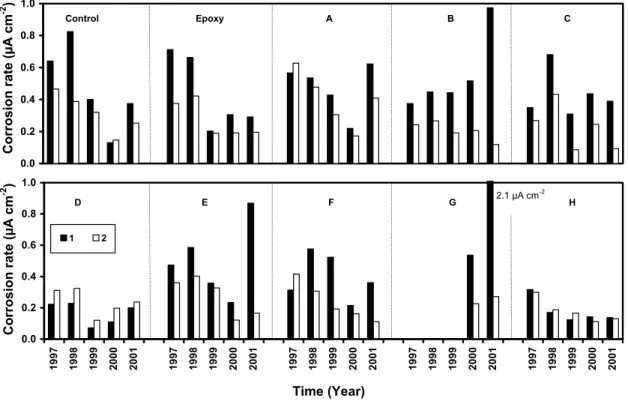
The corrosion rate was measured on the top two bars of embedded ladders in these 10 spans as shown in Fig. 6. The corrosion rate was only measured on the top two bars, because GECOR6 probe A could not fit on the areas for the measurements of the lower two bars due to the geometry of the barrier wall. The corrosion rate was much higher on the top bar than on the second bar in most spans (except in Spans D and H). This is because the top bar has a thinner concrete cover (13 mm) than the second bar (25 mm). Therefore, it takes less time for chloride to reach the reinforcing bars. On Spans E and G, a horizontal crack and rust stain along the top rebar were noticed. This is consistent with high corrosion rates observed at these locations in 2001. Corrosion rate on Span G was not measured in the first three years due to the poor conductivity of the concrete caused by the application of this corrosion-inhibiting system. In Spans D and H, the corrosion rate was quite low on both the top and second bars. Recall the half-cell potential behaviour (Fig. 5), which was also different from other spans. It is clear that
both potential and current behaviours are related to the specific corrosion-inhibiting systems applied on the spans.
Chloride ion content and profile
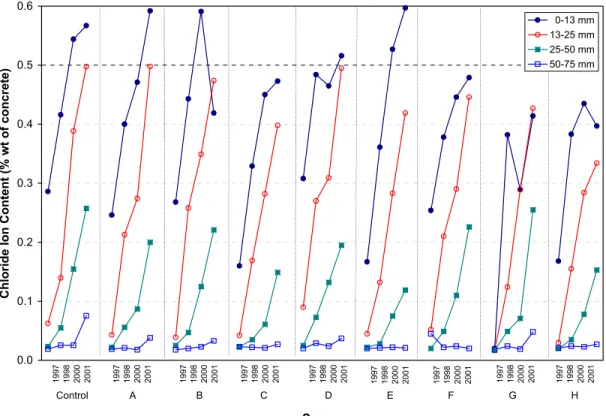
To measure the ability of the concrete to prevent the ingress of chloride ions after the addition of the inhibiting systems, the chloride ion content was measured. The total content of chloride ions by weight of concrete was determined by the potentiometric titration of chloride with silver nitrate described in ASTM C114-00. The test was carried out in the 10 concrete spans at four depths (0 mm to 13 mm, 13 mm to 25 mm, 25 mm to 50 mm, and 50 mm to 75 mm) and at four different times. The results are shown in Fig. 7. Each data point is the average of two tests. The initial chloride ion content was also measured on cylinders of concrete cast in the field but not exposed to de-icing salts. An average value of 0.006% and a standard deviation of 0.0009% were found, which can be considered negligible.
In general, the chloride ion content of any given concrete increases significantly over time. In the first 13 mm of concrete, the chloride ion concentration in most spans is very high, exceeding the critical threshold value of 0.1% by mass of concrete19 even after six months of exposure to de-icing salts (May 1997). Spans G and H seem to have done quite well with a chloride
concentration of about 0.4% in 2001, which was lower than for the other spans.
The chloride content also decreased significantly with the concrete depth from 0 mm to 13 mm, to 50 mm to 75 mm. Twenty-five millimetres to 50 mm corresponds to a depth where the
reinforcement would normally be located in older bridges, since most of the corrosion-inhibiting systems tested in this study can be used in rehabilitation applications as well. The chloride concentration in all spans was well below the 0.1% threshold value after the first two winters (1997-1998). Concrete in Spans A, C, E, G and H was still below the chloride threshold limit in 2000. By 2001, all concretes had exceeded the critical threshold value. Concrete E performed the best by exceeding the corrosion threshold value by only 20% after 4.5 years at the depth of 25 mm to 50 mm.
The 50 mm to 75 mm depth is where the reinforcement is located in the Vachon Bridge barrier walls. All concretes had chloride ion concentrations below the threshold value of 0.1% after 4.5 years. Concretes E, F and H are among the ones that blocked chloride ions the most effectively at the depth of 50 mm to 75 mm based on the 2001 results.
Corrosion of reinforcing steel should not begin if the concrete cover is between 50 mm and 75 mm, since the chloride concentration is below the threshold. However, corrosion is very likely to develop with cracked concrete when the chloride concentration is high. This is probably the reason for localized corrosion causing the half-cell potential to shift to more negative values.
RESULTS FROM THE LABORATORY CORROSION STUDIES Corrosion inhibitors tested in saturated Ca(OH)2
The effect of inhibitors on cyclic voltammetry
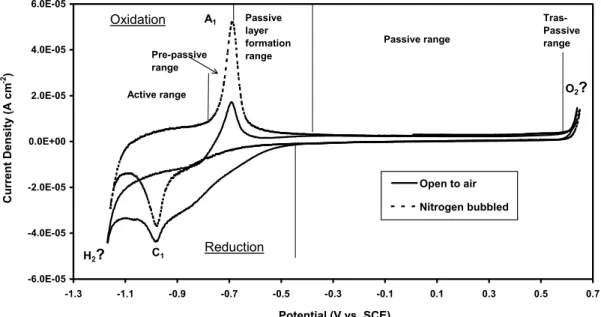
Measuring cyclic voltammetry in the presence of inhibitors can provide useful information on the reactions of anodic oxidation and cathodic reduction on the carbon steel surface. This is achieved by scanning the applied electrode potential from the open circuit potential toward the anodic region, followed by scanning in the reverse cathodic direction and so on. The scan rate was slow enough to allow the reaction peaks to appear clearly on the cyclic voltammogram. A cyclic voltammogram measured on a carbon steel electrode in a saturated Ca(OH)2 solution
with bubbling nitrogen (to purge oxygen out of the cell) is shown in Fig. 8 (dash line). The peak A1 at –0.7 V vs. SCE has been assigned to ferrous-ferric (Fe(OH)2/FeOOH) transformations20.
The range of potentials that are more positive than this peak correspond to the passive layer formation. In the flat region, the current is very small, but still enough to maintain the passive film on the steel surface. When the potential scans positively and becomes larger than about +0.62 V vs. SCE, the current rises suddenly and oxygen evolution becomes the predominant reaction.
The cathodic peak (C1) at –0.98 V vs. SCE is a counterpart of the anodic peak (i.e., ferric-ferrous
transformations). With more negative values of around –1.17 V vs. SCE, the negative current increases rapidly and hydrogen evolution becomes the predominant reaction.
When the electrode cycled in the cell open to air (solid line in Fig. 8), the currents shifted toward more negative values in both the cathodic and anodic scans for potentials more negative than –0.45 V. This is caused by the reduction of dissolved oxygen on the steel surface.
Cyclic voltammetry was measured at a carbon steel electrode in saturated Ca(OH)2 in the
presence of different inhibitors as shown in Fig. 9. In the presence of Inhibitor C, E or F, the cyclic voltammograms show that the reaction peaks on both anodic and cathodic scans
disappeared due to the adsorption of organic compounds on the steel surface. This experiment was carried out in a cell open to air, but the current for the cathodic oxygen reduction (dissolved oxygen) was also reduced significantly. The chemical adsorption on the steel was stronger in the presence of Inhibitor E than with Inhibitors C and F, since the current on the cyclic
voltammogram was suppressed to a very small value in the presence of Inhibitor E. It is believed that all three inhibitors contain organic compounds, which can be adsorbed on the steel surface forming an organic film. This works as a physical barrier against the corrosion process on the steel21,22.
The cyclic voltammogram in the presence of Inhibitor H shows a different behaviour. Both anodic and cathodic reaction currents have been increased due to the effect of this inhibitor. It is believed that this inhibitor reduces corrosion by enhancing the passive film on steel through oxidation of Fe2+ ions7. The increase in the anodic current is due to this oxidation reaction, but the increase in the cathodic current is just the counterpart of the anodic reaction.
The cyclic voltammogram in the presence of Inhibitor B shows a current reduction in the anodic scan. The peaks for ferrous-ferric transformations and its counter reaction are not as pronounced as on the steel surface in the absence of the inhibitor. The anodic current decreases with the increase in the cycle number. This is because this inhibitor also contains some organic
compounds that can adsorb on the steel surface and form an organic film leading to the reduction of the anodic and cathodic current. However, the organic film formation is slower in the presence of Inhibitor B than with Inhibitor E, C or F.
Relation between polarization resistance and chloride content
The linear polarization method is used to measure the corrosion rate based on the Stern-Geary equation: ) ( 3 . 2 corr a c c a P E i b b b b R i E corr + − = = ∆ ∆ (1) P corr R K E i K i = 1 ∆ ∆ = (2) where
∆E and ∆i are the changes of potential and current over a small range near the open circuit potential;
Ecorr and icorr are the corrosion potential and current;
ba and bc are the Tafel slope of anodic and cathodic polarization curves; and
RP is the electrochemical polarization resistance.
The values of ba and bc can be deduced by correlating the values of ∆E/∆i measured on the steel
sample. When the steel surface is passivated, the Tafel slope is often difficult to deduce. Then the K value (often a value from 0.026 to 0.052 is used) is very likely to be inaccurate and/or to change markedly as steel surface condition change in the solution. Therefore, the value of 1/RP
will be used for comparing corrosion on the carbon steel surface since the corrosion rate is proportional to 1/RP. Usually, values of 1/RP smaller than 1x10⁻⁵ (ohm cm2)-1 are indicative of a
low corrosion rate.
The relation of 1/RP and the chloride concentration in the presence of various inhibitors is plotted
in Fig. 10. In the presence of Inhibitor B, 1/RP started to rise at around 0.7% NaCl and then
increased rapidly with increases in the concentration of NaCl. 1/RP started to rise at 1.1% NaCl
but increased at a slower rate in the presence of Inhibitor F due to the adsorption of organic compounds. In the control experiment (i.e., with no inhibitor present in the saturated Ca(OH)2
solution), 1/RP rose at around 2% NaCl and increased at quite a fast rate. 1/RP increased at
around 3% NaCl in the presence of Inhibitor C. In the presence of H, the values of 1/RP remained
small with increases in the concentration of NaCl up to 6% but then suddenly increased. In the presence of Inhibitor E, the 1/RP value remained small all the way up to 8%.
The above results clearly indicate that the presence of inhibitors can delay the corrosion process on carbon steel in the saturated Ca(OH)2 solution. Inhibitors E and H are quite effective in this
solution, followed by Inhibitors C and F. Only Inhibitor B was not effective in delaying corrosion. It has to be noted that Inhibitor B was applied together with a rebar coating in the bridge span. In the lab test, only the admixture inhibitors were tested; no rebar coating was applied.
Fig. 11 shows another set of results of 1/RP vs. chloride concentration. The difference between
these results and those in Fig.10 is that the cyclic voltammetry was performed after each increase in NaCl concentration. When the external potential is applied on the electrode, this changes the activation energy of the reaction on the electrode surface. If the passivation film approaches its critical condition in a certain concentration of NaCl, the extra anodic potential can overcome the reaction energy barrier and accelerate the process of dissolution of the passive film. 1/RP rises
suddenly at 0.5% NaCl in the presence of Inhibitor B or F. 1/RP starts to rise at 0.5% NaCl but
increases much more slowly in the presence of Inhibitor C. In the presence of Inhibitor H, the value of 1/RP remains small with increases in the concentration of NaCl up to 4.5%. Then, it
suddenly increases. While in the presence of Inhibitor E, 1/RP remains small up to 6% NaCl.
This result is in very good agreement with the one obtained without cycling the potential on the electrodes (Fig. 10).
Corrosion inhibitors tested in simulated pore solution
Cyclic voltammetry was also measured in a simulated pore solution containing 0.002 M Ca(OH)2
+0.45 M NaOH +0.26M KOH (pH = 13.5) in the presence of various inhibitors. The results show a behaviour similar to the curves shown in Fig. 9, where both anodic and cathodic currents were reduced significantly in the presence of Inhibitor E or F. A current reduction was also observed in the presence of Inhibitor C compared with the control sample. They all contain organic compounds, which can be adsorbed on the steel surface to form an organic film, acting as a physical barrier against corrosion on steel. It has been noted that these current reductions were not as significant as those measured in a saturated Ca(OH)2 solution indicating that the
adsorption or the effect of these organic compounds was not as strong as in the saturated Ca(OH)2 solution.
The cyclic voltammograms in the presence of Inhibitor B or H show similar behaviour as observed in the saturated Ca(OH)2 solution. The cathodic reduction reactions appear earlier, and
the anodic oxidation reaction currents show some increase due to the effect of these inhibitors which are believed to enhance the passive film on the steel surface.
The concrete admixtures used in the concrete on the bridge spans have been tested for their corrosion-inhibiting properties on carbon steel in a simulated pore solution containing 0.002 M Ca(OH)2 +0.45 M NaOH +0.26M KOH (pH = 13.5).
The relation of 1/RP and the chloride concentration is plotted in Fig. 12. 1/RP values were
determined by the linear polarization method (with cyclic voltammetry performed after each increase of NaCl concentration). 1/RP starts to rise at an NaCl concentration of 6% or greater for
surprising to see that 1/RP rose at NaCl concentrations of 3% to 4% in the presence of Inhibitor
E, earlier than for all the others. This inhibitor was very effective in the inhibition of corrosion in saturated Ca(OH)2 solution (pH = 12.6) up to 6% NaCl (cf. Fig. 10) but not as effective as other
inhibitors (or even no inhibitor) in this solution with a higher pH. This shows that Inhibitor E is more suitable for use in a saturated Ca(OH)2 solution with a pH of about 12.6. For field
application, this inhibitor is probably more effective in old concrete with a lower pH than in new concrete.
Rebar coatings tested on carbon steel electrodes
Corrosion-inhibiting systems produced by some of the participating companies include
cementitious coatings. The effect of these coatings on rebar corrosion has also been tested in an electrochemical cell by measuring corrosion potential and polarization resistance.
A cementitious-inhibitor coating is considered effective if the corrosion rate (or 1/RP) is lower in
a coated sample than in a cement-coated control sample at the same chloride concentration. Those samples coated with effective cementitious inhibitors should be able to withstand a greater salt concentration than those just coated with cement. The thickness, porosity and other physical characteristics of the coatings will affect the ability of chloride ions to penetrate to the rebar surface and the corrosion behaviour of the rebar sample. The cementitious and cement coatings were of the same thickness of approximately 1 mm in the laboratory tests.
Fig. 13 shows results from the sample coated with Portland Type 10 cement (control sample) and some cementitious rebar coatings. There is a drastic increase in 1/RP at day 16 at 1.0% NaCl on
the sample coated with cement. As more sodium chloride was added to the cell solution over time, 1/RP continued to increase. The corrosion potential, Ecorr, dropped from –200 mV to –600
mV vs. SCE and remained at this level with increased concentrations of NaCl. This indicates the chloride has reached the surface of the steel electrode and the steel surface is corroding.
In the sample coated with the cementitious rebar Coating D, 1/RP started to increase at day 63 (at
4% NaCl) and the corrosion potential, Ecorr, dropped from –300 mV to –650 mV vs. SCE. The
sample coated with the cementitious rebar Coating A started corroding at 4.0% NaCl (not shown in this figure). A drop in corrosion potential, Ecorr, as well as an increase in reciprocal
polarization resistance, 1/RP signal the onset of corrosion. For the sample using Coating G, 1/RP
started to increase significantly at day 135 (at 6% NaCl) and the corrosion potential, Ecorr,
dropped from –300 mV to –600 mV vs. SCE at the same time.
It is very clear that cementitious-inhibitor coatings were effective in inhibiting corrosion compared with the cement coating without an admixture-type inhibitor. In each case, 1/RP was
smaller and the corrosion potential was more positive for the inhibitor-coated sample than the cement-coated samples at equivalent NaCl concentrations.
PERFORMANCE COMPARISON AND RANKING
The relative performance of the corrosion-inhibiting systems varied from one test to another. Some systems performed well in one specific test but not in another. This made the identification of the effective corrosion-inhibiting systems difficult and challenging. To provide a meaningful comparison of the performance and identify the effective systems, a systematic approach was developed and is defined below.
To determine the performance of corrosion-inhibiting systems, only tests that directly related to the corrosion performance were selected and are listed in the first column of Table 2.
The results of the tests are indicated in the table along with their respective ranking, indicated in parenthesis underneath each result. For example, the first field test listed in the table is the half-cell potential measured on the main reinforcement. For this particular test, System F had the most negative half-cell potential (the median value of –487 mV measured in June 2001) and obtained a performance ranking of 10 (worst performance). In this test, the difference in potential between the first and last systems in the group is not big, at only 113 mV. It is possible to find two systems with the same rank in a given test if their results are identical (e.g., Systems B and D in the first field test).
For each category of tests, an overall performance ranking of the various systems was determined. It is the arithmetic average of the ranks for a given system as shown in the row entitled “Overall ranking” in Table 2. The system with the lowest overall number is considered to be the most effective for the category. Only best and second-best systems were marked as shaded cells in this table.
Ranking based on the field corrosion tests
The half-cell potentials of reinforcement given in Table 2 for the tests done on the main reinforcement are calculated based on a large number of measurement results. However, since the main reinforcement was protected by a 75 mm concrete cover, corrosion took a long time to begin and, therefore, the difference in the results in the group is not large. On the other hand, the results for the tests done on the ladders indicate average values on two ladders in each span. Since ladder bars were protected by a thinner concrete cover (13 mm to 25 mm), corrosion began sooner and had more effect. The difference in the results for a given test is larger and provides a more significant comparison.
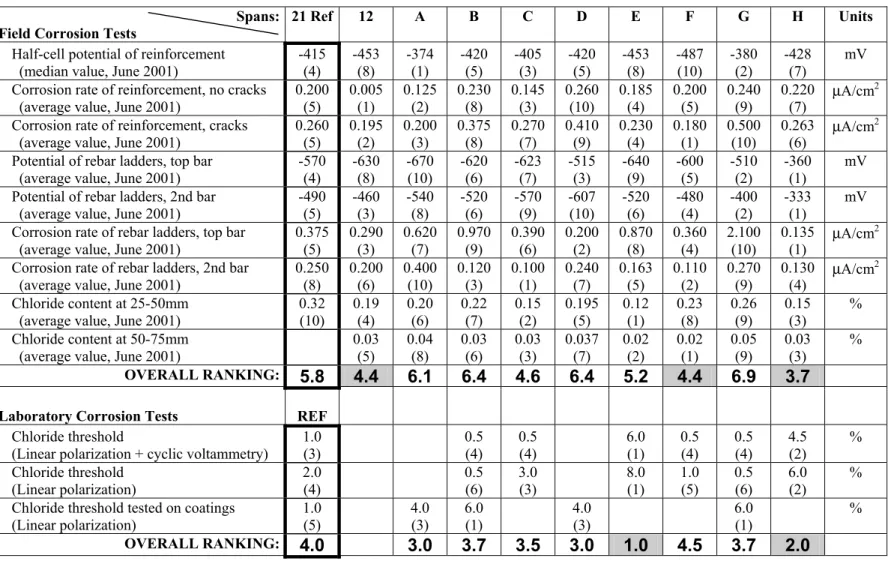
In general, the relative performance of a given system varied substantially from one test to another. However, the overall ranking of the field tests indicates that System H consistently had the best overall performance in the field with a score of 3.7. If only the field tests on the rebar ladders (thin concrete cover) were considered, an overall ranking of 1.75 would be obtained for System H, which would still be the best of the group. Two other systems had a relatively better performance in the field, namely the system in Span 12 (epoxy-coated reinforcement) and System F. They had an overall ranking of 4.4 which is considered much better than the ranking of 5.8 obtained by the control system in Span 21.
Ranking based on the laboratory corrosion tests
The first two tests in this category were conducted on corrosion-inhibiting admixtures, while the third test was done on rebar coatings. Note that the test results in this category might not
represent the performance of the full corrosion-inhibiting systems in the field, since some systems included both an admixture and a rebar coating. These lab results, however, may be significant to the manufacturers which also sell these products separately (i.e., not within a system) in other applications.
The ranking for the laboratory corrosion tests indicate that Systems E and H consistently got the best performance. They had overall rankings of 1.0 and 2.0, respectively, which is much better than the ranking of 4.0 obtained by the control system in Span 21.
Table 2: Performance ranking of the corrosion inhibiting systems
Spans: Field Corrosion Tests
21 Ref 12 A B C D E F G H Units
Half-cell potential of reinforcement (median value, June 2001)
-415 (4) -453 (8) -374 (1) -420 (5) -405 (3) -420 (5) -453 (8) -487 (10) -380 (2) -428 (7) mV Corrosion rate of reinforcement, no cracks
(average value, June 2001)
0.200 (5) 0.005 (1) 0.125 (2) 0.230 (8) 0.145 (3) 0.260 (10) 0.185 (4) 0.200 (5) 0.240 (9) 0.220 (7) µA/cm2 Corrosion rate of reinforcement, cracks
(average value, June 2001)
0.260 (5) 0.195 (2) 0.200 (3) 0.375 (8) 0.270 (7) 0.410 (9) 0.230 (4) 0.180 (1) 0.500 (10) 0.263 (6) µA/cm2 Potential of rebar ladders, top bar
(average value, June 2001)
-570 (4) -630 (8) -670 (10) -620 (6) -623 (7) -515 (3) -640 (9) -600 (5) -510 (2) -360 (1) mV Potential of rebar ladders, 2nd bar
(average value, June 2001)
-490 (5) -460 (3) -540 (8) -520 (6) -570 (9) -607 (10) -520 (6) -480 (4) -400 (2) -333 (1) mV Corrosion rate of rebar ladders, top bar
(average value, June 2001)
0.375 (5) 0.290 (3) 0.620 (7) 0.970 (9) 0.390 (6) 0.200 (2) 0.870 (8) 0.360 (4) 2.100 (10) 0.135 (1) µA/cm2 Corrosion rate of rebar ladders, 2nd bar
(average value, June 2001)
0.250 (8) 0.200 (6) 0.400 (10) 0.120 (3) 0.100 (1) 0.240 (7) 0.163 (5) 0.110 (2) 0.270 (9) 0.130 (4) µ A/cm2 Chloride content at 25-50mm (average value, June 2001)
0.32 (10) 0.19 (4) 0.20 (6) 0.22 (7) 0.15 (2) 0.195 (5) 0.12 (1) 0.23 (8) 0.26 (9) 0.15 (3) % Chloride content at 50-75mm
(average value, June 2001)
0.03 (5) 0.04 (8) 0.03 (6) 0.03 (3) 0.037 (7) 0.02 (2) 0.02 (1) 0.05 (9) 0.03 (3) % OVERALL RANKING: 5.8 4.4 6.1 6.4 4.6 6.4 5.2 4.4 6.9 3.7
Laboratory Corrosion Tests REF
Chloride threshold
(Linear polarization + cyclic voltammetry)
1.0 (3) 0.5 (4) 0.5 (4) 6.0 (1) 0.5 (4) 0.5 (4) 4.5 (2) % Chloride threshold (Linear polarization) 2.0 (4) 0.5 (6) 3.0 (3) 8.0 (1) 1.0 (5) 0.5 (6) 6.0 (2) % Chloride threshold tested on coatings
(Linear polarization) 1.0 (5) 4.0 (3) 6.0 (1) 4.0 (3) 6.0 (1) % OVERALL RANKING: 4.0 3.0 3.7 3.5 3.0 1.0 4.5 3.7 2.0
Overall performance ranking
It appears that System H consistently gave the best performance of the group during this five-year study. Two other approaches were used to analyse the data: one assessed the performance of each system compared to the control system, and the other assessed the performance of each system compared to the modified threshold values set for each test. Both approaches reached the same conclusions as those presented above.
It is important to mention that the field performance results obtained to date were based on measurements taken during a relatively short period of time. The performance of the different corrosion-inhibiting systems will certainly change after a longer period of time. Further monitoring is needed to confirm these results.
CONCLUSIONS
1. On-site corrosion surveys show the half-cell potentials are shifting toward more negative values. The difference in potential from span to span is also increasing. This indicates that corrosion, or the effect of corrosion-inhibiting systems, in these spans is developing.
2. Corrosion rates measured by linear polarization method show the rates were still low (≤0.5 µA cm2) in all spans and were increasing. It indicates more time is needed to see the significant corrosion activity and to evaluate the effectiveness of the
corrosion-inhibiting systems applied in these spans.
3. Half-cell potentials measured on the special rebar ladders embedded in the spans had reached –500 mV to –600 mV vs. Cu/CuSO4 on the top bars in many spans showing
the high corrosion probability in the locations with thinner concrete cover. The potentials on the lower bars were also shifting toward more negative values, indicating the corrosion probability was also increasing.
4. The cyclic voltammograms measured at the steel electrodes show that both anodic and cathodic currents reduced significantly in the presence of Inhibitor E, C or F. This is due to the chemical adsorption of organic compounds contained in these inhibitors. While in the presence of Inhibitor H, these currents were increased to enhance the passive film on the steel.
5. Most inhibitors presented in saturated Ca(OH)2 solution (pH=12.6) can delay the
corrosion process on carbon steel. Inhibitors E and H are quite effective in this specific solution, followed by Inhibitors C and F. Inhibitor B is less effective
compared with the results obtained in the same solution in the absence of an inhibitor. 6. In a simulated pore solution containing 0.002 M Ca(OH)2 +0.45 M NaOH +0.26M
KOH (pH = 13.5), the effectiveness of the inhibitors was not observed since the carbon steel electrode was also able to withstand an NaCl concentration of 6% before corrosion initiated.
7. Laboratory tests show cementitious inhibitor coatings applied directly on the rebar can delay or reduce corrosion compared with the cement-coated samples at equivalent NaCl concentrations in a saturated Ca(OH)2 solution.
8. Based on this five-year field study, System H has consistently given the best performance of the group. However five years is still relatively short. The
performance of the different corrosion inhibitor systems will certainly change with time. Further monitoring and study are needed to corroborate these findings.
ACKNOWLEDGEMENTS
The NRC’s Institute for Research in Construction wishes to thank its partners for their contributions to the project, in particular: the Ministry of Transportation of Quebec, Axim Concrete Technology, Caruba Holdings, Euclid Admixture Canada, Israel Richler Trading, Master Builders Technologies, Sika Canada, W.R. Grace & Co, and the Regional Municipality of Peel. The sustained assistance of Louis Marie-Bélanger and Daniel Vézina from MTQ is also gratefully acknowledged. The authors wish to thank the following people at NRC for their scientific and technical contributions to the project: Roger Willoughby, Noel Mailvaganam, Bruce Baldock, Nathalie Chagnon, Gordon Chan, Glendon Pye and Mark Arnott.
REFERENCES
1. Lewis, J. M., Mason, C. E. and Brereton, D. (1956): "Sodium benzoate in concrete", Civil Engineering and Public Works Review, 51(602), pp. 881-882.
2. Treadaway, K. W. and Russel, A. D. (1968): "Inhibition of the corrosion of steel in concrete - Part 2", Highways and Public Works, 36, pp. 40-41.
3. Griffin, D. F. (1975): "Corrosion inhibitors for reinforced concrete", Corrosion of Metals in Concrete, ACI SP-49, American Concrete Institute, pp. 95-102.
4. Berke, N. S. (1989): "Corrosion inhibitors in concrete", Corrosion 89, paper 445, NACE, Houston, Tx.
5. Rosenberg, A. M., Gaidis, J. M., Kossivas, T.G. and Previte, R.W. (1977):
"Corrosion inhibitor formulated with calcium nitrite for use in reinforced concrete", Chloride Corrosion of Steel in Concrete, America Society for Testing and Materials, Philadelphia, STP 629, pp. 89-99.
6. Berke, N.S. and Weil, T. G. (1992): "World-wide review of corrosion inhibitors in concrete", Advances in Concrete Technology, pp. 899-924.
7. El-Jazairi, B. and Berke, N. S. (1990): "The use of calcium nitrite as a corrosion inhibiting admixture to steel reinforcement in concrete", Corrosion of Reinforcement in Concrete, Elsevier Science Publishers Ltd., Wishaw, Warwickshine, UK, pp. 571-585.
8. Hope, B. B. and Ip, A. K. C. (1989): "Corrosion inhibitors for use in concrete", ACI Materials Journal, 86(6), pp. 602-608.
9. Mäder, U. (1994): "A new class of corrosion inhibitors", Proceedings of ‘Corrosion and Corrosion Protection of Steel in Concrete’, Ed. R. N. Swamy, Sheffield
10. Nmai, C. K., Farrington, S. A. and Bobrowski, G. S. (1992): "Organic-based corrosion-inhibiting admixture for reinforced concrete", Concrete International, 14(4), pp. 45-51.
11. Cusson, D., Mailvaganam, N. (1999): “Monitoring and Evaluation Techniques for Corrosion Inhibiting Systems in Reconstructed Bridge Barrier Walls,” Concrete
International, 21(8), August, pp. 41-47.
12. Cusson, D., Qian, S., Glazer, R. and Hoogeveen, T. (2002): “Remote monitoring of a rehabilitated concrete highway bridge – 5 years of results,” 2nd Material Specialty Conference of the Canadian Society for Civil Engineering, June, 10 pp. (accepted). 13. Cusson, D. and Repette, W. (2000): “Early-age cracking in reconstructed concrete
bridge barrier walls,” ACI Materials Journal, 97(4), July/August, pp. 438-446. 14. Mammoloti, L., Hansson, C. M. and Hope, B. B. (1999): “Corrosion inhibitors in
concrete Part II: Effect on chloride threshold values for corrosion of steel in synthetic pore solutions,” Cement and Concrete Research, 29, pp. 1583-1589. 15. Kitowski, C. J. and Wheat, H. G. (1997): “Effect of chlorides on reinforcing steel
exposed to simulated concrete solutions,” Corrosion, NACE international. 16. Ramirez, C. W., Borgard, B., Jones, D. and Heidersbach, R. (1990): “Laboratory
simulation of corrosion in reinforced concrete,” Materials Performance, December, pp. 33-39.
17. Qian, S.Y.; Chagnon, N. "Evaluation of corrosion of reinforcement in repaired concrete", 9th International Conference and Exhibition, Structural Faults and Repair 2001 (London, U.K. Jul, 2001), pp. 1-12, 2001.
18. Broomfield, J. P. (1996): “Field measurement of the corrosion rate of steel in concrete using a microprocessor controlled unit with a monitored guard ring for signal confinement,” In Techniques to assess the corrosion activity of steel
reinforced concrete structures, ASTM STP 1276, Ed.: N. S. Berke, E. Escalante, C.
K. Nmai and D. Whiting, American Society for Testing and Materials, pp. 91-106. 19. Stoltzner, E., Knudsen, A. and Buhr, B. (1997): “Durability of marine structures in denmark,” In: Proceedings of the Int. Conf. on Repair of Concrete Structures, From Theory to Practice in a Marine Environment, Editor: Aage Blankvoll, Norway. 20. Hinatsu, J. T., Graydon, W. F. and Foulkes, F. R. (1988): "Voltammetric behaviour
of iron in cement. I. Development of a standard procedure for measuring voltammograms", Journal of Applied Electrochemistry, 19, pp. 868-876.
21. Milsik, B. A., Tarvin, M. and Sparrow, G. R. (1989): "Surface analytical techniques in evaluation of VCI organic corrosion inhibitors on the surface chemistry of metals", Corrosion 89, Paper 607, NACE, Houston, Tx.
22. Brundle, C. R., Grunze, D. Grunze, Mäder, U. and Blank, N. (1996): "Detection and characterization of dimethylethanolamine-based corrosion inhibitors at steel surfaces. I. The use of XPS and ToF-SiMS", Surface and Interface Analysis, 24(9), pp. 549-563.
-500 -450 -400 -350 -300 -250 Potential (mV vs. CSE) Control Epoxy A B C -500 -450 -400 -350 -300 -250 Potential (mV vs. CSE) D E F G H Time (year) 1997 1998 1999 2000 2001 1997 1998 1999 2000 2001 1997 1998 1999 2000 2001 1997 1998 1999 2000 2001 1997 1998 1999 2000 2001
Figure 1: Half-cell potential obtained during the field surveys in 1997 to 2001 at the Vachon bridge.
0% 20% 40% 60% 80% 100% Cumulative Frequency Con trol E pox y A B C D E F G H 0% 20% 40% 60% 80% 100% Cumulative Frequency 0% 20% 40% 60% 80% 100% > -250 -250 to -275 -276 to -300 -301 to -325 -326 to -350 -351 to -375 -376 to -400 -401 to -425 -426 to -450 -451 to -475 -476 to -500 -501 to -525 -526 to -550 -551 to -575 -576 to -600 -601 to -625 Pot e ntial ( m V v s . CSE) Cumulative Frequency (c ) (b) (a) Figure 2: Cum u
lative frequency distributions
of half-cell potential: (a) June 1997; (b)
May 1999; and (c) May 2001.
0.0 0.2 0.4 0.6 0.8 1.0
Corrosion rate (µA cm
-2 ) C-97 C-98 C-99 UC-99 C-00 C-01 0.0 0.2 0.4 0.6 0.8 1.0 Control Epoxy A B C D E F G H Span
Corrosion rate (µA cm
-2 ) UC-97 UC-98 UC-00 UC-01
Figure 3: Corrosion rate measured at cracked (C) and un-cracked (UC) locations on the barrier wall in 1997 to 2001.
0 10 20 30 40 50 60 70 Control Epoxy A B C D E F H Span Resistivity (kohm cm) 1997 1998 1999 2000 2001
-700 -600 -500 -400 -300 -200 -100 1997 06/ 1997 1998 1999 2000 2001 05/ 1997 06/ 1997 1998 1999 2000 2001 05/ 1997 06/ 1997 1998 1999 2000 2001 05/ 1997 06/ 1997 1998 1999 2000 2001 05/ 1997 06/ 1997 1998 1999 2000 2001 Potential (mV vs. CSE) 1 2 3 4 D E F G H -700 -600 -500 -400 -300 -200 -100 Potential (mV vs. CSE) Control Epoxy A B C Time (Year)
Figure 5: Half-cell potential measured on the rebar ladders embedded in the barrier wall (concrete cover thickness: 13mm at bar 1; 25mm at bar 2; 38mm at bar 3; and 50mm at bar 4).
0.0 0.2 0.4 0.6 0.8 1.0 1997 1998 1999 2000 2001 1997 1998 1999 2000 2001 1997 1998 1999 2000 2001 1997 1998 1999 2000 2001 1997 1998 1999 2000 2001 Time (Year)
Corrosion rate (µA cm
-2 ) 1 2 0.0 0.2 0.4 0.6 0.8 1.0
Corrosion rate (µA cm
-2 )
Control Epoxy A B C
D E F G H2.1 µA cm
-2
Figure 6: Corrosion rate measured on the rebar ladders embedded in the barrier wall (concrete cover thickness: 13mm at bar 1 and 25mm at bar 2).
0.0 0.1 0.2 0.3 0.4 0.5 0.6 Span C h loride Ion C ontent (% wt of concrete) 0-13 mm 13-25 mm 25-50 mm 50-75 mm 1997 1998 2000 2001 Control A B C D E F G H 1997 1998 2000 2001 1997 1998 2000 2001 1997 1998 2000 2001 1997 1998 2000 2001 1997 1998 2000 2001 1997 1998 2000 2001 1997 1998 2000 2001 1997 1998 2000 2001
Figure 7: Total chloride ion content measured on concrete cores taken from the barrier wall at various depths.
-6.0E-05 -4.0E-05 -2.0E-05 0.0E+00 2.0E-05 4.0E-05 6.0E-05 -1.3 -1.1 -0.9 -0.7 -0.5 -0.3 -0.1 0.1 0.3 0.5 0.7 Potential (V vs. SCE) Cur re nt Density (A cm -2 ) Open to air Nitrogen bubbled O2? H2? A1 C1 Passive range Passive layer formation range Tras- Passive range Oxidation Active range Pre-passive range Reduction
Figure 8: Cyclic voltammograms obtained on carbon steel in the electrochemical cell open to air or purged with N2.
Figure 9: Cyclic voltammograms obtained on carbon steel in saturated Ca(OH)2
0.0E+00 1.0E-04 2.0E-04 3.0E-04 4.0E-04 5.0E-04 6.0E-04 0 1 2 3 4 5 6 7 8 % NaCl 1/R p (ohm cm 2 ) -1 Control B C E F H
Figure 10: Values of 1/Rp measured on carbon steel in saturated Ca(OH)2 solutions with
0.0E+00 1.0E-04 2.0E-04 3.0E-04 4.0E-04 5.0E-04 6.0E-04 0 1 2 3 4 5 6 % NaCl 1/Rp (ohm cm 2 ) -1 Control B C E F H B F Control C H E
Figure 11: Values of 1/Rp measured on carbon steel in saturated Ca(OH)2 solutions with
increased chloride content in the presence of inhibitors (cyclic
0.0E+00 2.0E-05 4.0E-05 6.0E-05 8.0E-05 1.0E-04 1.2E-04 1.4E-04 1.6E-04 1.8E-04 0 1 2 3 4 5 6 7 % NaCl 1/R p (ohm cm 2 ) -1 Control B C E F H B H F C E Control
Figure 12: Values of 1/Rp measured on carbon steel in a pore solution of 0.002 M
Ca(OH)2 + 0.45 M NaOH + 0.26M KOH with increased chloride content in
-700 -600 -500 -400 -300 -200 -100 0 50 100 150 200 250 Potential (mV vs. SCE) 1% 4% 6% NaCl 0.0E+0 1.0E-6 2.0E-6 3.0E-6 0 50 100 150 200 250 Time (days) 1/Rp (Ohms cm 2 ) -1 D 1% 4% 6% NaCl Control G G D Control
Figure 13: Corrosion potential and 1/RP values measured on carbon steel covered with a regular cement coating, Coatings D and G in a saturated Ca(OH)2 solution with increased concentration of NaCl.