CHARACTERISTICS OF SIMPLE MANUAL CONTROL SYSTEMS
by
JEROME ISAAC ELKIND
S.B. Massachusetts Institute of Technology
(1952)
S. M. Massachusetts
Institute of Technology
(1952)
SUBMITTED IN PARTIAL FULFILLMENT OF THE
REQUIREMENTS FOR THE DEGREE OF
DOCTOR OF SCIENCE
at the
MASSACHUSETTS INSTITUTE OF TECHNOLOGY
June, 1956
Signature of Author
Department of i cal Engineering, May 14, 1956
Certified by
II'
-
Thesis
, v Supervisor Accepted bytte 'on Graduate Students
i e
I - I ,) S 1 V4~^ 9. . · e. 1 IL
2.6f--OCrA2R%DEPARTMENT OF ELECTRICAL ENGINEERING
MASSACHUSETTS INSTITUTE OF TECHNOLOGY
CA M B R I D G 3 9J M A S S A C H U S T T
May 8, 1956
Mr. J. I. Elkind
Lincoln C-330
Dear Mr. Elkind:
This letter is to give you permission to print additional copies of your thesis by the multilith process, and to submit to the Department of Electrical Engineering copies thus produced, in lieu of the typed copies normally required.
A copy of this letter is to be reproduced by the same process and is to be placed in each copy of the thesis immediately following its title page.
Sinceely yours,
S. H. Caldwell for the
Department Graduate Committee
CHARACTERISTICS OF SIMPLE MANUAL CONTROL SYSTEMS
by
JEROME
ISAAC
ELKIND
Submitted to the Department of Electrical
Engineering
on May 14, 1956
in partial fulfillment of the requirements for the degree of Doctor of Science
ABSTRACT
A method for measuring and describing the characteristics
of manual control
systems is presented. The method is applied in an experimental study of the
characteristics of simple manual systems. The experimental results are
dis-cussed and analytic models are derived that approximate the measured
char-acteristics.
An analogue computer developed to implement the measurement
of the system characteristics is described.
Because the human operator has many different modes, manual control systems
are nonlinear and therefore require nonlinear analysis and descriptive
tech-niques.
However, a description by means of quasi-linear transfer functions
is found to provide a good approximation to the characteristics
of manual
sys-tems. Methods for obtaining quasi-linear approximations to the system
char-acteristics are discussed. A complete description of system behavior interms
of quasi-linear
transfer
functions requires that a family of such functions
corresponding to a large set of system conditions be obtained.
The structure
of this family and its relations to the structure of the set of system conditions
if our primary interest.
The characteristics of simple pursuit and compensatory control systems were
measured with a family of gaussian input signals having power-density spectra
that covered a range of bandwidths, amplitudes, center frequencies and some
variety of shapes. The experimental results, presented in the form of graphs,
show the nature of the dependence of system characteristics
upon input-signal
characteristics.
The superiority
of
pursuit
systems over compensatory
sys-tems
is clearly demonstrated.
Simple analytic models that approximate these measured results are derived
for both systems.
The compensatory model is highly developed and relations
among its parameters and those of the input have been obtained.
The pursuit
model is not nearly so well developed and only approximated relations among
its parameters andthe input parameters have been found. A method fordeter-mining
a more exact description of pursuit systems is suggested. The
meas-ured results and the analytic models together provide a description of manual
control systems that should be useful in system design.
Thesis Supervisor: J. C.R. Licklider
Title: Associate Professor of Psychology
ACKNO WLEDGMENT
The author is indebted to many members of the staff of Massachusetts
Institute of Technology and of Lincoln Laboratory for their assistance and
suggestions.
He is expecially indebted to Professor J. C. R. Licklider
who, in supervising this thesis, has provided most valuable inspiration
and encouragement and has contributed many important suggestions. The
guidance provided by Professors G. C. Newton and R. C. Booton and their
excellent suggestions and criticisms are greatlyappreciated. The
assist-ance and collaboration of Miss Carma Darley during most phases of the
study have been invaluable.
The author is grateful to R. T. Mitchell and
E. Cramer for serving as subjects, J. W. Doyle for assisting in the
de-sign and construction of the electronic equipment, Miss Patricia Zartarian
for assisting in the computation of the results, E. P. Brandeis for
per-forming some of the early experiments of the study and Miss Margaret
Fitzgerald for typing the manuscript.
This research was supported bythe Department of the Army,
the Department of the Navy, and the Department
of the Air
Force under Air Force Contract No. AF19(122)-458 with
Lincoln Laboratory.
UNCLASSIFIED
TABLE OF CONTENTS
Abstract iii
Acknowledgment iv
I. INTRODUCTION 1
A. Composition and Operation of Manual Control Systems 1
B. Human-Operator Tracking-Response Characteristics 3
II. ANALYSIS AND DESCRIPTIVE TECHNIQUES 5
A. Quasi-Linearization of Human-Operator Characteristics 5 B . Specifications for an Experimental Tracking Situation 5
C. Fundamental Quantities and Relations 6
D. Some Properties of Quasi-Linear Transfer Functions 9 E. Measurement of Power-Density Spectra and Determination of
Transfer Functions 9
III. THE EXPERIMENTAL TRACKING STUDY 11
A. Outline of Experiment 11 B . Experimental Design 11 C. Conditions of Experiment 12 1. Input Signals 12 2. Apparatus 15 3. Test Conditions 19 4. Subjects 19 5. Procedure 22
IV. EXPERIMENTAL RESULTS 23
A.. Results of Experiment I - Variability 23
B . Results of Experiment II- Amplitude 35
1. Compensatory Results 40
2. Pursuit Results 40
3. Comparison of Pursuit and Compensatory Results 41
C. Results of Experiment ill -Bandwidth 42
1. Correlation 1 - nn/oo 43
2. Magnitude of H(f) 43
3. Phase of H(f) 43
4. Noise Power-Density Spectra 52
5. Error Power-Density Spectra 53
6. Mean-Square Errors 53
7. Open-Loop Transfer Function G(f) 54
D. Results of Experiment IV- Shape 54
1. Results with RC Filtered Spectra 54
2. Results with Selected Band Spectra 55
E . Summary of Experimental Results 57
UNCLASSIFIED
TABLE OF CONTENTS (Continued) V. ANALYTIC MODELS FOR THE HUMAN OPERATORA. Models for the Compensatory System
1. Models for Open-Loop Transfer Functions 2. Behavior of the Parameters of the Models 3. Models for Compensatory Noise
B . Models for the Pursuit System
1. Model for Closed-Loop Transfer Functions
2. Comparison of Pursuit Model and Measured Closed-Loop Transfer Functions
3. Model for Pursuit Noise VI. CONCLUSIONS
REFERENCES
APPENDIX A- CALCULATION OF MODEL PARAMETERS I. Compensatory Open-Loop Transfer Functions II. Noise Models
III. Pursuit Predictor P(f)
APPENDIX B - CROSS-SPECTRAL ANALYSIS AND A CROSS-SPECTRUM COMPUTER
I. Application of Cross-Spectral Analysis
II. Description of the Cross-Spectrum Computer
III. Performance
APPENDIX C - INPUT SIGNAL CHARACTERISTICS
vi
UNCLASSIFIED
89 89 89 93 102 105 105 109 113 115 117 119 119 128 128 131 131 133 136 139ILLUSTRATIONS
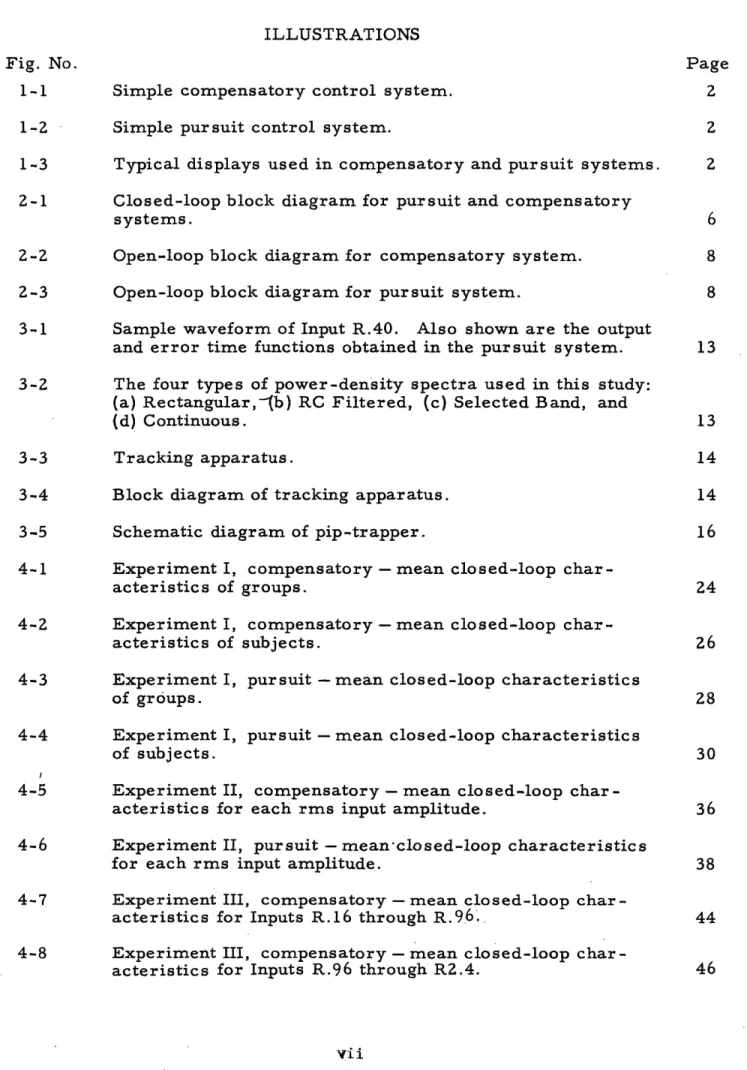
Fig. No.
Page
1-1
Simple compensatory control system.
2
1-2
Simple pursuit control system.
2
1-3
Typical displays used in compensatory and pursuit systems.
2
2-1
Closed-loop block diagram for pursuit and compensatory
systems.
6
2-2
Open-loop block diagram for compensatory system.
8
2-3
Open-loop block diagram for pursuit system.
8
3-1
Sample waveform of Input R.40. Also shown are the output
and error time functions obtained in the pursuit system.
13
3-2
The four types of power-density spectra used in this study:
(a) Rectangular,-b)
RC Filtered, (c) Selected Band, and
(d) Continuous.
13
3-3 Tracking apparatus. 14
3-4 Block diagram of tracking apparatus. 14
3-5 Schematic diagram of pip-trapper. 16
4-1
Experiment
I, compensatory
-
mean closed-loop
char-acteristics
of groups.
24
4-2
Experiment
I, compensatory
-
mean closed-loop
char-acteristics of subjects.
26
4-3
Experiment
I, pursuit
-mean
closed-loop
characteristics
of
groups.
28
4-4
Experiment I, pursuit - mean closed-loop characteristics
of subjects.
30
4-5
Experiment II, compensatory -mean closed-loop
char-acteristics for each rms input amplitude.
36
4-6
Experiment II, pursuit -
mean
closed-loop
characteristics
for each rms input amplitude. 38
4-7 Experiment III, compensatory- mean closed-loop
char-acteristics for Inputs R.16 through R.96. 44
4-8 Experiment III, compensatory- mean closed-loop
char-acteristics for Inputs R.96 through R2.4. 46
ILLUSTRATIONS (Continued)
Fig. No.
Page
4-9
Experiment III, pursuit - mean closed-loop characteristics
for Inputs R.16 through R.96 48
4-10
Experiment III, pursuit -
mean
closed-loop
characteristics
for Inputs R.96 through R4.0. 50
4-11 Experiment III, compensatory - mean open-loop
char-acteristics for Inputs R.16 through R.96. 58
4-12 Experiment III, compensatory - mean open-loop
char-acteristics for Inputs R.96 through R2.4. 60
4-13
Experiment
IV, compensatory
-
mean closed-loop
char-acteristics for RC Filtered Inputs. 62
4-14 Experiment IV, pursuit - mean closed-loop characteristics
for RC Filtered Inputs. 64
4-15 Experiment IV, pursuit - mean closed-loop characteristics
obtained with Input Fl for one subject operating in the normal
mode and in the filter mode. 66
4-16
Experiment
IV, compensatory
-
mean open-loop
charac-teristics for RC Filtered Inputs. 68
4-17
Experiment
IV, compensatory
-
mean closed-loop
charac-teristics for Selected Band Inputs B1 through B4. 70
4-18
Experiment IV, compensatory
-
mean closed-loop
charac-teristics for Selected Band Inputs B4 through B7. 72
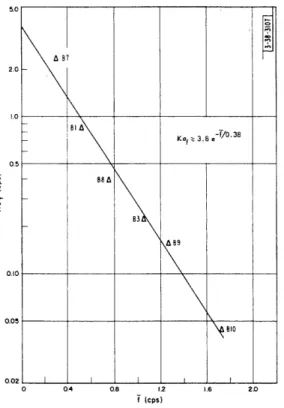
4-19
Experiment
IV, compensatory
-
mean closed-loop
charac-teristics
for Selected Band Inputs B7 through B10.
74
4-20
Experiment IV, pursuit - mean closed-loop characteristics
for Selected Band Inputs B1 through B4.
76
4-21
Experiment IV, pursuit - mean closed-loop characteristics
for Selected Band Inputs B4 through B7.
78
4-22
Experiment
IV, pursuit
-
mean closed-loop
characteristics
for Selected Band Inputs B7 through B10. 80
4-23 Experiment IV, compensatory- mean open-loop
charac-teristics for Selected Band Inputs B1 through B4. 82
4-24 Experiment IV, compensatory- mean open-loop
charac-teristics for Selected Band Inputs B4 through B7. 84
4-25 Experiment IV, compensatory- mean open-loop
charac-teristics for Selected Band Inputs B7 through B10.
86
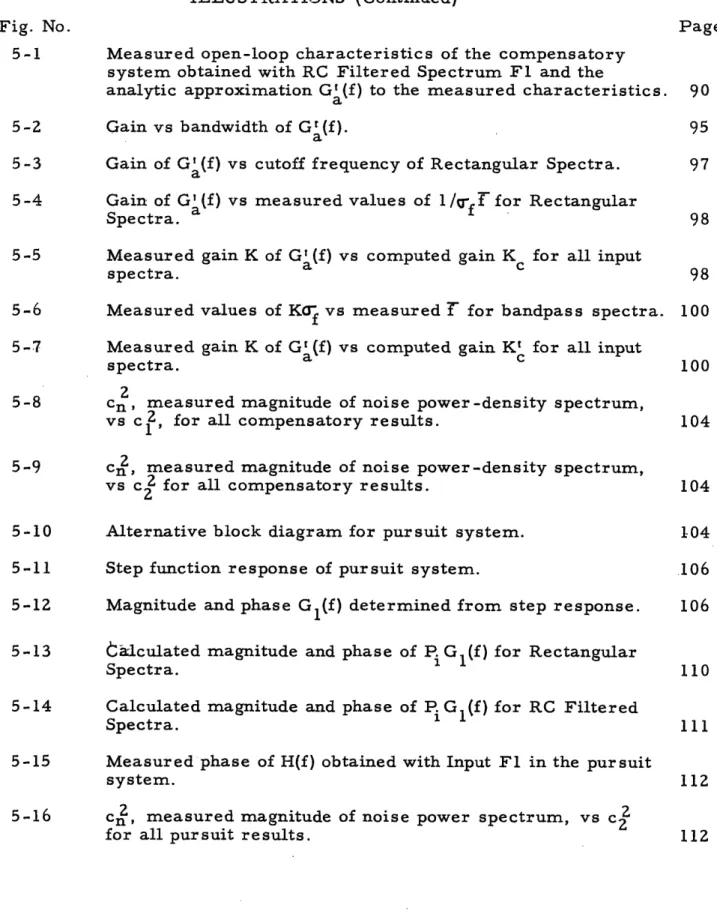
ILLUSTRATIONS (Continued)
Fig. No.
Page
5-1
Measured open-loop characteristics
of the compensatory
system obtained with RC Filtered Spectrum Fl and the
analytic approximation G' (f) to the measured characteristics.
a
90
5-2
Gain vs bandwidth of G
a(f).
95
5-3
Gain of Ga(f) vs cutoff frequency of Rectangular Spectra.
97
5 -4
Gain of G' (f) vs measured values of 1l/ffr for Rectangular
Spectra. a
98
5-5
Measured gain K of G' (f) vs computed gain K for all input
spectra.
a
c
98
5-6 Measured values of Kcr vs measured
T
for bandpass spectra. 1005-7
Measured gain K of GI(f) vs computed gain
K'
for all input
spectra.
100
2
5-8
cn, measured magnitude of noise power-density spectrum,
vs c 2, for all compensatory results. 104
5-9
cn, measured magnitude of noise power-density spectrum,
vs c for all compensatory results. 104
5-10
Alternative block diagram for pursuit system.
104
5-1.1
Step function response of pursuit system.
106
5-12
Magnitude and phase Gl(f) determined from step response.
106
5-13
calculated magnitude and phase of P Gl(f) for Rectangular
Spectra.
110
5-14
Calculated magnitude and phase of P. Gl(f) for RC Filtered
Spectra. 1 111
5-15 Measured phase of H(f) obtained with Input Fl in the pursuit
system. 112
5-16 Cn, measured magnitude of noise power spectrum, vs cZ
for all pursuit results.
112
ILLUSTRATIONS (Continued)
Fig. No.
Page
A-1
Magnitude and residual phase of G(f) obtained with
Rectangular Spectra and the best analytic approximation
G'(f)
a
to the measured results.
120
A-2
Magnitude and residual phase of G(f) obtained with RC
Filtered Spectra and the best analytic approximation
G
t(f) to the measured results.
123
A-3
Magnitude and residual phase of G(f) obtained with Selected
Band Spectra and the best analytic approximation
G'(f) to the measured results.
a
124
A-4
Simplified block diagram of pursuit system for use in
computation
of
P.
(f).
128
B-1
The type of unknown system whose characteristics
can be
determined by cross-spectral analysis.
131
B-2
Block diagram of cross-spectrum
computer.
134
B-3
Photograph of cross-spectrum
computer.
135
B-4
Photograph of data speed
change
recording
system.
136
B-5
Magnitude and phase of transfer function for a high-pass
filter obtained using the cross-spectrum computer. 137
B-6
Comparison of human operator transfer functions computed
with the cross-spectrum computer and with a correlator. 137
C-1 Measured and nominal Continuous Spectra. 140
C-2 Measured and nominal Rectangular Spectra. 142
C-3 Measured and nominal RC Filtered Spectra. 142
C-4 Measured and nominal Selected Band Spectra. 144
C-5
Relative frequency and cumulative frequency functions of
amplitude of Input R.40.
145
TAB LES
Conditions of Experiment I - Variability
Conditions of Experiment II - Amplitude
Conditions of Experiment III - Bandwidth
Conditions of Experiment IV - Shape
Number of Runs Averaged in Mean Characteristics
Analyses of Variance F Values for Experiment I,
Compensatory
Analyses of Variance F Values for Experiment I,
Pur suit
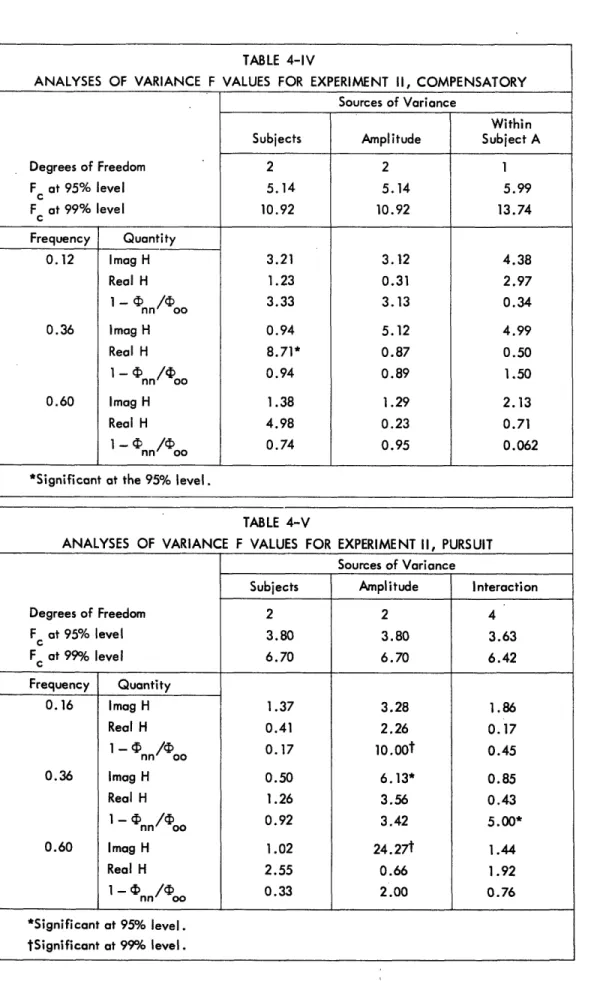
Analyses of Variance F Values for Experiment II,
Compensatory
Analyses of Variance F Values for Experiment II,
Pur suit
Relative Mean-Square Errors (mse)
Summary of Parameters
of Ga(f
)and G (f)
Summary of Calculations for Noise Models
Parameters of P. (f)
1Composition of Inputs
Moments of Spectra
Page
1820
20
21
No.
3-I
3 -II3 -III
3 -IV4-1
4-II
4-III
4-IV
4-V
4-VI
5-I
A-1
A-II
C-I
C -II
23
32
33
34
34
42
94
129
130
139
141
UNCLASSIFIED
CHARACTERISTICS OF SIMPLE MANUAL CONTROL SYSTEMS
I. INTRODUCTION
Manual control systems have some characteristics that are highly desirable in aircraft control, missile guidance, fire control and other aiming or steering systems. The human operator's ability to adjust his characteristics to meet system requirements provides manual control sys-tems with a degree of flexibility and "intelligence" that is difficult to achieve in wholly
auto-matic systems.
But the human operator's adaptability and nonlinearity make it difficult to analyze and to describe
mathematically the characteristics of manual control systems. The usual technique of
express-ing system characteristics by means of frequency-dependent linear transfer functions is not
ap-plicable to manual systems. Their characteristics can, however, be approximated with good
accuracy by quasi-linear transfer functions which retain much of the inherent simplicity of
lin-ear transfer functions.
A single quasi-linear transfer function will, in general, be a satisfactory approximation for only one set. of system conditions. A large group of quasi-linear transfer functions would be needed to approximate the characteristics of the control system for all possible sets of system condi-tions. It would be pointless to attempt to measure and to catalogue all or most of the charac-teristics belonging to this group. Instead, we must measure the characcharac-teristics of the human operator in several different fundamental control situations. From these measurements afam-ily of quasi-linear transfer functions and other associated functions describing human-operator characteristics will be obtained. By studying the structure of this family and its relations to the control systems tested, basic rules for the behavior of the human operator and invariances in his characteristics can be discovered. The structure of the family of functions and the rules derived from it are of primary interest.
In this paper, measurement techniques for determining quasi-linear transfer functions for
man-ual control systems are developed and verified. These techniques are applied in an experimental
study of the influence of input-signal characteristics on the behavior of simple (no lags or filters)
pursuit and compensatory control systems. From the experimental results, analytic models for
the human operator's characteristics in the compensatory system have been developed, and re-lations among the parameters of the models and the parameters of the input signals have been derived. Models for the pursuit system are proposed, but the experimental data are not suffi-cient to permit the same degree of quantitative refinement in the pursuit models that was pos-sible with the compensatory. The measured characteristics and the analytic models describe,
in a certain sense, an upper bound on manual system performance. The experimental results
should therefore be useful in the design of manual control systems.
A. COMPOSITION AND OPERATION OF MANUAL CONTROL SYSTEMS
A manual control system is a servo system in which a human operator has the task of detecting misalignment between system input and output and of initiating the system response necessary
UNCLASSIFIED
e() - , 6(t) _. - - t) u a r(t) . I....r.
)- 1 DISPLAY t: oWiERATOR H K- I · e( t)
Fig. 1-1. Simple compensatory control system. The subtractor is con-nected in the way shown so that the displacement of the control and the
displacement of the indicator are in the same direction.
eilf)
i _ 7,,) 0sI HUMAN r(titCONTROL eo(t)
e,(t) -I I -- -I OPERATOR -I K, I
'-i 1I I I I
Fig. 1-2. Simple pursuit control system. The display shows both e (t) and eo(t).
J1 Ia
-4 at-- 1 ) (t) -e (t)
(a) (b)
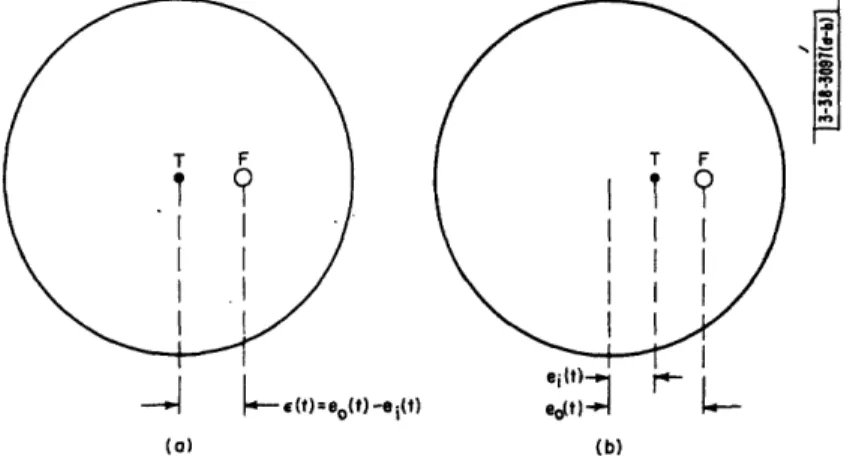
Fig. 1-3. Typical displays used in (a)
T is the target and F is the follower.
compensatory, and (b) pursuit systems.
2
UNCLASSIFIED
L g c m A r+ I I I I IUNCLASSIFIED
to reduce this misalignment. This task, commonly called tracking, can be more precisely defined as the process in which the human operator tries to effect some degree of match be-tween a controlled output quantity and an input quantity. In most manual control systems, the human operator is coupled to the rest of the system by a stimulus transducer, or display, and a response transducer, or control. The kinds of transducers used can vary widely with the sys-tem requirements as can the type of match between input and output that the human operator tries to achieve. We shall consider only simple visual-manual tracking systems in which the information displayed and the control movements are closely related to the actual input and out-put signals, and in which the match that the human operator tries to achieve is akin to the
mini-mum mean-square-error criterion.
The simplest manual control systems are composed of only a display, a control and a human operator. If the control is light and frictionless, its dynamics can be neglected and it can be represented in system block diagrams by an amplifier whose gain corresponds to the scale fac-tor transforming hand movement to system output. Block diagrams of simple forms of the two most common types of manual control systems, pursuit and compensatory, are shown in Figs. 1-1 and 1-2. In the compensatory system, only the error (the difference between input and output) is displayed. As shown in Fig. 1-3(a), the error is represented by the displacement of the fol-lower (the circle) from the stationary reference or target (the dot) located at the center of the display. The human operator's task in this system is to compensate for, or minimize the error signal presented, by trying to keep the circle around the dot. In the pursuit system, both input and response are displayed independently [Fig. 1-3(b)]. The displacement of the target (the dot) represents the input, and the follower (the circle), the response. The human operator's task is to pursue the target with follower by trying to keep the circle around the dot.
There is considerable evidence that pursuit systems perform better than compensatory,
partic-ularly with high-frequency inputs. 1 2 Apparently, pursuit systems are superior because the
human operator can see the input directly and can predict its future in order to correct partially for phase lags and time delays present in his own characteristics and in those of other compo-nents of the system. In the compensatory system, because he sees only the error, he can not predict the input accurately and can not correct so well for lags.
B. HUMAN-OPERATOR TRACKING-RESPONSE CHARACTERISTICS
Certain features of the tracking characteristics of the human operator make him a unique ele-ment for control systems. His ability to modify his characteristics in order to match the char-acteristics of the control situation makes it possible for him to function effectively in many
dif-ferent systems and situations. Tustin, Russell and others3, 4, 5, 6, 7 have shown that the human
operator considers both the statistical characteristics of the input signal and the dynamic char-acteristics of the other components of the system in shaping his own response charchar-acteristics. When tracking a low-frequency sinusoid, the human operator is able to predict the future of the sinusoid and to compensate for lags present in his own characteristics -and in those of other
components of the system. His response is, therefore, approximately in phase with the input.8,9
With a stochastic signal, however, prediction is necessarily imperfect, and the operator's
*Superscripts in bold face refer to references on p. 117.
UNCLASSIFIED
response lags the input.3,4 Russell3 has shown that when a low-pass filter is inserted in the
loop, the human operator tries to develop, in his own characteristics, terms that are the
in-verse of the filter in order to reduce its effects. Existing data are inadequate to indicate the range over which the human operator can modify his characteristics or to specify exactly fac-tors he considers when making the modifications. One purpose of the experiments reported in this paper was to determine the extent of the human operator's ability to adjust to input-signal
characteristics.
The most prominent features of the fine or short-time structure of human-operator responses are low bandwidth, reaction-time delay, intermittency and relatively good amplitude linearity. Both the visual and muscular systems, which are well matched to each other, are limited in their frequency response to a maximum of about 10 cycles per second. In visual-manual tasks, controlled movements cannot be made more frequently than about 2 or 3 cps. 8 Accurate track-ing is obtained only with inputs whose power is concentrated in the part of the spectrum below
1 cps.
A stimulus-response latency or reaction-time delay is an inherent characteristic of the human operator. In simple discrete tracking situations, the delay is about 0.10 to 0.40 second.0l, 1, l2 Major sources of the delay are excitation of the retina (0.02 to 0.04 second), nerve conduction
(0.01 to 0.02 second), muscle contraction (0.02 to 0.04 second) and central processes. 1 3 The
time required for the central processes depends upon the complexity of the task and is largely responsible for the wide variation in reaction times.
There has been considerable discussion of intermittency in human-operator responses.l4 15, 16, 17 No experiments have been reported that show conclusively that, in a continuous tracking task, the human operator does act like an intermittent servo. Many of the arguments in favor of the
intermittency hypothesis rest heavily on the observation that tracking-error curves are
fre-quently oscillatory. But oscillations can result either from intermittency or from closed-loop
instability. Merely the presence of oscillations does not prove that the human operator is inter-mittent. Of course, one would expect that the discrete behavior of the neural system would
make tracking responses intermittent. However, the period of intermittency which has been
proposed for tracking is about 0.5 second - much greater than would be predicted on the basis of neural intermittency alone. Also, a period of intermittency of 0.5 second is not consistent with the fact that the human operator is able to track well inputs having frequency components
as high as 1 cps.4 The question of whether or not the human operator acts intermittently
re-mains to be resolved.
Human-operator characteristics are not absolutely fixed. Both the fine and the gross structures
show variation with time and with repeated presentation of the same input.l8 It is likely that
many of these variations result from external stimuli or represent stochastic variations in
human-operator characteristics that are not related to the input signal. In most practical
track-ing studies, care is exercised to minimize the effects of these external stimuli. The variations in responses that do occur are treated as if they were noise.
UNCLASSIFIED
II. ANALYSIS AND DESCRIPTIVE TECHNIQUES
From the brief review of human-operator characteristics it is apparent that the human operator is highly nonlinear in that his characteristics depend strongly upon the nature of the tracking situ-ation. Measurements of the characteristics of the human operator in a particular tracking situa-tion will not be sufficient to describe his characteristics in others. Rather, we must measure human-operator performance in enough different tracking situations that the structure of the
fam-ily of characteristics can be ascertained. Knowing this structure and the relations between its
parameters and those of the situations studied, we may be able to discover basic rules of be-havior of the human operator, invariances in his characteristics that will be applicable to a wide range of different tracking situations.
Since manual control systems are similar to automatic systems in purpose and in operation, it seems reasonable to try to apply to manual systems the measurement and descriptive techniques that have been developed for automatic systems. The widely used linear methods for describing
control systems in terms of invariant impulse responses and linear transfer functions are not applicable to manual systems because of the human operator's nonlinearity. However, a
reason-ably accurate description of manual control systems can be obtained without resorting to
compli-cated and unwieldy nonlinear methods. By making use of the concept of quasi-linearity we can
retain much of the inherent simplicity of the linear methods and still treat with good accuracy
the kinds of nonlinearities peculiar to the human operator.4
A. QUASI-LINEARIZATION OF HUMAN-OPERATOR CHARACTERISTICS
Quasi-linearization is the process of representing the characteristics of a nonlinear device by linear transfer functions whose parameters depend upon the environment of the device, i.e.,
parameters of the input and of other components connected to the device19,20,21 These transfer
func-tions are called quasi-linear transfer funcfunc-tions because they behave linearly when the set envi-ronmental parameters remain fixed and nonlinearly when these parameters are allowed to change. Quasi-linearization is particularly suited to the kinds of nonlinearities observed in the human operator. His most significant departures from linearity occur when the input statistics or sys-tem dynamics change. Since its parameters depend upon the input and the syssys-tem, a quasi-linear transfer function can handle this kind of nonquasi-linearity. Even such nonquasi-linearities as inter-mittency in response movements and amplitude distortion can sometimes be well approximated
by quasi-linear transfer functions.20
B. SPECIFICATIONS FOR AN EXPERIMENTAL TRACKING SITUATION
In this study we are not interested in measuring the characteristics of the human operator in one particular tracking situation, but we want to obtain results that will be applicable to a wide range of tracking situations. Therefore, we must extract from actual tracking systems the most im-portant features and incorporate them into our experimental tracking situation.
In most manual systems the input signals are low in frequency and at least partially stochastic. Often, in addition to the stochastic components, there are components that are analytic and
UNCLASSIFIED
completely predictable. The stochastic components, however, are the most difficult to track and therefore are the ones which usually have greatest influence on human-operator characteristics.
Low-frequency gaussian noise is an idealization of actual input signals. It is mathematically
tractable, lends itself to precise specification, and is easy to generate. It is the natural input
to use in an experimental tracking situation. Results derived from tests with low-frequency
gaussian noise are likely to be more applicable to situations in which the input is aperiodic and complex than would be results derived from tests with sinusoids or step functions.
It would be too large and difficult a task to study'the effects of both input signal and system
dy-namics. It was believed more important first to study extensively the effects of input-signal
characteristics. By working with very simple pursuit and compensatory systems, it appears
possible to obtain an upper bound on human-operator performance. The human operator's task
is easier and his performance is probably better with a simple tracking system than with a more complicated system. Available data are not sufficient to prove this statement, but there is con-siderable evidence that it is largely correct. For example, it has been shown that tracking error
increases as lags of the form /[(jf/fn ) + 1] are inserted in the loop.3'2 2
The simplest tracking system consists only of a display, a human operator, and a control
(Figs. 1-1 and 1-2). Both the display and the control are essentially free of dynamics. The
con-trol is light, nearly frictionless, and without restoring spring forces, and can therefore be posi-tioned without inhibiting the human operator's movement. In our experimental tracking study we used simple pursuit and compensatory systems of this kind.
C. FUNDAMENTAL QUANTITIES AND RELATIONS
The characteristics of manual control systems will be represented by quasi-linear transfer func-tions and other closely associated funcfunc-tions of frequency?3
To determine a quasi-linear transfer function for a manual control system we must discover for a particular set of input and system conditions the linear transfer function whose response best approximates the response of the control system to the same input. For stochastic signals it is most convenient to choose the mean-square difference criterion as the basis for selecting the
best approximation. In general, the quasi-linear trans-fer function does not account for all the system's re-sponse. Resulting from the nonlinearities and variability in the human operator's characteristics, there are usually
response components which are not linearly correlated
with the input and which cannot be produced by a linearoperation on the input. These uncorrelated components
-an h.
trenate
aR nis a o +rl +h nii-nilnt of hpnilaui-Fig.2-1. Closed-loop block diagram for linear transfer function, as shown by the model for the
pursuit and compensatory systems. tracking system in Fig. 2-1. When the noise power is a
small fraction of the total response power, the quasi-linear transfer function provides an ade-quate representation of the manual control system. If, however, the noise is a large fraction,
UNCLASSIFIED
the quasi-linear model (Fig. 2-1) may be inadequate. If the noise is nonlinearly correlated with the input, we may be forced to determine nonlinear approximations for the control system. The model of Fig. 2-1 is a closed-loop representation for the compensatory or pursuit control systems shown in Figs. 1-1 and 1-2. It emphasizes the over-all behavior of the system
and provides a basis for measurements of system performance. The characteristics of two
ele-ments of the model, H(f) and N(f), can be determined from measureele-ments of input E. (f) and
out-put E (f) through the application of statistical techniques.24
A random input signal ei(t) of duration 2T has the Fourier transform
EE- (f) i (f) =
f
=T e e_7rjfti (t) e2rjft dt , (2-1)
T
The power-density spectrum of the signal expressed in terms of its Fourier transform is25
=
(f=im 1 E (f) E (f) (2-2)
i i () f 1r
T-oo
where E* (f) is the conjugate of E (f). The cross-power-density spectrum between two signals
1 1
ei (t) and eO(t) is
io (f) = im T E i (f) E (2-3)
10 T-ooT i o
From these definitions, and from the fact the noise is not linearly coherent with the input [bin (f) equals zero], the following relation for the model of Fig. 2-1 can be derived.
qDio (f) = H(f) ii (f) (2-4)
The output signal can be divided into two components: the first part being linearly coherent with the input, and the second part being not linearly coherent with the input. Therefore, the output power-density spectrum is
c00 (f)= IH(f)2 Iii(f) + (f) (2-5)
Equations (2-4) and (2-5) define the characteristics of the two elements of the model.
The fraction of the output power that is correlated with the input is a measure of the degree of the approximation to the actual control system characteristics that is provided by the
quasi-linear transfer function. This fraction, which is the square of the quasi-linear correlation between
input and output can be expressed in terms of the power spectrum of noise and output by the
fol-lowing relation:
(fl
Linearly correlated fraction of output = 1- nn (2-6)
The power-density spectrum of the tracking error, Cee (f), is a useful measure of the quality of system performance.
ee (fi = ii ( f +
oo
(f )- Re (Dio (2-7)UNCLASSIFIED
The mean-square tracking error relative to the mean-square input is another measure of system performance. 2I df- 2 Re I . df E 2(t) df Jo J lo_
=1+
f
.. dfJ
q.. df f, 11 f, 11~~~z (2-8)Whereas Fig. 2-1 represents the input-output relations for both pursuit and compensatory sys-tems, the stimulus-response relations for the human operator in the compensatory system are more clearly shown in the open-loop block diagram of Fig. 2-2.
Fig.2-2. Open-loop block diagram for compensatory system.
In terms of the closed-loop transfer of the open-loop model are,
In compensatory systems the human operator sees only
the error. The single quasi-linear transfer function G(f)
and the noise spectrum qn,n, (f) suffice to describe his
characteristics. The point of entry of the noise has been
arbitrarily chosen to be the input. It was assumed that only visual stimuli are important and that the human op-erator obtains little useful proprioceptive or kinesthetic information about the position of his hand. With a light frictionless control, this assumption is probably not too
drastic.
function H(f) and output-noise spectrum n , the elements H(f) G(f) =
H(f)-l
H(f) and nn (f) Cn ,n' j(f) nn n'' inc~l zThus the elements of the compensatory model can be determined from measurements on system
input and output, ei(t) and e (t).
1 0~~~~~~~~~~~~~~~~~~~~~~~~~~
In the pursuit system the human operator sees and
re-sponds to both input and error, and a more complicated
open-loop block diagram is required to represent his char-acteristics. If we assume again that proprioceptive feed-back is not important, the block diagram of Fig. 2-3
rep-resents the stimulus-response relations in the pursuit
system. The transferfunction P.G1(f) operates on the
in-put, and G2G1 (f) operates on the error. The noise
sources are arbitrarily located at the inputs to these transfer functions. In terms of the closed-loop
trans-fer function H(f) and output noise N(f), the elements of
Fig.2-3. Open-loop block diagram for
pursuit system. 8
UNCLASSIFIED
(2-9) (2-10) ___ _ - __ - - - I __ ___ _ _ __ ___-UNCLASSIFIED
the open-loop pursuit model are
PiG1 (f) - G2 G1 (f) 1-G2G1 (f = H(f) (2-11) 1 - GG (fi and N' (f) P G1 (f) N" (f) G2G1 (f) + - 1 N(f) (2-12) 1 - G G 1 (f) 1 - G2G (f) = N(f)
Thus the elements of this model cannot be determined uniquely from measurements on only
ei (t) and e (t).
By adding to the error signal a second input that is statistically independent of the primary
in-put, we could determine PiG1(f) and G2G1 (f). Measurement of the power spectrum of the second
input and of the cross spectrum between this input and the output would permit calculation of
G2G1 (f). Knowing G2G1 (f) we could find Pi G1 (f). If the second input has small amplitude and
its power spectrum resembles the spectrum of the error, it is likely that the human operator's normal pursuit characteristics would not be changed by the second input. However, the addi-tional measurements would greatly increase the complexity of data reduction.
D. SOME PROPERTIES OF QUASI-LINEAR TRANSFER FUNCTIONS
The quasi-linear transfer function H(f) determined from Eqs.(2-4) and (2-5) has the following
two properties: (1) Its response to the input ei (t) best approximates in the linear-mean-square
difference sense the human operator's response to the same input. (2) If the input signal is a
gaussian process2 6 the transfer function obtained is realizable, i.e., it operates on the past
and present of the input. A proof of both properties has been given by Booton.27 He has shown
that, in general, the best mean-square difference approximation to any nonlinear device having a gaussian input will be realizable and is determined by Eq.(2-1). If the input is only
approxi-mately gaussian, we would expect that H(f) would be only approxiapproxi-mately realizable. The extent
of the nonrealizability and the input conditions which produce it are not known fully.
E. MEASUREMENT OF POWER-DENSITY SPECTRA AND DETERMINATION
OF TRANSFER FUNCTIONS
To determine H(f) and nn (f) from Eqs.(2-4) and (2-5), we must compute the power-density spectra of input and output and the cross-power density spectrum between input and output.
Usually these spectra have been obtained by taking the Fourier transform of the appropriate
correlation functions.2 4 This procedure is theoretically straightforward, but as a practical
matter it is difficult because of Gibbs' phenomenon oscillations introduced by transforming only a finite portion of the correlation functions. Although methods that compensate for this effect
have been developed, a long computational procedure is necessary to find the transforms. 2 8' 29
Since we express our final results in the frequency domain, it seems more efficient to obtain the spectra without making the detour through the correlation functions. A special-purpose ana-logue computer, the spectrum computer, which determines power-density and cross-power-density spectra directly from the time functions of two signals, has been constructed.
9
UNCLASSIFIED
We were able to compute spectra more conveniently and in less time with the cross-spectrum computer than we could with an analogue correlator plus a digital computer to Fourier-transform the correlation functions.
A principle of operation for a cross-spectrum computer is as follows. The two signals ei (t)
and e (t) are passed through identical narrow--bandpass filters set at frequency fc. The outputs
of filters Ei (fc, t) and Eo (fc, t) represent running coefficients of amplitude spectra of the signals
at frequency f . E (fc t) is shifted in phase by 90° to obtain Eo (fc, t). The products Ei E and
Ei E are formed, and the integrals of the products are obtained and plotted. The integral of
EiEo is proportional to the real part of the cross spectrum, while the integral of E.i E is
pro-portional to the imaginary part of the cross spectrum. A more detailed description of the
com-puter and a discussion of its operation and accuracy is given in Appendix B.
10
V
UNCLASSIFIED
III. THE EXPERIMENTAL TRACKING STUDY
A. OUTLINE OF EXPERIMENT
The objectives of the experimental tracking study were: (1) to determine whether a quasi-linear transfer function provides a useful representation of manual control system characteristics and if so, under what conditions, (2) to determine the effects of input-signal characteristics on the
behavior of simple manual control systems, and (3) to obtain a family of characteristics
describ-ing manual control system behavior that would be useful for system design and would represent
an upper bound on human-operator performance. From this family we hope to be able to
dis-cover basic rules of behavior for the human operator, invariances in his characteristics. To determine whether the quasi-linear transfer function is useful, we must obtain answers to
the following questions. First, is H(f) [and also nn (f)] relatively invariant to changes of human
operator and to repeated tracking runs with the same operator? Second, does a quasi-linear
transfer function account for most of the output power? If not, is the noise related to the input by a nonlinear operation or is it a random disturbance that is independent of the input? If H(f)
is to be a useful representation of the system characteristics, the answer to the first question
must be affirmative, and that to the second question must be affirmative or we must be able to show that the noise is independent of the input. That is, we must show that the part of the human operator's characteristics that is capable of exact specification is closely
approxi-mated by the combination of a quasi-linear transfer function and a noise generator. A separate
part of the experimental study was devoted to the question of variability. The results from other
parts of the study have bearing on the second question.
The experiments were performed with simple pursuit and compensatory tracking systems, i. e., those having essentially no dynamics and a light frictionless control, because these systems are likely to provide results which represent an upper bound on human-operator performance. Input signals that approximate a gaussian process were used in order to obtain results that could be applied to as wide a variety of tracking situations as is possible under the restriction that the system be simple. The constrained and specifiable part of a gaussian process is completely
described by its power-density spectrum. Roughly speaking, amplitude, bandwidth, center
fre-quency, and shape describe the input spectrum. The input signals used in the experiments were
approximately gaussian and covered ranges of amplitude, bandwidth, center frequency, and at least some variety of shapes.
B. EXPERIMENTAL DESIGN
A semifactorial experimental design was selected as the best way of exploring the important
system characteristics. The over-all design consisted of four factorial experiments, in each
of which the pursuit-compensatry dichotomy was one of the variables.
Experiment I - Variability:- A study of variability of operator characteristics (1) in repeated runs by the same operator, and (2) from one operator to another. As a secondary outcome, the experiment yielded a preliminary determination of the
ex-tent to which quasi-linear transfer functions describe system response. The latter
11
UNCLASSIFIED
indicated that the quasi-linear model was clearly useful and that, therefore, the other experiments might reasonably be undertaken.
Experiment II - Amplitude:- A study of the relation between input amplitude and system characteristics.
Experiment III - Bandwidth:- A study of the relation between input bandwidth and system characteristics.
Experiment IV - Shape:- A study of the relation between shape of input
spec-trum and system characteristics.
The experimental results are presented in the forms of (1) magnitude and phase of closed-loop transfer function H(f), (2) magnitude and phase of open-loop transfer function G(f) for compen-satory systems only, (3) fraction of response power in the part of output that is linearly
cor-related with input 1 -(nn/qoo), (4) output noise spectrum relative to mean-square of input
C nn/fo Ciidf, (5) error spectrum relative to mean-square of input 4)ee/fo iidf, and
(6) relative mean-square tracking error fo
°°ee df/o
°iidf.
C. CONDITIONS OF EXPERIMENT 1. Input Signals
In practically all parts of the experiments, input signals were generated by summing a large number (usually between 40 and 144) of sinusoids of different frequencies and arbitrary phases. Producing the signals in this way permits very good control over the shape of the spectrum and, in particular, makes it possible to achieve a very sharp cutoff. The components of each signal were spaced uniformly in frequency. The intervals were about 0.0025 cps for the very-narrow-bandwidth signals and about 0.10 cps for the very-wide-very-narrow-bandwidth signals.
A signal composed of sinusoids of different frequencies and random phases approaches a gaussian
process as the number of sinusoidal components becomes infinite.3 0 Although 40 (the smallest
number of components used frequently in these experiments) is not a very large number, it is large enough so that no periodicities in the signals are obvious. Such a signal looks quite ran-dom, as can be seen in the sample waveform shown in Fig. 3-1, and the distribution of instan-taneous amplitudes is very approximately normal. In Appendix C are shown measured relative frequency and cumulative frequency distributions of amplitude for the input signal shown in Fig. 3-1. Of course, as the number of sinusoidal components increases, the approximation to a true gaussian process improves. Most of the input signals have more than 40 components and therefore should be more nearly gaussian than the one of Fig. 3-1 and Appendix C.
A signal having 40 or so components will not possess exactly the same mathematical properties that a true gaussian process does. Many theorems, such as the statement in Sec. II that H(f) will be realizable when measured with a gaussian input, are only approximately true for an input composed of sinusoids. But the mathematical properties are not so important as the psycho-logical effects of the signal. It is highly unlikely that te human operator would be able to
dis-tinguish inputs of the kind used in these experiments from a true gaussian process. Therefore,
the system characteristics obtained with our quasi-gaussian inputs are not likely to bevery different from those obtained with true gaussian signals.
12
UNCLASSIFIED
.-UNCLASSIFIED
Four different types of input signals were generated. The different types of spectra are
illus-trated in Fig. 3-2. The actual measured spectra are shown in Appendix C. A discussion of the
four types of spectra follows. (1) In idealization, the Rectangular Spectra [Fig. 3-2(a)] have infinitely sharp cutoff and are therefore particularly convenient for studies in which input band-width is the main variable (Experiment III). (2) The RC Filtered Spectra [Fig. 3-2(b)] simulate
1-38- 3085 I INCH- I .. ... . . . C. J, So ' "A ' ' -\ , '-~ii: !F. Ur
~j~,jc'
-, - -_"r
_'!
-\_/ 'qJ-
ti
F- ' - - ,i' _- -F 0.33i C l-Fig.3-1. Sample waveform of Input R.40. Also shown are the output and error time functions obtained in the pursuit system.
1 3-38-3086 1 fco f (cps) (a) IJ In J^ ^9 I I HII . I I I 0.48 0.96 144 92 Z 4 :E 0 2 f (cps) (c) log f (cps) (b) 24 db/oct 02 0.53 log f (cps) (d)
Fig.3-2. The four types of
power-den-sity spectra used in this study: (a) Rec-tangular, (b) RC Filtered, (c) Selected Band, and (d) Continuous.
13
UNCLASSIFIED
..UNCLASSIFIED
Fig.3-3. Tracking apparatus.
Fig.3-4. Block diagram of tracking apparatus.
14
UNCLASSIFIED
-I F3·
UNCLASSIFIED
spectral shapes encountered in actual tracking situations more closely than do the other signals. They were obtained by passing a signal, whose spectrum was rectangular with cutoff frequency
of 2.88 cps, through one, two, or three cascaded low-pass RC filters. The half-power frequency
of each individual RC filter was, in every case, 0.24 cps. (3) The Selected Band Spectra
[Fig. 3-2(c)] were produced by combining in various ways four signals having rectangular spectra of equal bandwidth but located on the frequency scale in adjacent blocks. The Selected Band and the RC Filtered Spectra were used in Experiment IV. (4) The Continuous Spectrum [Fig. 3-2(d)] was obtained by passing a series of randomly spaced pulses through an electronic low-frequency bandpass filter (Krohn-Hite Model 330A) which had low cutoff at 0.02 cps and high cutoff at 0.53 cps. At frequencies well above the high cutoff, the attenuation increased at 24 db per octave. This input was used in the pursuit part of Experiment I.*
2. Apparatus
The tracking apparatus is illustrated in the photograph of Fig. 3-3 and in the block diagram of Fig. 3-4. One beam of the upper dual-beam cathode-ray oscilloscope (CRO) presents the target (a dot 1/16 inch in diameter); the second beam displays the follower (a circle 1/8 inch in diam-eter). The circle is formed by feeding to the horizontal (X) amplifiers of the follower channel a signal. having a 1000-cps sinusoidal component that is shifted in phase by 900 relative to the
1000-cps component of a similar signal fed to the vertical (Y) amplifier. The cathode-ray tube
of this oscilloscope has a short-persistence P-ll phosphor.
In the pursuit system, the switch is in the upper or P position and the input signal ei(t) is con-nected directly to the horizontal amplifier of the target channel. The vertical target amplifier is connected to ground. The target dot therefore moves back and forth only along the horizontal axis of the screen under the impetus of the input signal. The subject tries to keep the follower circle around the target dot by moving the control, a small pencil-like stylus, on the screen of
the lower oscilloscope. Voltages proportional to the position of the stylus on the lower screen
are generated by the electronic circuit connected to the stylus. This circuit, in combination
with the stylus, is called a "pip-trapper." In the pursuit system e (t), the voltage
correspond-ing the stylus position along the X-axis of the lower screen, is added to the 1000-cps signal used to form the follower and controls its position. The sensitivities of the horizontal amplifiers of both oscilloscopes were adjusted so that a movement of the stylus produced a movement of the follower, equal in magnitude and in the same direction. Thus in the block diagram of the
pur-suit system (Fig. 1-2), the control sensitivity Kc is unity.
In the compensatory system, the switch is in the lower or C position, and the input to the hori-zontal target amplifier is connected to ground, making the target stationary at the center of the screen. The follower moves in proportion to the difference between the pip-trapper output and the input, e(t) - ei(t). This difference or error signal is added to the 1000-cps signal that forms the follower circle and controls the follower movement. As was the case in the pursuit sys-tem, a movement of the stylus produces a movement of the follower, equal in magnitude and in
the same direction. The control sensitivity Kc in the block diagram of the compensatory system
(Fig. 1-1) is unity.
*The pursuit part of Experiment I was performed before it was decided to use inputs composed of sinusoids.
15
UNCLASSIFIED
9eo-g91 16UNCLASSIFIED
4) al a o E a .2 a E 0) -., a, IlUNCLASSIFIED
The tracking control of the pip-trapper,* the small pencil-like stylus, contains a photocell in its lower tip. A circle is generated on the screen of the lower oscilloscope by the electron beam
which rotates at a 1000-cps rate. The photocell responds to this circle of light. When the tip
of the stylus is centered within the circle, the photocell detects a constant light intensity. When it is off-center, the light intensity it detects varies at a 1000-cps rate. The phase of the photo-cell output, relative to the 1000-cps signals used to form the circle, determines the polarity of
a correction voltage which, when applied to the lower oscilloscope, centers the circle about the
tip of the stylus. Therefore, the circle follows the stylus as it is moved. The voltage required to make it follow corresponds to the subject's response movement. The stylus is particularly useful because it provides a tracking control that has the familiar feel of a pencil, has little fric-tion, and is light (35 grams). A schematic diagram of the pip-trapper circuit is shown in Fig. 3-5.
The subject was seated directly in front of the upper screen and was allowed to adjust his
view-ing distance to whatever value he thought best (usually between 20 and 30 inches). The screen of
the lower oscilloscope was located to the right of the subject as shown in Fig. 3-3. Since the motion required for tracking with a stylus control is similar to that used in writing, this loca-tion was particularly comfortable and natural. An arm rest which supported the entire forearm was provided (not shown in the figure) and the subject was allowed to use finger, wrist or
fore-arm movements as he desired. In this way, he could adjust to different movement amplitudes
by selecting the muscle group most suitable for that amplitude.
The stylus was free to move in both X- and Y-directions, but the movement in the Y-direction
produced a vertical movement of the follower that was one-quarter the magnitude of the stylus movement. By allowing two degrees of freedom in the control the operator could move his hand
in a free and natural fashion without external constraint. The most natural movement is an arc
centered about the pivot point of the forearm, wrist or fingers. By making the vertical-control sensitivity low, the operator could move in such an arc and still not produce significant vertical movement of the follower. However, the control sensitivity was great enough so that he could
correct for the slow and infrequent vertical displacements of the target or follower that appear to be unavoidable in the type of oscilloscopes available for this study [Dumont types 322 (dual-beam) and 304 (single-(dual-beam)]. Since these displacements were infrequent and of small
magni-tude,theywere not likely to affect significantly the operator's characteristics.
The input, response, and error signals were recorded on magnetic tape by frequency
modulat-ing the signals, and on a pen oscillograph. The magnetic-tape recordings were used in
comput-ing the power spectra and cross-power spectra, from which were derived the quasi-linear trans-fer functions and noise spectra that describe the system characteristics.
The chief consideration in the design of the tracking apparatus was to obtain a system that would be as simple and as natural to operate as possible. The display was simple, the control natural
and free-moving. The location of the display and control oscilloscope screens was carefully
chosen to make the subject comfortable and to make the system convenient to operate. The
tracking apparatus used in these experiments very closely approaches the ideal toward which
we aimed.
*The pip-trapper was developed by B. Waters at the M.I.T. Acoustics Laboratory.
17
UNCLASSIFIED
TABLE 3-
CONDITIONS OF EXPERIMENT I - VARIABILITY Input Spectra Input V c f (cpsl Order of Presentation COMPENSATORY Group Members I I V V c Il vc, vc, VC IV Vc, V,V C CC Rectangular Spectrum fco: 0.64cps rms amplitude: 1 inch Subjects: A, B, C PURSUIT Input V P 1 t 24 db/oct 0 02 0.53 log f (cps) Group Members I V V* V II V V* V P' P' P III Vp, V*, V IV V, V* V
P P
p
Continuous SpectrumHal f-power frequency approximately 0.53 cps
rms amplitude: 1 inch Subjects: D, E, F *Signal presented backwards in time.
18
UNCLASSIFIED
Time from Group 1 1 hr 4 hrs 4 days Time from Group 1 1 hr 4 hrs 4 daysUNCLASSIFIED
3. Test Conditions
The test conditions for each of the four experiments are summarized in Tables 3-I through 3-IV. Except where indicated, the same conditions were used in both pursuit and compensatory tests. Experiment I - Variability:- Three subjects tracked four identical groups of input signals, each
group containing three members. The time that elapsed between presentations of the groups was
the chief variable, ranging from one hour to several days, as shown in Table 3-I. The interval
between presentations of the members of a group was only a few minutes. This procedure made
it possible to examine both long-time and short-time variations in the operator's characteristics. In this experiment, but only this one, the pursuit and compensatory tests are not directly
com-parable. In the compensatory tests, the input had a Rectangular Spectrum with cutoff frequency of 0.64 cps and 1 inch root-mean-square (rms) amplitude. The three input signals of a group were identical in all respects. In the pursuit tests, the input was the Continuous Spectrum with
1 inch rms amplitude. The three input signals of a group were identical in all respects except that the middle member was presented backwards in time.
Experiment II -Amplitude:- The inputs were three signals identical in all respects except
amplitude. The spectra were rectangular with cutoff frequency of 0.64 cps. Amplitudes of 1, 0.32 and 0.10 rms inch were used (see Table 3-II).
Experiment III - Bandwidth:- The input signals had Rectangular Spectra of various cutoff quencies. The rms amplitude was adjusted to 1 inch for each test. The range of cutoff fre-quencies was 0.16 to 4.0 cps (see Table 3-III). With both pursuit and compensatory systems, tracking is very easy with a cutoff frequency of 0.16 cps. With pursuit, tracking is nearly im-possible with a cutoff frequency of 4.0 cps, whereas for the compensatory tests the maximum frequency that the subjects were willing to track was 2.4 cps.
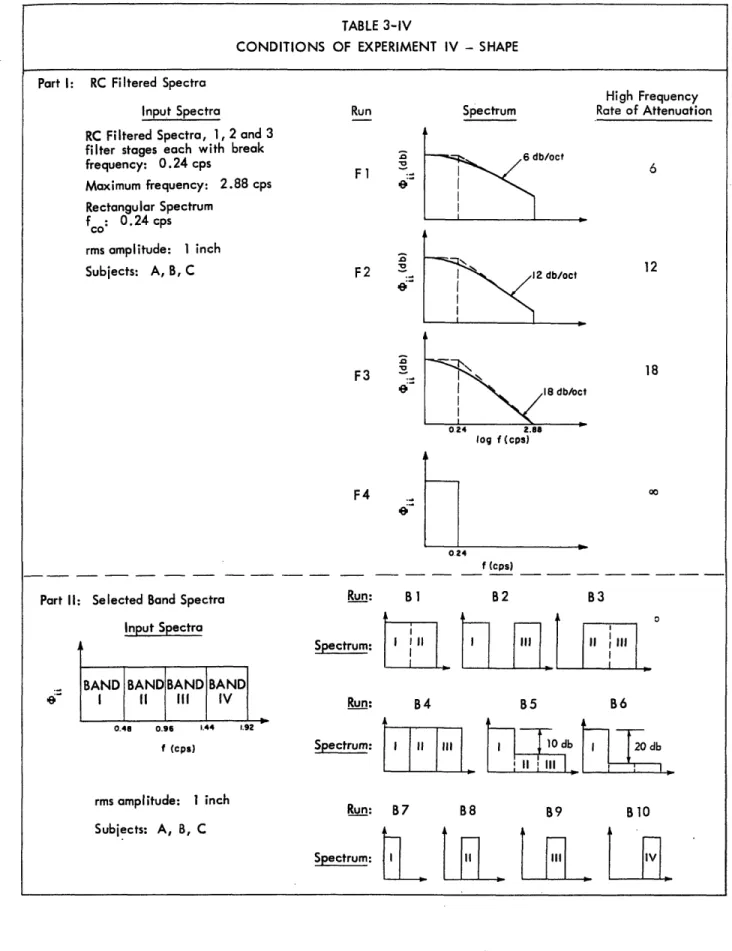
Experiment IV - Shape:- Signals having RC Filtered and Selected Band Spectra were the inputs for this experiment. All signals had 1 inch rms amplitude. The rates of cutoff for the RC Filtered
Spectra were 6,12 and 18 db per octave. An input having Rectangular Spectrum with cutoff of 0.24 cps was included in the group of RC Filtered Spectra in order to connect them with the family of Rectangular Spectra used in Experiment III (see Table 3-IV). The Selected Band Spectra have
shapes that are best described by Table 3-IV. Included in this group are bandpass, band-reject, and low-pass signals.
4. Subjects
One group of three subjects was used in all the experiments, except the pursuit part of Experi-ment I for which another group of three subjects was used. The subjects were all members of the staff of M. I. T. and were well acquainted with objectives of the experiment and the charac-teristics of the input signals. Before data were recorded, the subjects went through a training period of 20 hours of tracking (about thirty 4-minute tracking runs) over a period of about one week. The tracking system was simple enough to operate that the subjects achieved high profi-ciency during the training period.
19
UNCLASSIFIED
20
UNCLASSIFIED
TABLE 3-11CONDITIONS OF EXPERIMENT II - AMPLITUDE
Input Spectrum Run rms Amplitude
Al 1 inch A2 0.32 inch A3 0.1 inch 0.64 f (cps) Rectangular Spectrum fco: 0.64cps Subjects: A, B, C TABLE 3-111
CONDITIONS OF EXPERIMENT III - BANDWIDTH
fco
Input Spectra Run (cps)
Rectangular Spectra R.16 0.16 rms amplitude: 1 inch R.24 0.24 R.40 0.40 R.64 0.64 R.96 0.96 R1.6 1.60 R2.4 2.40 R4.0 4.00 .9
UNCLASSIFIED
TABLE 3-IV
CONDITIONS OF EXPERIMENT IV - SHAPE
Part I: RC Filtered Spectra
Input Spectra
RC Filtered Spectra, 1, 2 and 3 filter stages each with break
frequency: 0.24 cps Maximum frequency: 2.88 cps Rectangular Spectrum fco: 0.24 cps rms amplitude: 1 inch Subjects: A, B, C Run . D9 8 Fl F2 F2 , .9 F3 .0 F4 0 Spectrum 6 db/oct I
I
,I 12 db/oct .18 db/oct I 0.24 2.88 log f(cps) 024. High Frequency Rate of Attenuation 6 12 18 00 0.24 f (cps)Part II: Selected Band Spectra Input Spectra
BAND BAND BAND BAND
'& I l III IV
0.48 0.96 1.44 1.92
f (cps)
Run: B I B2 B3
Spectrum: I III II III
Run: B4 B5 B6 Spectrum: I1 il I