The Development of a Simple Control System to Correct Backlash By
Michelle E. Lustrino
Submitted to the Department of Mechanical Engineering in Partial Fulfillment of the Requirements for the Degree of
Bachelor of Science in Mechanical Engineering at the
Massachusetts Institute of Technology June 2009
ARCHIVES
MASSACHUSET" S INSTITUTE OF TEC'd"NOLOGYSEP 16 2009
LIBRARIES
© 2009. Massachusetts Institute of Technology. All Rights Reserved.
The author hereby grants to MIT permission to reproduce and to distribute publicly paper and electronic copies of this thesis document in whole or in part in any medium now
known or hereafter created.
Signature of Author ... ... ..
Department of Mechanical Engineering May 8, 2009
/-I
Certified by... Accepted by ...(
David E. Hardt Professor of Mechanical Engineering Thesis SupervisorP . or,, Lienhard V ollins Prof sor of Mechanical Engineering
The Development of a Simple Control System to Correct Backlash By
Michelle E. Lustrino
Submitted to the Department of Mechanical Engineering on May 8, 2009 in Partial Fulfillment of the Requirements for the Degree of
Bachelor of Science in Mechanical Engineering ABSTRACT
The control of systems that exhibit backlash has historically been a challenge. In these systems, there are essentially two steady state characteristic response curves separated by a deadband zone. This thesis work is motivated by the desire to accurately control the position of an actuator stem that reacts to the pressure placed on a
corresponding diaphragm, which is critical to the temperature control system in a larger piece of machinery. An accurate system model is developed and a number of control methods are explored. The final control scheme is based on the full characterization of the pressure/position backlash curves and real-time pressure and position measurements. This method achieves steady state position response within 1.3% of the actuator's full travel.
Thesis supervisor: David E. Hardt
Acknowledgements
I would first like to thank Professor David Hardt for giving me the opportunity to join his lab and for all of his guidance and advice throughout the research process. His mentorship has been invaluable.
I would also like to thank my graduate student mentor, Matt Dirckx, who was always available to lend a hand and give me advice. My research has moved quite smoothly thanks to his guidance.
The other graduate students in the lab, Aaron Mazzeo and Melinda Hale, have given me valuable input during group meetings.
The LMP machinists, especially Gerry Wentworth, were extremely helpful in my endeavors to design and construct the extra hardware that I needed along the research path.
And I would of course like to thank my family who has given me tremendous support and encouragement throughout my MIT experience.
Table of contents
A cknow ledgem ents ... 3
Table of contents... ... . . ... 4
List of figures ... ... 5
N om enclature ... ... . ... ... 6
1 M otivation ... . . 7
1.1 The Temperature Control System of the Hot Microembossing Machine ... 7
1.2 C haracterization ... 8
1.3 New Control Hardware ... 9
1.4 Characterization of E/P Transducer Performance... 10
1.5 Control Theory Background ... 12
2 System Modeling ... 13
2.1 Mathematical Modeling ... 13
2.2 Sim ulations ... . 15
2.3 Nyquist and Describing Function Analysis ... 18
3 Implementation of Control Strategies ... 19
3.1 Simple Controllers ... 19 3.1.1 Proportional C ontrol ... ... 19 3.1.2 Proportional-Integral Control... 20 3.2 B acklash C ontrol... ... 21 4 Conclusions... 27 R eferences... ... . 28
List of figures
Figure 1-1. Original temperature control mechanism... 7
Figure 1-2. Actuator response to position step changes ... 8
Figure 1-3. New temperature control mechanism with E/P and LVDTs... 9
Figure 1-4. Enclosure diagram ... ... 10
Figure 1-5. Actuator response to step change in pressure. ... 10
Figure 1-6. Backlash curves for the E/P transducer/actuator/valve system... 11
Figure 1-7. Basic schematic of closed loop position control to be implemented ... 11
Figure 2-1. Mass-spring-damper model of the actuator/valve system ... 13
Figure 2-2. Schematic of actuator's cross section. ... 13
Figure 2-3. Open loop simulation of the steady state behavior ... 15
Figure 2-4. Comparison of simulation to experimental data for steady state ... 15
Figure 2-5. Comparison of simulation to experimental data for transient ... 16
Figure 2-6. Complete open loop model of system with E/P ... 17
Figure 2-7. Comparison of simulation to experimental data for open loop ... 17
Figure 2-8. Nyquist plot for first order transient and describing function for backlash... 18
Figure 3-1. Proportional control loop ... 19
Figure 3-2. System response with closed loop proportional controller ... 19
Figure 3-3. PI control loop... 20
Figure 3-4. System response with closed loop PI controller. ... 20
Figure 3-5. Pressure step magnitudes to move to desired position... 21
Figure 3-6. Basic schematic of new control system ... 22
Figure 3-7. Actuator position step response using "If, Then", constant Pthreshold ... 23
Figure 3-8. System characterization with constant threshold pressure... 23
Figure 3-9. New definition of Pthreshold .... ... 24
Figure 3-10. Actuator position step response using "If, Then" and new Pthreshold... 25
Figure 3-11. Basic schematic of 'If, Then" control system with PI control ... 25
Nomenclature
Symbol Xdesired Xmeasurement F(t) Papplied Adiaphragm mactuator x(t) kinternalsprings bfriction m b k Xss keq ki k2 a, a2 Xerror APneeded Psignal Pmeasurement Kp KI Pdeadband Pthreshold g A DescriptionDesired actuator position Measured actuator position
Force as a function of time on the actuator stem Pressure applied to diaphragm
Area of the diaphragm Mass of the actuator stem Position of the actuator stem
Spring constant of the springs in series with valve diaphragm Damping coefficient due to friction
Generic mass term Generic damping term Generic spring constant term Steady state position
Equivalent spring constant
Equivalent spring constant for higher pressure backlash curve Equivalent spring constant for lower pressure backlash curve Minimum pressure needed to start closing valve
Pressure needed to reduce to in order to fully open valve if partially closed Actuator position error
Change in pressure needed to fix position error Pressure signal
Pressure measurement Proportional gain Integral gain Deadband width
Pressure that lies in between extremes of two backlash curves Conversion factor from position to pressure
CHAPTER
I
Motivation
1.1 The Temperature Control System of the Hot
Microembossing Machine
The control problem explored in this thesis is motivated by a larger project to improve the temperature control system of the Hot Micro-Embossing (HME) Machine that was developed at MIT's Manufacturing and Process Controls Laboratory (MPCL) by Matthew Dirckx and Grant Shoji. The hot micro-embossing process is used to
manufacture micro-fluidic and micro-optical devices. During the process, a
thermoplastic polymer workpiece is heated above its glass transition temperature and a micro-patterned die is forced onto it. [1]
The temperature control mechanism is very critical to the operation of this device and is shown in Figure 1-1 below. Currently, hot and cold Paratherm MR (a hydrocarbon oil) flow through separate pipes, and mix in certain proportions in order to generate 'warm' oil of the desired temperature. To control the mix ratio, pressure is placed on the diaphragm causing an actuator stem to move up and down. This movement changes the relative sizes of the hot oil and cold oil ports on the 3-way mixing valve, thus also changing the mix ratio. The electropneumatic controller adjusts the pressure placed on the diaphragm based on mechanical position feedback.
Position Air Supply
Signal **
Air Pressure
Electropneumatic ! ! Diaphragm
Position Controller
Actuator Stem
Cold Oil 'Warm' Oil
Hot Oil
Figure 1-1. Original temperature control mechanism.'
Actuator photo: Warren Controls Manual, March 2005: http://controlproinc.com/cNcgraphics/2800ProductSpec.pdf Position controller photo from Moore Manual, December 1999, available at:
While this mechanism does perform the desired tasks, its performance is not satisfactory. Two of the most significant problems are actuator hunting and time delays. To evaluate the cause of these issues, the author of this work conducted extensive characterization of the temperature control system, specifically paying attention to the performance of the valve/actuator mechanism. Please note that there are two of these temperature control mechanisms on the HME machine, but for the purposes of this study, all of the results will be demonstrated with the valve located at the back of the machine.2
1.2 Characterization
In a simple test, a step change in the position command was sent to the positioners and the actuators' response to this step change was recorded. An example of this data is plotted in Figure 1-2 below. The actuator position was measured with a calibrated linear variable displacement transducer (LVDT).
100 90 -Signal to actuator - Actuator response 100 200 300 400 Time (sec)
Figure 1-2. Actuator response to position step changes. Full valve travel is 0.5625". Note: this was not a test of the closed loop temperature control system; it was merely a test to evaluate
positioner/actuator/valve performance.
There were three significant issues with the step responses of the actuators in this configuration. First, the actuator was not able to travel through its full range of motion. Namely, when a signal was sent to the positioners for the actuator to force the diaphragm of the valve fully closed, it would only move 97% of the way. Second, there was steady state error of up to 5% of valve travel. Lastly, and most importantly, there was extreme hunting once the actuator moved to the correct position.
2 These are the part numbers for these components in case more information about them is desired.
Valve: Warren Controls Model 2830 Precision Globe Control Valve Actuator: Warren Controls Model DL49 Pneumatic Actuator
Based on this valve characterization and conversations with the manufacturer of the valves, actuators, and positioners, it was determined that the positioners needed to be replaced with a different component. Essentially the positioners were taking the signal from the main control system and "re-controlling" it before sending it to the actuators. E/P transducers were identified as a simple replacement part for the positioners. They convert electrical signals into pneumatic pressures and it is this pressure placed on the diaphragm that determines the position of the actuator.
1.3 New Control Hardware
In order to implement these E/P transducers, the temperature control mechanism was changed from that in Figure 1-1 above. A schematic of the new mechanism is shown
in Figure 1-3 below.
E/P Transducer Air Supply
Air Pressure Pressure Signal Presure Diaphragm Feedback LVDT ~Actuator Stem Computer/
Controller Position Feedback
Cold Oil 'Warm' Oil
Hot Oil
Figure 1-3. Temperature control mechanism with E/P transducers for pressure signals and LVDTs for position measurements.
In the original system, the position controller was essentially a combined electropneumatic system with unknown control characteristics. As such, there was no way to look at the open loop response of the actuators to position inputs or to adjust the control algorithms to better suit the requirements of the system. In the new system, however, the E/P transducer hardware acts as a converter of an electric signal to an applied pressure. The actual control algorithm is implemented separately and is thus easily adjustable. This system also includes pressure and position feedback from the E/P transducers and the LVDTs, respectively, and these measurements can be monitored by the user.
3 Actuator photo from Warren Controls Manual, March 2005:
In order to retrofit the HME machine to install the E/P transducers, an enclosure was constructed and is shown in Figure 1-4 below. The transducers were housed in the enclosure along with the electronics needed to send and receive signals to and from the LVDTs and computer control system.
Tubes to main air and to actuators
Pressure ,
Gauges
Signal and feedback wire connector
Plug to AC power through power
entry module
LabJack:
Receives computer inputs Sends feedback signals to computer Figure 1-4. Enclosure that contains E/P transducers and necessary electronics for LVDTs.
1.4 Characterization of E/P Transducer Performance
Once these transducers were installed, the open loop position response of the system was evaluated. An electrical signal was sent to the E/P transducers,
corresponding to the desired pressure on the actuators, and the valve was closed a given amount. Actuator position was measured as a function of valve closure and the results are presented in Figure 1-5 below.
100 -1 . ... - I I
0 100 200 300 400
Time (sec)
500 600 700 800
Figure 1-5. Actuator response to step change in pressure applied to the valve diaphragm. Signal processed with E/P transducers instead of pilot positioners.
The actuator response to the E/P transducers proved to be much smoother than the actuator response to the pilot positioners, as there was no hunting. Furthermore, the actuator was able to move throughout its full range of motion. However, the replacement of the positioners with the E/P transducers made the backlash in the valve/actuator
system apparent. Looking at Figure 1-5, between t=- 100 and t=-200 seconds and then again between t=400 and t=600 seconds, the pressure increased in many small steps, but there was no change in position output until a threshold pressure was surpassed. This observation is the effect of backlash. Essentially, there are two different characteristic pressure-position curves - one for when the pressure is increasing and the valve is closing and the other for when the pressure is decreasing and the valve is opening. When the "pressure stepping" from Figure 1-5 is observed, the system is shifting between these two pressure-position curves and there is consequently no change in actuator position - the system is in its deadband zone.
By plotting steady state position against input pressure for a series of similar tests, the specific backlash curves were extrapolated for the system and are shown in Figure 1-6 below. 100 -90 S80 i-70 > 60 50 -0 Z7- 40 0 (. 30 20 10 0 i ++ 0 2 4 6 8 10 12 14 Pressure (psig)
Figure 1-6. Backlash curves for the E/P transducer/actuator/valve system.
It is the backlash plot shown in Figure 1-6 that drives the goals of this thesis research. These goals are two-fold. First, the steady state and transient behavior of this non-linear system is to be characterized and modeled in the MATLAB/Simulink
environment. Second, a closed-loop controller is to be designed and implemented that will effectively control actuator position. A basic schematic of this controller is shown in Figure 1-7 below.
x + m Controller .. Actuator
1.5 Control Theory Background
Controlling a system with backlash has historically been a challenge because the necessary control signals cannot just be determined based on the system's recent history. Rather, the control is dependent upon the internal state of the system [2].
There has been a variety of efforts made to control the backlash of different systems. In [3], the authors used a model predictive control scheme to control a model of an automotive powertrain system. Since not all of the parameters of the system could be measured, state-space feedback was used to estimate the remaining system parameters needed to control the backlash. In the system explored here, all of the necessary parameters can be measured, and so this additional state estimator is not needed.
In [4], PID control was implemented in a second order hysteretic system. In this case, the PID gains were specifically defined based on system data such that accurate reference signal tracking and effective disturbance rejection was guaranteed. In [5], the Preisach operator was used in conjunction with a parameter identification method and an inverse compensation scheme to achieve high-bandwidth, full-range operation of
magnetostrictive actuators.
Describing functions were used to analyze a system with backlash and to design an anti-backlash controller in [6]. The simplicity of this method made it possible to implement for the system discussed in this thesis. The describing function analysis was completed, but as will be shown later, the control method ultimately adopted in this thesis was based on the direct scheduled gain approach.
CHAPTER
2
System Modeling
2.1 Mathematical Modeling
In order to effectively control the system behavior, it is first important to characterize the steady state and transient behavior of this system. To begin the mathematical modeling, the actuator can be approximated as a forced
mass-spring-damper system, as shown in Figure 2-1 below.
x(t)
mactuator
kintemal springs
bfriction
Figure 2-1. Mass-spring-damper model of the actuator/valve system.
The physical significance of each of these components makes more sense when considering a cross-sectional view of the actuator, a schematic of which is shown
Applied
Pressure
I
/DiaphragmStem
Figure 2-2. Schematic of actuator's cross section.
In the model developed above, the mass is the mass of the actuator and the effective spring constant is that of the springs beneath the diaphragm. The damping is an effect of the friction within the system, which is partially caused by the valve packing. Valve
F(t)=PappliedAdiaphragm
packing will be discussed further later in this section. A typical forced mass-spring-damper system has a characteristic equation of the form:
F(t) = mb + b + kx
(2-1)
As such, the steady state position of the actuator should be defined as follows: F
Sk
(2-2)
However, after experimentally characterizing the system, the steady state position was found to be defined by the following relationship:
F = kix + ai
i=1 when i > 0 and i=2 when i < 0
(2-3)
where i defines the actuator's direction of travel before approaching steady state and is positive when the actuator is moving towards its fully closed position. The differences in the spring constants were ultimately found to be negligible compared to the nonlinearities associated with the backlash. As such, the system was modeled so that the equivalent spring constant, keq, was equal to the average of kl and k2. The constants a] and a2 are
characteristic of the system's backlash. Specifically:
Deadband = a1 - a2
(2-4)
In a physical sense, the parameter al is equivalent to the minimum pressure needed to start closing the valve. If the valve is partially closed, then the applied pressure needs to be reduced to at least the value of a2 in order to completely open the valve again. Based
on the experimental characterization, the above parameters were defined as in Table 2-1:
Table 2-1. System parameter values based on experimental characterization.
Equivalent Spring Constant, keq 0.19 in/psi
Deadband Width 2.96 psi
a, 8.78 psi
a2 5.82 psi
Since the spring range is designed for an input pressure range of 9-15psi, it makes sense that al is about 9psi. The pressure range for the valve to move from fully open to fully closed is 9-12psi. The pressure range through which the valve will move from fully closed to fully open is 6-9psi, indicating that the springs need extra "relief' in order to push the valve back open. This effect is hypothesized to be a result of the grand friction in the valve packing. This valve packing is the material that guides the actuator stem as it
travels. The friction between the valve stem and the packing material generates non-linear friction, which causes the backlash effect shown here.
2.2
Simulations
Using the above parameters to model the steady state behavior of the valve/actuator system in Simulink, the block diagram shown in Figure 2-3 was developed:
-K-sim out:
To Workspace Pressure Backlash Spring Constant For Analysis
Input
[D--Offset
Figure 2-3. Open loop simulation of the steady state behavior of the valve/actuator system. Pressure input is a random series of steps. Offset is equivalent to the average of al and a2. Spring constant is
keq, the equivalent spring constant of the system.
A comparison of the simulation data to the experimental data achieves excellent results,
as shown in Figure 2-4 below.
100 80 60 40
* Simulation
D Experimental Data EP0
L 20F
i
~a n 0 2 4 6Input Pressure (psi)
10 12
of simulation to experimental data for steady state actuator positions as a function of input pressure.
To model the transient response, a typical transfer function of the second order system described by equation (2-5) is as follows:
X(s) 1 F(s) ms2 + bs + k
(2-5)
However, in looking at the experimental data, the step response appears to be first order. Furthermore, in a physical sense, the mass of the actuator is small in comparison to the damping and spring constant coefficients. As such, the system can be simplified and represented as a first order system, described by the transfer function in equation (2-6).
X(s) 1
F(s) bs + k
(2-6)
where the time constant equals b/k, as does the steady state value of a unit step response. As such, in order to achieve a step response equal in magnitude to the magnitude of the step input, a gain of k/b should be included in the model. Using the 63% rule, a time constant of 2.7 seconds was found. When modeled in Simulink, the model of transient behavior closely matched that of the experimental data, as shown in Figure 2-5 below.
--- Simulation
Experimental Data
I j 20 Time (sec) 30 40Figure 2-5. Comparison of simulation to experimental data for transient actuator response to a 0.25psi step input.
In order to complete the model, a saturation block was added to account for the maximum actuator travel in the system. Additionally, a rate limiter was added, as there is
a maximum velocity at which the actuator can travel. At this maximum velocity, the force exerted by the air pressure on the diaphragm is being directly counterbalanced by the force of friction from the valve packing. The model is shown in Figure 2-6 below.
Spring
Constant
Offset 2
Figure 2-6. Complete open loop model of the E/P transducer/actuator/valve system. Actuator position response to pressure input.
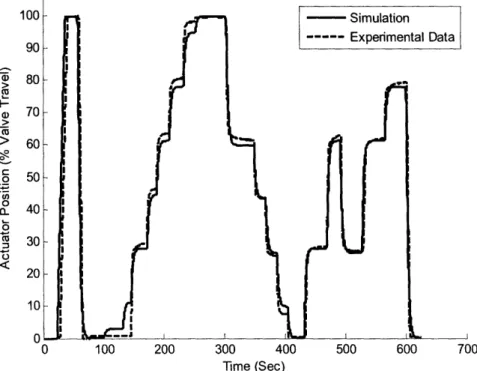
In order to test this complete model, the series of pressure inputs that were used in the experimental characterization were used as a source in the Simulink model and the simulation's position responses were cross-plotted with the experimental data, presented in Figure 2-7Figure 2-7 below.
--- Simulation --- Experimental Data
100 200 300 400 Time (Sec)
500 600 700
Figure 2-7. Comparison of simulation to experimental data for open loop actuator response.
The success of this open loop model proves that a sufficient understanding of the system exists and this understanding can now be used to design and implement closed loop feedback control for actuator position.
2.3 Nyquist and Describing Function Analysis
As was mentioned above, it was deemed beneficial to analyze the system's stability using a Nyquist plot and describing function. The Nyquist plot for the transient component of this system and the describing function for the backlash are shown in Figure 2-8.
-0o.6
-08 0 Describing . Function.-' Nyquist Real AxisFigure 2-8. Nyquist plot for first order transient response and describing function for backlash.
Since the transient response is approximated as first order, the Nyquist plot lies entirely in the right half plane of the complex axes. As such, it will never encircle the
-1/K point. Furthermore, it is shown above that that describing function never crosses inside the Nyquist plot. On first glance, it thus appears that the system should never exhibit limit cycle behavior. However, it is possible that there are some higher order terms in the transient response that are not accounted for here, in which case it is first
important to test for limit cycling using a P and PI controller.
18
Implementation of Control Strategies
3.1 Simple Controllers
3.1.1 Proportional Control
To begin testing possible control schemes, the position control loop was closed
and a proportional gain was added. The controller was constructed in LabView. A schematic diagram of the control system is shown in Figure 3-1 below.
Pm
System
-Figure 3-1. Proportional control loop. Xmasurement is the current position as measured by the LVDTs and Pmeasurement is the current pressure as measured by the E/P transducers. K is the proportional gain.
As expected, the system response to this controller (shown in Figure 3-2 below) was far from satisfactory.
100 1 0 20 40 60 80 Time (sec) - Position Input - Position Response 100 120 140 160
Figure 3-2. System response with closed loop proportional controller, Kp=3. CHAPTER
As can be expected from a proportional controller, there were very large steady state errors. Furthermore, there were steady state pressure fluctuations of magnitudes greater than 10% of the total valve travel, a result of the system's backlash. Changing the Kp value had little effect on system performance.
3.1.2 Proportional-Integral Control
To try and eliminate steady state error, integral control was added. A schematic diagram of this control system is shown in Figure 3-3 below.
Figure 3-3. PI control loop. Kp is the proportional gain and K is the integral gain.
Initial tests proved that integral windup was a significant problem, and so anti-windup was immediately added. However, the response, shown in Figure 3-4 below, still exhibited large position fluctuations and steady state errors.
loo100-- osition Response -Position Input 0 50 100 150 200 Time (sec) 250 300 350
Figure 3-4. System response with closed loop PI controller.
This PI controller confirmed that simple control methods are not effective for a system with backlash. As such, a simple backlash controller was developed and implemented.
3.2
Backlash Control
While the backlash in this system causes nonlinear behavior, the behavior of the system while operating on each of the individual curves is both linear and predictable. Figure 3-5 shows how the necessary pressure signals can be determined based on the relationship between the initial and desired actuator positions and the initial pressure. In both cases, the initial and desired actuator positions are the same, but the initial pressures are different. Position Position Pressure (b) - Pressure
Figure 3-5. Determination of magnitude of pressure step necessary to move actuator from current position to desired position. Arrows along pressure/position curves indicate direction of allowed actuator travel.
(a) High initial pressure. (b) Low initial pressure.
In Figure 3-5(a), it is possible to move along the same pressure/position curve that the initial operating point is on in order to move towards the desired operating point. As
such, it is only necessary to send a small change in pressure, AP1, to the actuator.
However, in the case shown in Figure 3-5(b), if the pressure is only raised by the small amount AP1, then the actuator will not move, as the actuator movement along this pressure/position curve can only occur if the pressure is decreasing. It is thus necessary to move the initial operating point to the other backlash curve before actuator movement
will take place. This necessitates a larger pressure change, shown by AP2 in Figure
3-5(b).
The magnitudes of the pressure steps necessary to move the actuator to a new position can be defined by a few equations based on the system's characterization. These equations also require continuous monitoring of the actuator's pressure and position, which is accomplished through the pressure and position feedback that was already available in the system. These equations were the basis of the new controller that was implemented, a schematic of which is shown in Figure 3-6 below.
Pnw
Figure 3-6. Basic schematic of new control system. Equations of operation are dependent upon parameters from open loop system characterization and continuous position and pressure feedback.
In a first effort, the operational equations based on system characterization were defined as in (3-1) below:
f[(error > 0 n Pmeasureent Pthreshold )(Xerror < 0 Peasurement > Pthreshold
Then
signal Pmeasurement + Pdeadband ign(error) + g * Xerror
Else
signal Pmeasurement + g * Xerror
(3-1)
where the error is defined as in equation (3-2) below:
Xerror = Xdesired - Xmeasurement
(3-2)
and where Pdeadband is the deadband width defined in Table 2-1, Pthreshold is some pressure that lies in between the extremes of the two backlash curves, and g is a conversion factor.
This became known as the "If, Then" control scheme. The response is shown below in Figure 3-7.
- Position Input - Position Response
0 20 40 60 80 100 120 140
Time (seconds)
Figure 3-7. Actuator position step response using "If, Then" control scheme. Pthreshold = 8.12psi.
At two positions, 0% and 100%, the steady state error was removed. The steady state positions were stable with the exception of the observed 'bounces' in position. It was hypothesized that these 'bounces' were a function of the way that threshold pressure was defined. This hypothesis can be explained by Figure 3-8 below. The If, Then
statements described by (3-1) are dependent upon the sign of [Pmeasurement - Pthreshold], defined as A in Figure 3-8 below. When the sign of this parameter changes, the control efforts also change. When delta is small, it is more likely for the pressure to fluctuate about this threshold pressure, thus causing more changes in the control effort and making these "bounces" more likely.
Position
A2
x2
A
a2z Pressure
Figure 3-8. System characterization with constant threshold pressure. A=Pmeasurement - Pthreshold, al and a2
are as defined in Table 2-1. xi and x2are example operating points with small and large As, respectively.
In order to solve this problem, the control scheme was changed slightly. The threshold pressure was instead defined by a line equidistant from, and with the same slope as, the two pressure/position backlash lines. The threshold pressure can be defined by the dotted line in Figure 3-9 below.
Position Pawu
/ /
Pressure a. ai+a2 a,
2
Figure 3-9. Method by which Pthreshold is now defined. Example operating points xl and x2 have equal As.
Equation (3-1) still holds, but now the threshold pressure is defined as in equation (3-3) below.
Xmeasurement + 0.5keq(al + a
2)
threshold
(3-3)
The experimental system response obtained when using this control scheme is shown below in Figure 3-10.
100 - Position Response -Position Input 0 I V I I I 0 100 200 300 400 500 600 Time (seconds)
Figure 3-10. Actuator position step response using "If, Then" control scheme and Pthreshold as defined in equation (3-3).
Implementation of this new controller yielded excellent results, as the steady state 'bounces' and fluctuations were eliminated. Furthermore, the greatest steady state error
was 2.2% of valve travel, but in some cases was even eliminated. Interestingly, the
steady state error only occurred when the pressure was being released and the valve was opening. In an effort to further improve this steady state error, an integral control component was added. The new controller took the form shown in Figure 3-11 below.
P-I
Figure 3-11. Basic schematic of 'If, Then" control system with PI control implemented. Equations of operation are dependent upon parameters from open loop system characterization and continuous position
and pressure feedback.
During testing, it was determined that anti-windup also needed to be
implemented. Once incorporated, the experimental response was that shown in Figure 3-12 below.
100 - Position Response 90 - Position Input S80-0 70 > 60 c 50 0 0 40 0. 0 30 S20 10 0 50 100 150 200 250 300 350 400 450 Time (seconds)
Figure 3-12. Actuator position step response using "If, Then" control scheme with PI control and Pthreshold
as defined in equation (3-3).
Once PI control was implemented, steady state response improved tremendously, with steady state error reduced to 1.3% of total valve travel, a five-fold improvement over the steady state error with the original positioners. Furthermore, there were no steady state position fluctuations. Although not shown in Figure 3-12, the actuator was also able to move through 100% of the valve's travel.
CHAPTER
4
Conclusions
In this study, a steady state and transient model of the open loop
transducer/actuator/valve system response was effectively developed. Furthermore, an effective backlash controller was implemented in which the actions of the controller were based on the internal state of the system determined by reliable measurements. Because of its simplicity, this control method can be easily implemented in well characterized systems that have open loop backlash. More specifically, this controller can be used to now implement a temperature control loop on this specific system, as is discussed in the motivation section. Care will have to be taken, however, as the shape of the steady state response will change slightly once fluid flow is added through the valve [7].
References
[ 1] Dirckx, Matthew, Design of a Fast Cycle Time Hot Micro-Embossing Machine. S.M. Thesis, Massachusetts Institute of Technology, 2005.
[2] B. Schenker and M. Agarwal. "Output prediction in systems with backlash." Proceedings of the Institution of Mechanical Engineers - Part I - Journal of
Systems & Control Engineering. Vol. 212, Issue 1, p. 17-26, 1998.
[3] Rostalski, P. Besselmann, T., Bari, M., Van Belzen, F. and Morari, M. "A hybrid approach to modeling, control and state estimation of mechanical systems with backlash." International Journal of Control, Vol. 80, Issue 11, p. 1729 - 1740,
2007.
[4] Jayawardhana, Bayu, Logemann, Hartmut and Ryan, Eugene P. "PID control of second-order systems with hysteresis." International Journal of Control, Vol. 81, No. 8, p. 1331 - 1342, 2008.
[5] X. Tan and J. Baras. "Modeling and control of hysteresis in magnetostrictive actuators." Automatica, P. 1469 - 1480, 2004.
[6] J. Tierno, K. Kim, S. Lacy, and D. Bernstein. "Describing Function Analysis of an Anti-Backlash Controller." Proceedings of the American Control Conference. June 2000; Chicago, Illinois.
[7] T. Wakui, T. Hashizume, and T. Nishijima. "Valve Hysteresis Compensation Considering Flow Conditions for Digital Valve Positioner." SICE Annual Conference in Sapporo, August 4-6, 2004; Hokkaido Institute of Technology, Japan.