Publisher’s version / Version de l'éditeur:
Canadian Geotechnical Journal, 30, June 3, pp. 441-454, 1993-06
READ THESE TERMS AND CONDITIONS CAREFULLY BEFORE USING THIS WEBSITE. https://nrc-publications.canada.ca/eng/copyright
Vous avez des questions? Nous pouvons vous aider. Pour communiquer directement avec un auteur, consultez la première page de la revue dans laquelle son article a été publié afin de trouver ses coordonnées. Si vous n’arrivez pas à les repérer, communiquez avec nous à PublicationsArchive-ArchivesPublications@nrc-cnrc.gc.ca.
Questions? Contact the NRC Publications Archive team at
PublicationsArchive-ArchivesPublications@nrc-cnrc.gc.ca. If you wish to email the authors directly, please see the first page of the publication for their contact information.
NRC Publications Archive
Archives des publications du CNRC
This publication could be one of several versions: author’s original, accepted manuscript or the publisher’s version. / La version de cette publication peut être l’une des suivantes : la version prépublication de l’auteur, la version acceptée du manuscrit ou la version de l’éditeur.
Access and use of this website and the material on it are subject to the Terms and Conditions set forth at
Uplift of model steel pipelines embedded in polycrystalline ice
Rajani, B. B.; Morgenstern, N. R.
https://publications-cnrc.canada.ca/fra/droits
L’accès à ce site Web et l’utilisation de son contenu sont assujettis aux conditions présentées dans le site
LISEZ CES CONDITIONS ATTENTIVEMENT AVANT D’UTILISER CE SITE WEB.
NRC Publications Record / Notice d'Archives des publications de CNRC:
https://nrc-publications.canada.ca/eng/view/object/?id=3aba270d-c950-45df-aae8-0e2c99812e9e https://publications-cnrc.canada.ca/fra/voir/objet/?id=3aba270d-c950-45df-aae8-0e2c99812e9eE
F-' Nat~onal Research A Conseil nationalH I
ISm
Counc~l Canada de recherches Canada2
1
c1Reprinted from
Reimpression de
la
Canadian
Revue
Geotechnical
Icanadienne
Journal
de
geotechnique
UdiR
of
model steel pipelines embedded
)in
polycrystalline ice
6.
RAJANI
AND
N.
MORGENSTERN
Pages
441
-
454
Uplift of model steel pipelines embedded in polycrystalline ice
B. RAJANI' AND N. MORGENSTERNUniversity of Alberta, Department of Civil Engineering, Edmonton, Alta., Canada T6G 2G7
Received May 8, 1992 Accepted January 15, 1993
The experimental behaviour of model pipelines embedded in polycrystalline ice is studied to improve the understanding of the behaviour of a chilled buried pipeline subjected to frost heave. Two model pipelines with slightly different radius to thickness ratios were subjected to prescribed displacement rates. Their behaviour was monitored until peak strains corresponding to current acceptable strain limits, often referred to as the wrinkling strains, were exceeded. The sizing of the model pipelines and experimental setup are described and detailed procedures on polycrystalline ice sample preparation are given. Representative core samples of polycrystalline ice were tested to determine its elastic and creep properties. The observed and predicted responses of strain histories in the pipeline are compared and acceptable agreement between the responses is obtained.
Key words: experimental behaviour, embedded model pipelines, polycrystalline ice, frost heave, uplift resis- tance, critical strain limits.
Le comportement expkrimental de pipelines modbles enfouis dans la glace polycristalline est CtudiC de f a ~ o n B
amCliorer la comprChension du comportement d'un pipeline froid enfoui subissant un soulkvement dQ au gel. Deux pipelines modbles ayant des rapports rayons sur Cpaisseur legbrement differents ont CtC soumis a des vitesses de dkplacement donnCes. Leur comportement a CtC mesurC jusqu'au dkpassement des dkformations de pic correspondant a des limites de dkformation couramment acceptCes, souvent appelCes diformations de plissement Le dimensionnement des pipelines modbles et le montage expCrimental sont dCcrits, et les procCdures dCtaillCes pour la prkparation des Cchantillons de glace polycristalline sont donnCes. Des carottes reprksentatives de glace polycristaline ont CtC soumises B des essais pour determiner ses propriCtCs Clastiques de m&me que ses pro- priCtCs de fluage. Les rCactions observCes et prCdites des histoires de contrainte dans le pipeline sont com- parCes, et une concordance acceptable entre les rCactions est obtenue.
Mots cle's : comportement experimental, pipelines modbles enfouis, glace polycristalline, soulbvement dQ au gel, rCsistance au soulbvement, limites de dCformation critique.
[Traduit par la rCdaction] Can. Geotech. J. 30, 441-454 (1993)
Introduction determine the level of strains that can b e tolerated in a
over
the past decade several proposa~s have been put pipeline before serviceability is seriously hindered and forward for the construction of a gas pipeline from the ultimately if structural integrity is to be assured.Arctic to the southern populated areas of North America TO date, only one experimental pipeline facility has (American Society of Civil Engineers 1978). These been set u p (Caen, France) that attempts to monitor the pipelines must be buried because of regulatory require- development of strains in the pipeline as differential frost ments that are intended t o minimize environmental dam- heave develops. A lot of economical and experimental age. ~t has been suggested that by transporting gas at effort has been devoted to obtain this unique set of data, below-freezing temperatures (i.e., chilled gas) the thaw- and indeed the data can be very useful in the validation ing of permafrost soils would be avoided. ~h~ transmis- of models o n frost heave, frozen soil - pipeline interac- sion of gas would lead t~ freezing of unfrozen tion, etc. The details of the experimental data are avail- soils in zones of shallow and discontinuous permafrost. able through numerous reports ( ~ a l l i m o r e and c r a w f o r d A frozen annulus will develop in a frost-susceptible soil 1985; Geotechnical Sciences Laboratories 1986, 1988, around the gas pipeline, leading to significant water 1989).
migration to the freezing front and the formation of ice The Pipeline (0.273 x 0.0048 m) tested at Caen never lenses. consequently, the induced frost heave will force experienced strains beyond the elastic strain limit. The the pipeline to move The pipeline will undergo pipeline underwent four freeze-thaw cycles and, since substantial straining which can lead to the formation of the response of the pipeline during each was wrinkling buckles, especially when the pipeline traverses slightly different, the interpretation of the responses led a transition zone between two soils with different frost US to infer that factors such as homogeneity of creep soil susceptibilities o r between an unfrozen and previously properties need to b e addressed as discussed previously frozen soil. Ever since the chilled gas pipeline concept (RaJani 1992). A major source of uncertainty in the field was proposed, the effect of frost heave o n the perfor- experimental studies, as in those performed at Caen, is in mance of pipelines was identified as an important issue the geomechanical (both elastic and creep) properties. AS that should b e addressed. A designer would have to indicated by Rajani and Morgenstern (1992), the elastic and creep properties are crucial t o the reliable prediction of stresses in the pipeline. The elastic moduli obtained 'present address: Institute for Research in Construction, from test samples o n sand and silt were unusually high, National Research Council, Ottawa, Ont., Canada KIA 0R6. as discussed by Rajani (1992). In addition, the reported Printed in Canada 1 Imprime au Canada
442 CAN. GEOTECH. J. VOL. 30, 1993
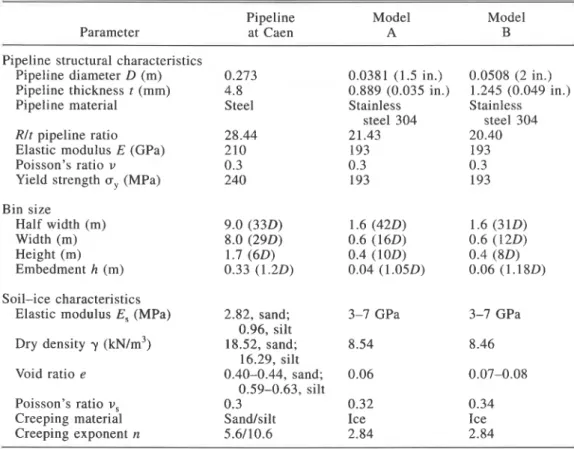
TABLE 1. Comparison of characteristics of pipeline at Caen, France, and model pipelines
Parameter
Pipeline Model Model
at Caen A B
Pipeline structural characteristics Pipeline diameter 0 (m) Pipeline thickness t (mm) Pipeline material
Rlt pipeline ratio Elastic modulus E (GPa) Poisson's ratio v
Yield strength a, (MPa) Bin size Half width (m) Width (m) Height (m) Embedment h (m) 0.273 0.0381 (1.5 in.) 4.8 0.889 (0.035 in.) Steel Stainless steel 304 28.44 21.43 210 193 0.3 0.3 240 193 0.0508 (2 in.) 1.245 (0.049 in.) Stainless steel 304 20.40 193 0.3 193 Soil-ice characteristics
Elastic modulus E, (MPa) 2.82, sand; 3-7 GPa 3-7 GPa 0.96, silt
Dry density y ( k ~ l m ~ ) 18.52, sand; 8.54 8.46 16.29, silt
Void ratio e 0.40-0.44, sand; 0.06 0.07-0.08
0.59-0.63, silt
Poisson's ratio v, 0.3 0.32 0.34
Creeping material Sandlsilt Ice Ice
Creeping exponent n 5.6110.6 2.84 2.84
creep exponent n in the Norton creep flow law for silt is presumed to be on the high side. Small-scale laboratory model testing, where careful control can be exercised over the different aspects of the frozen soil - pipeline interaction, is warranted, and the results would serve to complement some of the observations at the Caen experi- mental facility. It would also lead to a better understanding of the frozen soil - pipeline interaction problem. Poly- crystalline ice is the preferable medium for embedment, since its elastic and creep properties have been con- firmed through a considerable amount of testing by dif- ferent researchers. These tests are also intended to vali- date findings of Rajani and Morgenstern (1992) on the behaviour of an embedded beam in a creeping medium. The use of polycrystalline ice reduces the uncertainties in the experimental results, so the differences in the the- oretical predictions and experimental observations cannot be solely attributed to variations in properties of the sur- rounding frozen medium. Nonetheless, typical data (Table 1) on mechanical properties of polycrystalline ice and frozen soil indicate that there is not much qualitative difference in the elastic and creep behaviour between the two material types. Another objective of carrying out these tests was to develop sufficient resistance to uplift in the model pipelines so that portions of the pipeline would strain beyond the elastic limit and well beyond the currently accepted strain limits. These arguments pro- vided a basis for carrying out scaled laboratory testing of model pipelines in polycrystalline ice.
Nixon (1984) performed experiments on solid model piles embedded in polycrystalline ice, but several aspects such as shallow embedment, imposed displacements or the implications of a thin tubular section (i.e., radius
thickness ratio) were not addressed. More recently, Foriero and Ladanyi (1991) have performed lateral load tests on aluminum (tubular) and steel (solid) model piles embedded in frozen sand, but again aspects of particular interest to pipelines were not studied. These aspects would not normally be of major concern for the design of laterally loaded piles.
In a realistic scenario, frost penetration would proceed on the commencement of transportation of chilled gas, and frost heave in the frost-susceptible soil would develop concurrently. The testing of a model pipeline embedded in polycrystalline ice assumes that the freezing of the surrounding soil in the field takes place instanta- neously. In practice the pipeline would interact with increasing extent of frozen soil as the frost front advances. It is expected that significant uplift resistance develops within the frozen soil mass immediately above and around the chilled gas pipeline. The fact that the stress wave in the pipeline at Caen formed during the early stages of the experiment and that its shape did not change significantly with time supports this view.
Equipment design
The experimental setup to study pipeline - poly- crystalline ice interaction involves three basic aspects: (i) the proportioning of the model pipelines and of the surrounding polycrystalline ice sample, (ii) the prepara- tion of the ice block sample itself, and (iii) the loading arrangement that adequately represents frost heave. Each of these aspects will be described in detail, followed by experimental observations of the model pipelines sub- jected to an end prescribed displacement rate.
RAJANI AND MORGENSTERN
edge of discontinuous permafrost
\
free field frost heave
- - -
-
-
7-7--
polyqstalline ice1
undeformed pipeline\
1 Ifrost-susceptible soil nonfrost-susceptible soil
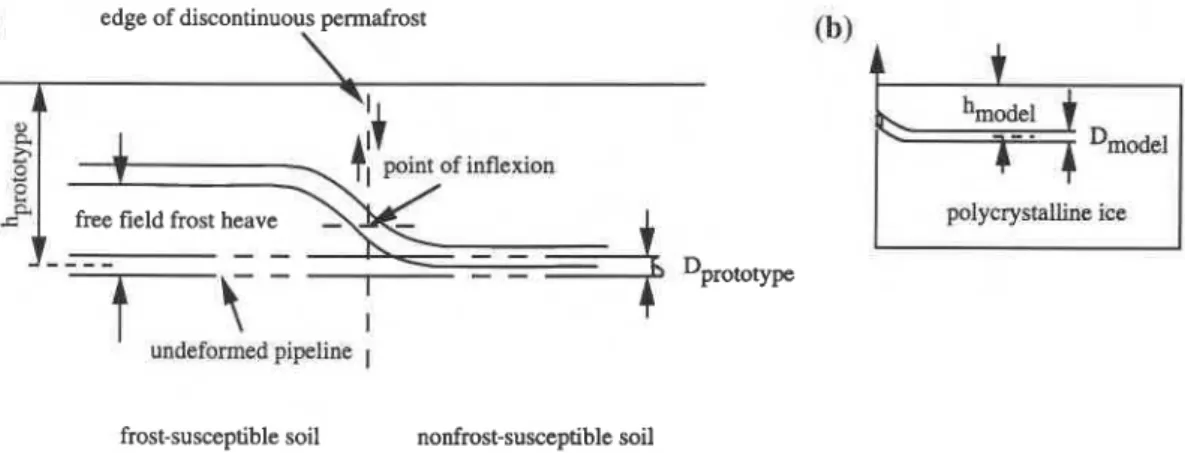
FIG. 1. Comparison of (a) prototype in field conditions and (b) experimental model (not to scale).
A prototype pipeline crossing the zone of discontinu- ous permafrost would be subjected to high strains in that portion of the pipeline embedded in a previously unfrozen soil. The response of the pipeline subjected to a steady frost heave at the interface of the discontinuous permafrost would have nearly double curvature if the stiffness of the frozen soil were quite high. The experi- ence at the Caen experimental facility (Dallimore and Crawford 1985) indicates that the nearly double curva- ture response exists despite the relatively shallow burial of the pipeline. The plane strain study, performed by Nixon et al. (1983) of a continuum where one half of the soil was frost susceptible and the pipeline was consid- ered to be passive, indicated that the response had dou- ble curvature. These considerations indicate that it would suffice to model only one half of the pipeline, thus leading to a much simplified experimental design. Figure 1 shows how the experimental model pipeline setup relates to the prototype in field conditions.
Proportioning of the model pipeline and polycrystalline ice block sample
Structural integrity must be assured at all times during the operation of a pipeline. In the present context, the effects of internal pressure or the temperature differential were not considered, but these conditions can be accounted for by making use of currently available ana- lytical methods. Flexural strains are induced in the pipe- line wall as the pipeline is subjected to increasing differ- ential frost heave movement and thus eventually causing wrinkling (local buckling) in the pipeline. Hence, the design criterion to contain damage due to rupture and leakage of contents is to limit the compressive strain. Two distinct buckling failure modes (Yun and Kyriakides 1990) have been found to occur for buried pipelines. One failure mode is when the pipeline buckles as an overall beam (Euler-type buckling), and usually this mode would be expected when the pipeline is stocky (low ratio of pipeline radius (R) to wall thickness (t)) and very large axial loads are present. The other failure mode is when the principal action is flexural and the resistance is through shell action (thin-walled pipelines), thus enhanc- ing the formation of local wrinkles. It is the latter approach that is more appropriate in the present context. Several criteria have emerged over the years (Southwell 1914; Wilson and Newmark 1933; Bouwkamp and Stephen 1973; Kennedy et al. 1977; Hall and Newmark
1978; Langner 1984; Nyman and Lara 1986; Gresnigt 1986) for limiting flexural strain in tubular pipes. It is not the intent here to provide an exhaustive review of the wrinkling strain criterion, since a brief review has been recently undertaken by Kim and Velasco (1988). The
critical strain E, is expressed in two general forms:
0.605 ct [1] E c =-
R
where c is a critical strain criterion constant.
The first expression corresponds to the form of a theo- retical solution based on elastic buckling developed by Southwell (1914). The second expression stems from a best fit of the experimental data (Sherman 1976; Langner 1984) which distinguishes failures between whether local buckling was observed or not. The constant 0.605 has been determined by Southwell (1914) for elastic buck- ling, and the constant c was introduced by Wilson and Newmark (1933) to account for experimental deviation. The value of c varies from 1.0 for perfect tubes to 0.25 for manufactured tubes. The lower values of c reflect the importance of initial imperfections present in the geometry of the pipe as shown by Kyriakides et al. (1983). It is also important to note that all criteria based on limiting strain were established from experiments on steel tubes performed in air, i.e., with no restraint from the sur- rounding medium. The different existing criteria based
on experimental tests are summarized in Table 2. Since
the critical strain is predominantly a function of the ratio of pipeline radius to wall thickness, the present model pipe- lines were proportioned so that the model design would be within the range of probable prototype design. The Alaska Gas Pipeline Project envisaged the construction of a 1.22-m-diameter (48 in.) pipeline to transport natural gas from the north slope of Alaska to western Canada for markets in the United States. If pipeline wall thickness of 19 mm (0.75 in.) is assumed, then the Rlt ratio for the proposed Alaska Pipeline is about 32. For instance, the pipeline at Caen has a Rlt ratio of 28.44. Consequently, for the present experiments two model stainless (seam-
less) steel pipelines with Rlt ratios of 21.43 (19.05 x
0.89 mm) and 20.40 (25.4
x
1.24 mm) were selected.444 CAN. GEOTECH. J. VOL. 30, 1993
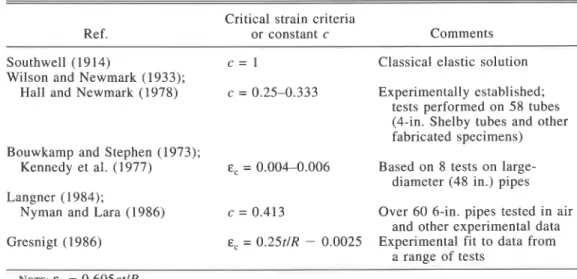
TABLE 2. Summary of critical stain criterion for pipelines
Ref.
Critical strain criteria
or constant c Comments
Southwell (1914) c = l Classical elastic solution
Wilson and Newmark (1933);
Hall and Newmark (1978) c = 0.25-0.333 Experimentally established;
tests performed on 58 tubes (4-in. Shelby tubes and other fabricated specimens) Bouwkamp and Stephen (1973);
Kennedy et al. (1977) E, = 0.004-0.006 Based on 8 tests on large-
diameter (48 in.) pipes Langner (1984);
Nyman and Lara (1986) c = 0.413 Over 60 6-in. pipes tested in air
and other experimental data
Gresnigt (1986) E, = 0.25tlR - 0.0025 Experimental fit to data from
a range of tests
NOTE: E, = 0.605ctlR.
of adequate size to permit easy installation of resistance strain gauges on the model pipelines.
An important aspect that needed to be addressed was to suitably dimension the box where the model pipelines were to be embedded in the polycrystalline ice block sample. The length of the box was sized in accordance with the stress-wave length that would be set up along the pipeline. The elastic modulus of polycrystalline ice is dependent on the rate of loading, porosity, salinity and temperature (Michel 1978). It can vary as much as 8 to 10 times less than that of pure ice, as shown by Michel (1978) and Sinha (1989). Sego et al. (1982) demonstrated that the secant elastic modulus for frozen sand is highly dependent on strain rate and that the reduction can be quite large. A range of 40-50 MPa for the elastic modu- lus of polycrystalline ice was conservatively selected for determining the size of stress wave that would be set up as a result of the prescribed displacement rate. The
analysis of a embedded i n a creeping medium
(Rajani and Morgenstern 1992) indicated that a pipeline
length of approximately 32-40 diameters would be
required to represent the semi-infinite length of the pipe- line. It is to be noted that the pipeline at Caen had an approximate lengthldiameter ratio of 33. The width and the height of the box were based on the premise that, when considering the interaction of two adjacent laterally loaded piles, the interaction effects are disregarded if the piles are spaced at least three to four diameters apart. To satisfy this criterion as well as to ensure minimal boundary effects, the box was sized to 0.60 m in width and 0.40 m in height. The box for the sample was manufactured from 18-mm-thick (0.75 in.) PVC sheets. Table 1 com- pares the principal characteristics of the pipeline at Caen with the model pipelines tested in this study.
Preparation of a polycrystalline ice block sample
The mechanical behaviour of frozen soil has been studied by Sayles (1973), Sayles and Haines (1974), Sego and Morgenstern (1983), and others. It is now widely accepted that ice-rich frozen soil behaves like a creeping material. The frozen soil surrounding the pipeline subjected to frost heave will be associated with primary and secondary creep phases of straining. The classical studies of Glen (1955) indicate that the flow
law of polycrystalline ice is that of the Norton type. The Norton creep relationship rewritten in the generalized form as proposed by Ladanyi (1972) is
where 8 is the axial strain rate; a is the axial stress; b, and a, are proof strain rate and proof stress, respec- tively; and B and n are the creep constants. Typically,
n is about 3 (Morgenstern et al. 1980) for ice or ice-rich silts (McRoberts et al. 1978) subjected to low stresses. In search for a dependence of n and B on temperature, Morgenstern et al. (1980) found from analyses of avail- able creep data that ice behaves close to a linearly vis- cous material at temperatures close to 0°C. The con- stant B is found to be dependent on temperature and soil type. In the past, considerable attention has also been paid to the behaviour of polycrystalline ice primarily for glaciology studies and laboratory studies related to geo- technical problems. Sego and Morgenstern (1983, 1985) have studied the behaviour of laboratory-prepared poly- crystalline ice and have indeed confirmed the applicabil- ity of the Norton-type power law to describe its creep behaviour. ~ o l ~ c r ~ s t ~ l l i ~ e ice is a good material to work with, since control can be exercised over its characteris- tics (grain size, porosity, etc.) in the laboratory. The decision to use polycrystalline ice in the tests was based on the fact that its elastic and creep properties have been confirmed as result of a considerable amount of testing by different researchers. Another reason for using poly- crystalline ice was to reduce the uncertainties in the experimental results so that when it came to comparing theoretical predictions with experimental observations, discrepancies could not be solely attributed to variations in the properties of the surrounding frozen medium.
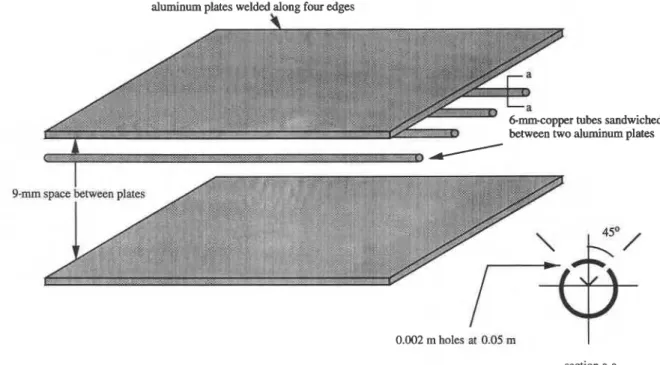
Details on sample preparation, design of sample box, and construction-of -the freezing plate are discussed briefly here, but full details can be found in Rajani (1992). The preparation of the block sample required the manufacture-of-ice that is commonly classified as T1 snow ice. The manufacture of polycrystalline ice has been reported by Sego (1980) and Jacka and Lile (1984). It
RAJANI AND MORGENSTERN 445
aluminum plates welded along four edges
I
0.002 m holes ar 0.05 rn
1
section a-a FIG. 2. Exploded view of freezing plate wafer (not to scale).was desirable to produce snow crystal seeds so that the final ice crystal size in the ice block sample was in the range of 1-2 mm, since properties of polycrystalline ice with this crystal size have been well defined. Sego and Morgenstern (1985) experienced good performance in studies related to experimental indentation of a rigid disk in polycrystalline ice of this type. This meant that the snow crystals had to pass sieve No. 20 and be retained on sieve No. 40, as suggested by Sego (1980). Several methods for obtaining a large quantity of snow with this characteristic were explored and they are discussed fully by Rajani (1992). Thin sections prepared from alternative sources of snow showed no visible differences in poly- crystalline ice grain-size distribution. Therefore the deci- sion was made to use natural snow because of abundant availability.
The natural snow crystals were sieved, and those that passed sieve No. 20 but were retained on sieve No. 40 were collected. These presieved snow crystals were rained from a large sieve (No. 20) positioned on top of the box until the box was filled. The application of a vac- uum at the top of the box helped draw cold water at near 0°C into the sample through two copper tubes (6.35 mm) with holes placed at the bottom of the sample box above the freezing plate. Normally it took about an hour to satu- rate the sample with an applied vacuum of 300 mm of mercury. The snow-water slush in the box was frozen unidirectionally as rapidly as possible by feeding liquid nitrogen through the freezing plate (Fig. 2).
Loading arrangement
It was essential to apply a displacement rate at the pipeline end that closely resembled possible field dis- placement rates as a result of frost heave. At the same time the displacement rate should be slow enough so that strains are in the ductile range of ice deformation The frost heave rate in Caen silt observed at Caen, France, was in the order of 3
x
l o p 4 mmlmin, which is fairlytypical for silty soils. Sego (1980) carried out punch tests on polycrystalline ice at typical penetration rates of 3.83-1 8.3
x
lop4 mmlmin. Consequently, a Wykeham Farrance 10-kN capacity press was adapted using a slow motor of 24 minlrevolution to obtain a displacement rate of 1.72x
mmlmin. The loading arrangement is shown in Figs. 3 and 4. The horizontal bars (0.025 x 0.025 m) of the hanger system were not as stiff as ini- tially anticipated for the test on pipeline model A. After completion of the test on pipeline model A, it was observed that the bars had undergone permanent plastic deformation. A calibration test was carried out on the hanger system, and it was found that the displacement rate at the pulling end of the pipeline was about one- third of that measured at the platen of the Wykeham Farrance machine. This reduced displacement rate was used for the finite element analysis discussed later. As a consequence, much stiffer horizontal bars (0.025x
0.050 m) were used for pipeline model B with the inten- tion of reducing the compliance in the loading hanger.
Instrumentation
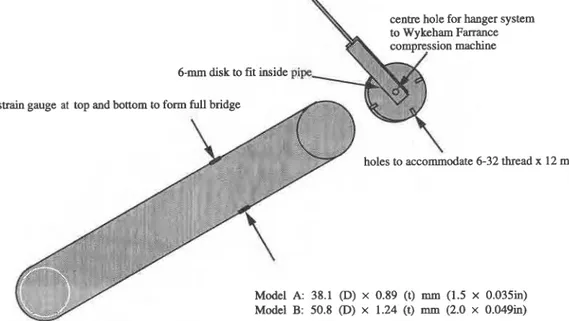
The model pipelines were instrumented with resistance strain gauges along the length of the pipeline. Strain gauges were located at both top and bottom for the first model pipeline (19.05 x 0.89 mm), and a full wheat- stone bridge was established between them so as to avoid problems with temperature compensation. Though this approach permitted the use of a reduced number of strain gauges, it was recognized that the true local strain in the pipeline would be difficult to ascertain. Consequently, independent top and bottom strain gauges were used for model pipeline B (25.4 x 1.24 mm) to remove any pos- sible uncertainty. The strain gauges on the model pipe- line A were protected by wrapping the pipe with a heat- shrink teflon-type material (FIT 221 produced by Alfa Wire Corporation). The teflon material was also chosen to represent some sort of field coating. Since an adequate
CAN. GEOTECH. J. VOL. 30. 1993
centre hole for hanger system to Wykeham Farrance
FIG. 3. Typical strain gauge arrangement and hanger system for applying displacements.
FIG. 4. General loading arrangement of an embedded model pipeline.
size of heat shrink was not available for the model pipeline B, a different wrapping material (Nitto Butyl 2-in. self-vulcanization rubber tape) was used. The model pipelines were calibrated prior to testing under a can- tilever loading arrangement. In addition, the movement of the platen of the compression machine and the corre- sponding force imposed on the pipeline were monitored by a linear voltage displacement transducer (LVDT) and a load cell, respectively. The displacements along the pipeline close to the loaded end were monitored using closely spaced LVDTs. The LVDTs were placed at the crest of the pipes through holes drilled in the ice block
sample A. An alternative procedure was used for pipeline model B where thin tubular stems were attached to the crest of the pipeline prior to freezing. These tubes acted as guides for free movement of the LVDT rods. The Hewlett Packard 24 LVDTs are capable of measuring dis- placements to an accuracy of 0.0012 mm. All the data were logged automatically every 2 h by a PC for easy retrieval using an electronic spreadsheet.
Elastic and creep properties of polycrystalline ice
It is to be expected that polycrystalline ice surrounding the model pipeline will be subjected to tensile stresses as
RAJANI AND MORGENSTERN
14~
time, hours
FIG. 5 . Constant-load creep test for polycrystalline ice sample TI-10191.
the pipeline is displaced upward. However, good tensile creep tests are difficult to perform, and only limited data are presently available. Zhu and Carbee (1987) carried out both compressive and tensile creep tests on ice-rich silt from Fairbanks, Alaska. Their purpose was to deter- mine the influence of applied stress (or applied strain rate) and temperature on strength and creep behaviour of frozen silt. Zhu and Carbee found that if the strain rate was below 1 0 - ~ / s then there was essentially no differ- ence in the tensile or compressive behaviour of frozen silt. Recent experimental work on tensile behaviour of frozen soils (silt, sand, and gravel) by Sayles (1991) con- firms the findings of Zhu and Carbee (1987). Hawkes and Mellor (1972) also reported that there was no differ- ence in tensile and compr&sive creep behaviour in poly- crystalline ice for strain rates less than 10-~/s.
The model ipeline tests were displaced at strain rates
k'
of 6-8 x 10- /s (the displacement rates were normalized by the diameter of the pipeline). Compressive and not tensile creep testing on polycrystalline ice was conducted because of the fact that the strain rates were anticipated to be less than 1 0 - ~ / s and considering the fact t h a t ade- uquate equipment required to perform tensile tests was not readily available. It is to be emphasized that the creep tests were conducted only to reassure that a large sample of polycrystalline ice with the desired and known character- istics had been prepared.
Intact core samples of 0.10 m (diameter)
x
0.3 m (height) were taken from the ice sample blocks where the pipeline models were tested using a CRREL coring bar- rel. Thin sections obtained from typical samples exam- ined under polarized light showed near uniformity of crystal size, and the background grid (10 x 10 mm) per- mitted a rough estimate of the size of the individual crystals. The thin sections were obtained by the hot-plate method as described by Sego (1980). The sonic elastic properties were obtained using piezoelectric crystals that detected the arrival of P- and S-waves. The testing pro- cedure used is given in detail by A. ~ n s t a n e s . ~ Typical2rc Sonic and mechanical properties of spray ice," Ph.D. thesis,
University of Trondheim, Norway. In preparation.
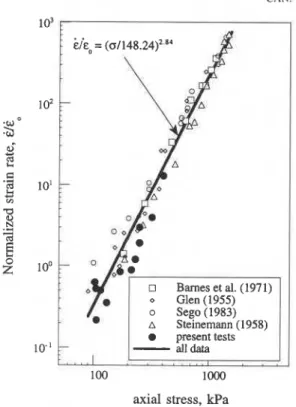
value for dynamic elastic moduli were within the 3-7 GPa range. Typical constant-load tests were carried out on 0.10-m (4 in.) samples (typically height to diameter ratio was 2) at different loads. The procedure for the constant-load creep test was essentially as outlined by Sego (1980), except that a multistaged loading procedure was applied on most samples. Typical axial strain - time history for one of the samples is shown in Fig. 5. The strain histories indicate that at low stresses (i.e., <210 kPa) primary creep had terminated after about 100-150 h. The experimental results of the creep multi- staged constant-load tests are summarized in Table 3.
The strain rates were corrected only for temperature as suggested by Sego (1980). A grain-size correction was not deemed necessary, since the ice crystals in present samples were within the 1-mm range and the fact that Sego's (1980) data are normalized with respect to a crystal size of 1 mm. The corrected normalized displacement rates are shown in Fig. 6 together with data from Sego (1980) and others. Morgenstern et al. (1980) have thor- oughly reviewed available data on creep properties of ice, and they have determined the influence of tempera- ture. The creep test results from the present series of tests on polycrystalline ice were analyzed together with other relevant data shown in Fig. 6, and the creep con- stants B and n were obtained. Table 4 shows these creep properties together with those obtained by Morgenstern et al. (1980). The data from tests on polycrystalline ice reported here serve to confirm that the creep properties of the ice block samples prepared for testing the model pipelines are within the expected range. The creep prop- erties (corrected for temperature) established by Morgenstern et al. (1980) were used in the finite element analyses for predicting strains in the pipeline since these properties were based on an exhaustive review of the data on polycrystalline ice available then.
Structural properties of pipeline steel 304 A 0.3-m-long section from each of the model pipelines was instrumented with strain gauges to determine the structural properties of stainless steel 304. Custom-made stems were welded to both ends of the test specimen so
448 CAN. GEOTECH. J . VOL. 30, 1993
TABLE 3. Summary of constant-load creep test on samples of
polycrystalline ice
Density Temperaturea Stress Corrected
Sample ( ~ ~ / m ~ ) (kPa) strain rate
TI-10191 0.876 -2.7(1.20) 115 0.495 -3.0(1.28) 213 0.882 -3.0(1.28) 230 1.193 -2.0(1.00) 130 0.35 1 T2-11/91 0.864 -4.3(1.61) 400 12.98 A4-01/92 0.862 -5.0(1.77) 106 0.216 -5.0(1.77) 250 2.977 -3.2(1.33) 320 3.945 B5-01/92 0.848 -3.4(1.38) 105 0.519 -4.0(1.54) 170 0.843 B7-02/92 0.853 -3.3(1.36) 103 0.622 -3.3(1.36) 250 1.903
'The values in parentheses are correction factors for strain rates nor- malization at -2OC.
10"
TABLE 4. Creep properties of polycrystalline ice at -2OC
100 loo0
Creep Creep
axial stress, kPa exponent coefficient
Ref. n B ( k ~ a - " .
FIG. 6. Corrected normalized strain rate vs. axial stress for
polycrystalline ice at -2OC. Morgenstern et al. (1980) 3.00 2.03x10-~
Present creep tests and
500 others reported by Sego
(1980) 2.84 5.98x10-~
Parameters used for
analysis (-3°C) 3.00 1 . 5 3 ~ 1 0 - ~ stem failures ,,-I- -
g----
(aeo* Ecp);
+
E, = 193 GPa;
-i
l
I I . I . : . I . . . I , , , , axial strain, %FIG. 7. Experimental stress-strain characteristics of pipeline
models A (-) and B (- - -) (stainless steel 304). a,, = 193
MPa; E,, = 0.1%.
that specimens could be tested in the available MTS testing machine. The loading speed was slightly increased at about 2% strain for the first specimen, and the tests were prematurely terminated when a weld failure occurred at the stem-specimen connection. The structural steel char- acteristics determined from the tests (Fig. 7) are summa- rized in Table 1. The yield stress (a,) as defined by the
Canadian Standards Association (1979) is in the
228-315 MPa range at a strain of 0.5% (E,). Stainless steel 304 maintains stress-strain elastic proportionality
(E,,) until 0.1% axial strain. It is interesting to note that a much lower yield strength was attained by the pipeline
model B.
Observation of strain-time histories in model pipelines
Data for only one of the tests are discussed here although two model pipelines described earlier were tested. The overall behaviour of the two model pipelines was observed to be similar and complete data on both tests can be found in Rajani (1992). The displacement- time and load-time histories monitored at the free end of
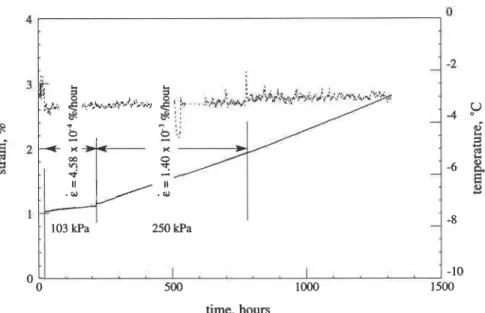
the pipeline model A are shown in Fig. 8. While pipe-
line A was being steadily displaced, the end load increased for about 1000 h when it stabilized at a load
level of 2744 N. During the test on pipeline model A,
the monitoring of the ice temperature (Fig. 9) com- menced after problems were detected in the refrigeration system. The temperature was monitored by setting a ther- mistor (resistance temperature detector) in the ice block sample at a depth of 0.10 m. A gap was noted to develop at the back of the pipeline as it was steadily displaced
upwards. The flexural strain - time history for pipeline
model A is shown in Fig. 10.
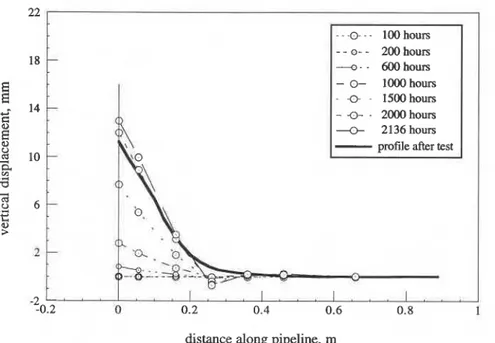
The deformed shape of the pipeline obtained from the LVDTs placed at the crest of the pipeline is shown in Fig. 11. The deformed shape measured after the comple-
RAJANI AND MORGENSTERN
end load predicted
from analysis assuming
md
hldticms
pipeline remains elastic / develop at 600 hourspeak load = 2744 N 1 3
- -
- -
-
_
pipeline model A 1 1 . _ . , 1 , , , , 1 , , , \ , -10 , , , , I -1 0 500 lMlO 1500 2000 2500 time, hoursFIG. 8 . End displacement and load-time histories for pipeline model A.
0 500 loo0 1500 2000 2500
time, hours
F I G . 9. End displacement - time and temperature-time histories for pipeline model A. Displacement rate = 2.58 x mlday.
bwer bound according to
Wilson and Newmark (1933).
.
'1
"\
Bouwkamp and Stephen (l973) -, '
/ .
* /
.-
A Y 4000 : / ; r-
r/ . time, hours450 CAN. GEOTECH. J. VOL. 30, 1993 - - o- - 200 hours 4 - - 600 hours - 0- 1000hours - -0 - 1500 hours -
+
- 2000 hours -c- 2136 hoursdistance along pipeline, m
FIG. 11. Vertical displacement profile histories for pipeline model A. Stainless steel 304 pipeline, 38.91 mm (1.5 in.) diameter x
0.889 mm (0.035 in.) wall thickness.
10 OOO lower bound
Y
U---
100 hours & -- - -
200 hours 600 hours 1000 hours 1500 hours 2000 hours 2136 hoursdistance along pipeline, m
FIG. 12. Experimental flexural strain profile histories for pipeline model A.
tion of the test (pipeline model A) compared well with the last monitored shape and provided additional evi- dence on the reliability of the LVDTs during the test that lasted for about 90 days.
The flexural-strain profiles developed along the pipe- line model A for different time intervals are shown in
Fig. 12. The stress imposed on the ice as a result of the
load developed at the end of the pipe (pulling end) can be estimated approximately from statics if a fully plastic moment is assumed to develop at the point of maximum strain. This approach gives an estimate of the average resistance due to uplift of the pipeline. The average reac- tion intensity calculated in this manner for pipeline model A is within the 100-300 kPa range. As noted
before, the constant-load creep data on polycrystalline ice indicate that primary creep is over after about 150 h, and consequently the application of Norton's secondary creep flow law for analysis is satisfactory for practical purposes. The strain profile is observed to be fairly smooth for the first 600 h approximately for pipeline
models A and B when the strains are below 0.1%.
Thereafter the material of the pipeline model response is nonlinear. After the tests were completed, the deformed profile of the bent pipeline models was obtained along the crest of the pipeline at 25-mm intervals. The final curvature was then estimated from the deformed shape using a three-point finite-difference formula. Since the determination of the curvature essentially involves
RAJANI AND MORGENSTERN
Gresnigt (1 986)
,?
I
-
from strain gauges at 2188 hoursI
-
:
;A
(
-
a- stmhs F m deformed shap (in air)I
lowerbound 1
? \
I
- - -m - - - strains f m finite element analysisI
according to I
5 ~ i l s o n and
Newmark (1933) Bouwkamp j . ~ t c ~ h o n (lY73)
distance along pipeline, m
FIG. 13. Comparison of final flexural strain profile time histories before thaw obtained from strain gauges, strains determined from deformed shape, and predicted strains for pipeline model A.
numerical differentiation, the results can be very sensi- tive to small variations in the original data. However, the purpose of determining the flexural strains from the per- manent deformed shape of pipeline models was only to confirm the final strains measured using electrical resis- tance strain gauges. A more elaborate procedure, such as fitting a cubic spline or a high-order polynomial to the deformed shape, was not attempted for the same reasons stated earlier. The flexural strains were estimated from curvatures, assuming that the neutral axis was still at the centre of the pipe. A comparison of the peak strains (Fig. 13) obtained from the two different methods indeed confirmed that the electrical resistance strain gauges had - -
performed satisfactorily throughout the tests.
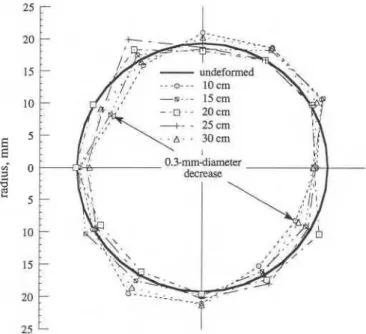
Circumferential measurements at different sections along the model pipelines were obtained to determine if significant ovality of the circular cross section had taken place. Figure 14 shows the deformed cross-sectional shape (exaggerated 20 times) of the pipeline at different sections of the pipeline. The circumferential readings were performed with a displacement dial gauge with an accuracy of 0.0254 mm (0.001 in.). These measurements were also confirmed independently using an electronic caliper. The maximum ovality 6 (inward)-registered is in the order of 0.15 mm. In terms of the net diametrical change di(%) = 2(6/0)100, this amounts to a change of 0.78%. In fact the ovality is hardly discernible, and no wrinkles or substantial local deformations were present.
Discussion of experimental results
If pipeline models A and B were to represent the pro- totype, then it is most probable that the pigging service- ability of these pipeline models would not be affected. Serviceability is not hindered despite the fact that all strain limits, as suggested by Wilson and Newmark (1933), Bouwkamp and Stephen (1973), Sherman (1976), and Gresnigt (1986), were exceeded (Fig. 13). It is most probable that the restraint offered by the surrounding stiff medium arrests the formation of wrinkles, and sub-
FIG. 14. Out-of-roundness profiles at different sections along pipeline model A.
stantially more flexural strain, as a result of frost heave, can be tolerated before serviceability would be severely hindered. Yun and Kyriakides (1990) found through analysis of shell buckling that imperfections have a domi- nant effect over the restraint offered by a stiff medium for the load-carrying capacity for a pipeline subjected to axial loads. Even though the restraint offered by the sur- rounding stiff medium does not affect the load-carrying capacity, it has a notable effect on the critical strain. It is important to make this distinction because design criteria are based on serviceability with respect to pigging as well as the need to avoid rupture when subjected to uplift due to frost heave. A similar situation (Yudovich and Morgan 1989) arises for deep oil-gas casings where
452 CAN. GEOTECH. J. VOL. 30, 1993 experimental da&i I
"
/
prediction(2::
Zk:E
1 1
-
o- 1800 hours-
. -a--
. 2 136 hoursdistance along pipeline, m
FIG. 15. Comparison of measured and predicted flexural strain profiles for pipeline model A.
loading on the casings is imposed by the collapse of high-porosity chalks in reservoirs at the Ekofisk site in the North Sea. Since these reservoirs are deep, the stiff- ness of the surrounding chalk would be highbecause its elastic modulus is dependent on the confining stress. Statistical analyses of casing serviceability and critical strain indicated that strains as high as 5-6% could be tolerated without posing a major hindrance for casing service.
Comparison of experimental behaviour with analysis The numerical Winkler model developed for a beam
embedded in a creeping medium (Rajani and
Morgenstern 1992) was used to evaluate the response of the model pipelines subjected to steady displacement for over 2000 h. The finite element analyses were performed using Adina R&D, Inc. (1984), where the polycrystalline ice is represented by discrete creeping springs and the pipeline itself is represented by beam elements. Adina R&D, Inc. (1984) permits the specification of a tubular cross section whereby the material nonlinearity can be taken into account in the simplest form. The material nonlinearity of steel was limited to a bilinear relationship along the lines suggested by the Committee on Gas and Liquid Fuel Lifelines (1984). All the pertinent data for
individual components of the pipeline - polycrystalline
ice which were discussed earlier helped to define all the relevant properties with minimal uncertainties.
The strain-wave profile during the initial period, i.e., before 512 h, helped to establish the elastic subgrade foundation modulus (i.e., elastic modulus of the sur- rounding ice). Since the solution for a beam embedded in a creeping medium is based on the correspondence principle, it is essential to match the elastic response with the form of the initial observed response. The pro- cedure used was essentially the same as that discussed by Rajani and Morgenstern (1992). Identification of the location of the peak strain permitted the determination of the most appropriate value of elastic or instantaneous modulus of ice, which was estimated to be 61 MPa for
both models A and B. The marked difference between
the elastic modulus determined from sonic measurements and from pipeline-ice interaction is related to strain-rate effects. Another source of discrepancy is perhaps in the limitation of Biot's (1937) or Vesic's (1961) formulae to translate the elastic continuum properties to foundation subgrade modulus. In the nonlinear analysis an integra-
tion order of 5
x
3x
5 ( r , s, 8) was used for the pipebeam element. Tawfik (1986) argues that the trilinear material model as proposed by the Committee on Gas and Liquid Fuel Lifelines (1984) for steel can lead to considerably higher estimated strains than would be obtained by a curvilinear material model like the Ramberg-Osgood model. This is primarily due to the fact that at large strains (>4%) no stiffness is attributed to the material. This effect need not be of concern in the pre- sent analysis, since the strains do not approach this strain limit. Nonetheless, Tawfik (1986) observes that when the material model is represented by the curvilinear form, the strain wave is of an oscillatory nature near zones where plastic deformations take place. A bilinear stress-strain relation for steel was selected for the finite element nonlinear analysis, and the prediction of peak strain was largely dependent on the elastic limit estab- lished from the uniaxial tests discussed earlier. If a bilinear stress-strain relation as suggested by the Committee on Gas and Liquid Fuel Lifelines (1984) is used, then the predicted peak strains are considerably reduced. This observation also confirms Tawfik's (1986) findings that a discontinuous representation of the stress-strain relation for steel is not quite appropriate for realistic predictions.
Figure 15 shows the comparison of predicted and mea- sured strain profiles at different time periods. The pre- dicted and experimental flexural strain profiles match quite well for strains below the elastic strain proportion-
ality limit (&,,) of 1000 kc. However, for strains beyond
the elastic strain proportionality limit, the extent of the predicted plastic deformations (predicted versus mea- sured) also compares well except that the predicted peak flexural strains are considerably higher than those
RAJANI AND MORGENSTERN 453 observed. The principal reason for this discrepancy is
due to the fact that the pipeline is represented by a two- dimensional beam element in the finite element analyses and, since the discretization is too coarse (typically one diameter of pipe), it is unable to account for stress redis- tribution that takes place i n the pipeline as significant plastic strains develop. However, a three-dimensional analysis, where the pipe is represented by shell elements and surrounding medium by three-dimensional brick ele- ments, would perhaps reproduce this redistribution of stresses more realistically, but the analysis would be pro- hibitively costly.
Conclusions
A thorough description of the experimental procedure
for carrying out model pipeline tests has been provided. Two different model size pipelines were tested in poly- crystalline ice with continuous monitoring of flexural strains, displacements, and temperature. Evidence from the Caen experimental facility and the analysis of a beam embedded in a creeping medium studied by Rajani and Morgenstern (1992) indicate that a half-sinusoidal stress or strain wave is set u p along the pipeline as the pipeline steadily displaces upward at one end. The experimental data from the model pipelines indeed confirm that a half- sinusoidal strain wavk is formed along the pipeline and a redistribution of stresses takes place once some portion of the model exceeds the yield stress. It seems that, though the burial of the pipeline is shallow, for the pur- pose of this analysis it can b e regarded as being deeply buried if the surrounding medium is very stiff.
Although the Rlt ratio of the model pipelines is o n the low side in comparison to a p r o t o t y p e ~ p ~ p e l i n e , buckling or wrinkling was not observed as in the experiments con- ducted by Bouwkamp and Stephen (1973) or Stephens e t al. (1982). Although there is undoubtedly loss of con- tact at the bottom of the pipe displaced upward, inward ovalization at the crown would b e accompanied by out- ward bulging at the quarter points where stiff restraint from the ice would be encountered. Nonetheless, it is to be noted that out-of-roundness measurements did not indicate any significant ovalization. This mechanism of restraint offered by the surrounding media has been dis- cussed by Gresnigt (1986) and provides evidence that it
is an important mechanism to consider for pipeline -
frozen soil interaction. Though the strains exceeded cur-
-
rently accepted strain limits, the serviceability was not hindered. We therefore infer that the surrounding stiff medium retards the formation of wrinkles. This suggests that the critical strain limit can be increased considerably without jeopardizing the reliability of the pipeline. The experimental results presented i n this paper d o indicate that more tests are required to confirm t h e findings of this paper, and pipelines with higher Rlt and scaling ratios should be tested.
Adina R&D, Inc. 1984. A finite element program for auto- matic dynamic incremental nonlinear analysis. Adina R&D, Inc., Boston. Report AE 84-1.
American Society of Civil Engineers. 1978. An overview of the Alaska highway gas pipeline: the world's largest pro- ject. National Convention of the American Society of Civil Engineers, Pittsburgh, Penn.
Biot, M.A. 1937. Bending of an infinite beam on an elastic foundation. Transactions, ASCE Journal of Applied Mechanics, 59: Al-A7.
Bouwkamp, J.G., and Stephen, R.M. 1973. Large diameter pipes under combined loading. ASCE Transportation Engineering Journal, 99(TE3): 521-536.
Canadian Standards Association 1979. Steel Line Pipe. Canadian Standards Association, Rexdale, Ont. Report CANICSA-Z245.1.
Committee on Gas and Liquid Fuel Lifelines. 1984. Guide- lines for the seismic design of oil and gas pipeline systems. American Society of Civil Engineers, New York.
Dallimore, S.R., and Crawford, H. 1985. Experimental obser- vations of differential heaving and thaw settlement around
a chilled pipeline. In Pipelines and frost heave. Proceed-
ings of a Seminar held at Centre de gComorphologie, Caen,
France. Edited by S.R. Dallimore and P.J. Williams,
Carleton University, Ottawa. pp. 5-17.
Foriero, A., and Ladanyi, B. 1991. Generalized finite-element algorithm for laterally loaded piles in permafrost in com-
parison with measurements. Canadian Geotechnical
Journal, 28: 523-541.
Geotechnical Science Laboratories. 1986. Investigations of frost heave as a cause of pipeline deformation. Carleton University, Ottawa. Report IR-50.
Geotechnical Science Laboratories. 1988. The third freeze cycle of the Canada-France ground freezing experiment. Carleton University, Ottawa. Report IR-54.
Geotechnical Science Laboratories. 1989. Canada-France
pipeline - ground freezing experiment. Carleton Univer-
sity, Ottawa. Report IR-58.
Glen, J.W. 1955. The flow law of polycrystalline ice. Proceedings of the Royal Society of London, Series A,
228: 5 19-538.
Gresnigt, A.M. 1986. Plastic design of buried steel pipelines in settlement areas. Heron, 31(4): 1-113.
Hall, W.J., and Newmark, N.M. 1978. Seismic design criteria for pipelines and facilities. ASCE Journal of Technical Councils, 104(TC1): 91-107.
Hawkes, I., and Mellor, M. 1972. Deformation and fracture of ice under uniaxial stress. Journal of Glaciology, ll(61):
103-131.
Jacka, T.H., and Lile, R.C. 1984. Sample preparation tech- niques and compression apparatus for ice flow studies. Cold Regions Science and Technology, 8(3): 235-240. Kennedy, R.P., Chow, A.W., and Williamson, R.A. 1977.
Fault movement effects on buried pipelines. ASCE Transportation Engineering Journal, 103(TE5): 617-633. Kim, H.O., and Velasco, P. 1988. Review of pipe buckling
for arctic pipeline design. Proceedings, 7th International Conference on Offshore Mechanics and Arctic Engineering,
Houston, Tex. Edited by J.S. Chung. American Society of
Mechanical Engineers, New York. Vol. 5. pp. 307-315. Kyriakides, S., Yun, H.D., and Yew, C.H. 1983. Buckling of
buried pipelines due to large ground movements. In Earth-
quake behaviour and safety of oil and gas storage facilities,
buried pipelines and equipment. Edited by T. Ariman.
American Society of Mechanical Engineers, New York. Publication PVP 77. pp. 140-150.
Ladanyi, B. 1972. An engineering theory of creep of frozen soils. Canadian Geotechnical Journal, 9: 63-80.
Langner, C.G. 1984. Design of deepwater pipelines. Proceed- ings, TNO-IWECO 30th Symposium on Underwater Technology, The Hague, Netherlands.
McRoberts, E.C., Law, T.C., and Murray, T.K. 1978. Creep tests on undisturbed ice-rich silt. Proceedings, 3rd International Permafrost Conference, Edmonton, Alta., Vol. 1. pp. 539-545.
Michel, B. 1978. Ice mechanics. Les Presses de 1'UniversitC de Laval, QuCbec.
454 CAN. GEOTECH. J I. VOL. 30, 1993 Morgenstern, N.R., Roggensack, W.D., and Weaver, J.S.
1980. The behaviour of friction piles in ice and ice-rich soils. Canadian Geotechnical Journal, 17: 405-415.
Nixon, J.F. 1984. Laterally loaded piles in permafrost. Canadian Geotechnical Journal, 21: 431-438.
Nixon, J.F., Morgenstern, N.R., and Ressor, S.N. 1983. Frost heave - pipeline interaction using continuum mechanics.
Canadian Geotechnical Journal, 20: 25 1-261.
Nyman, K.J., and Lara, P.F. 1986. Structural monitoring helps assess deformations in arctic pipelines. Oil and Gas Journal, 81(11): 81-86.
Rajani, B. 1992. Deformation of pipelines embedded in frozen soil. Ph.D. thesis, University of Alberta, Edmonton. Rajani, B., and Morgenstern, N. 1992. Behaviour of a semi-
infinite beam in a creeping medium. Canadian Geo- technical Journal, 29: 779-788.
Sayles, F.H. 1973. Triaxial and creep tests on Ottawa sand. Proceedings, 2nd International Conference on Permafrost, Yakutsk, North American Contribution. pp. 384-391. Sayles, F.H. 1991. Stress-strain behaviour of frozen soil in
tension. Proceedings of Canada-France Seminar: Gas pipe- lines, oil pipelines, civil engineering in Arctic climates, Caen, France. Edited by P.J. Williams. pp. 61-72.
Sayles, F.H. and Haines, D. 1974. Creep of frozen silt and clay. U.S. Army Corps of Engineers, Cold Regions Research and Engineering Laboratory, Hanover, N.H. Technical Report 252.
Sego, D.C. 1980. Deformation of ice under low stresses. Ph.D. thesis, University of Alberta, Edmonton.
Sego, D.C., and Morgenstern, N. 1983. Deformation of ice under low stresses. Canadian Geotechnical Journal, 20: 587-602.
Sego, D.C., and Morgenstern, N. 1985. Punch indentation of polycrystalline ice. Canadian Geotechnical Journal, 22: 226-233.
Sego, D.C., Shultz, T., and Banasch, R. 1982. Strength and deformation behaviour of frozen saline sand. Proceedings, 3rd International Symposium on Ground Freezing, Cold Regions Research and Engineering Laboratory, Hanover, N.H. pp. 11-17.
Sherman, D.R. 1976. Tests of circular steel tubes in bending. ASCE Journal of the Structural Division, 102(STll): 2181-2195.
Sinha, N.K. 1989. Elasticity of natural types of polycrys- talline ice. Cold Regions Science and Technology, 17(2): 127-135.
Southwell, R.V. 1914. On the theory of elastic stability. Philosophical Transactions of the Royal Society of London, Series A, 213: 187-244.
Stephens, M.J., Kulak, G.L., and Montgomery, C.J. 1982. Local buckling of thin-walled tubular members. University of Alberta, Structural Engineering Report 103.
Tawfik, M.S. 1986. Analysis of pipelines under large soil deformations. Ph.D. thesis, Cornell University, Ithaca, N.Y. Vesic, A.S. 1961. Bending of beams resting on isotropic elastic
solid. ASCE Journal of the Engineering Mechanics Division, 87(EM2): 35-5 1.
Wilson, W.M., and Newmark, N.M. 1933. The strength of thin cylindrical shells as columns. University of Illinois, Experimental Station, Urbana. Bulletin 255.
Yudovich, A., and Morgan, D.R. 1989. Casing deformations in Ekofisk. Journal of Petroleum Technology, 41(7): 729-734.
Yun, H., and Kyriakides, S. 1990. On the beam and shell modes of buckling of buried pipelines. Soil Dynamics and Earthquake Engineering, 9(4): 179-193.
Zhu, Y., and Carbee, D.L. 1987. Tensile strength of frozen silt. U.S. Army Corps of Engineers, Cold Regions Research and Engineering Laboratory, Hanover, N.H. Report 87-15.
Nomenclature creep proportionality constant critical strain criterion constant pipeline diameter (= 2R) beam elastic modulus
steel strain hardening modulus soil elastic modulus
embedment depth
creep exponent i n Norton relation radius of model pipelines
pipeline wall thickness critical strain
axial strain rate proof strain rate
elastic proportionality strain limit soil weight density
steel Poisson's ratio soil Poisson's ratio
elastic proportionality stress limit steel yield stress
proof stress axial stress yield strain
net diametrical change ovality
8 radial, axial, and circumferential beam element
void ratio