HAL Id: hal-02458622
https://hal.archives-ouvertes.fr/hal-02458622
Submitted on 28 Jan 2020
HAL is a multi-disciplinary open access
archive for the deposit and dissemination of
sci-entific research documents, whether they are
pub-lished or not. The documents may come from
teaching and research institutions in France or
abroad, or from public or private research centers.
L’archive ouverte pluridisciplinaire HAL, est
destinée au dépôt et à la diffusion de documents
scientifiques de niveau recherche, publiés ou non,
émanant des établissements d’enseignement et de
recherche français ou étrangers, des laboratoires
publics ou privés.
Solidification sequence and four-phase eutectic in
AlSi6Cu4Fe2 alloy
Djar Oquab, Claudie Josse, Arnaud Proietti, Alessandro Pugliara, Jacques
Lacaze, Sonja Steinbach, Deni Ferdian, Bernard Viguier
To cite this version:
Djar Oquab, Claudie Josse, Arnaud Proietti, Alessandro Pugliara, Jacques Lacaze, et al.. Solidification
sequence and four-phase eutectic in AlSi6Cu4Fe2 alloy. Materials Characterization, Elsevier, 2019,
156, pp.109846. �10.1016/j.matchar.2019.109846�. �hal-02458622�
OATAO is an open access repository that collects the work of Toulouse
researchers and makes it freely available over the web where possible
Any correspondence concerning this service should be sent
to the repository administrator: [email protected]
This is an author’s version published in:
http://oatao.univ-toulouse.fr/25346
To cite this version:
Oquab, Djar
and Josse, Claudie and Proietti, Arnaud and Pugliara,
Alessandro
and Lacaze, Jacques
and Steinbach, Sonja and Ferdian,
Deni and Viguier, Bernard
Solidification sequence and four-phase
eutectic in AlSi6Cu4Fe2 alloy. (2019) Materials Characterization, 156.
109846. ISSN 1044-5803
Solidification sequence and four-phase eutectic in A1Si6Cu4Fe2 alloy
Djar Oquab
a, Claudie Josse
\
Arnaud Proietti
b, Alessandro Pugliara
a, Jacques Lacaze
a,
*
,
Sonja Steinbach
C,
Deni Ferdian
d, Bernard Viguier8
• ClRIMA T, Un1"'1'Slti de Toulouse, ENSIACET, BP 44362, 31030 Toulouse, Ceder 4, Pranœb CentTe de Mkrocoractérisatlon Raimond Casbling, Unlverslti de Tculcuse, UPS -CNRS -INPT-INSA, UMS 3623, 3 rue Caroline Atle, 31400 Toulouse, Franœ 'ln.stitutfllr MalitrlJJlphyslk im Wellraum Deutscms Zentrumfllr Luft- und Raunifohrt (DIJU, S1170 Koln, Gmnat!Y
d Dept. of Metallurgy and Materials �erlng, Univers/tas Indonesio, Kampus Baru U1 Depok, 16424, Indonesla
ARTICLE INFO ABSTRACT
Keywords: Four-phase eutectlc Regular eutectlc Rosette Alumlnium alloy
Differential thermal analyses of an A1Si6Cu4Fe2 alloy at various cooling rates from the liquid state were per formed which showed: i) possible discrepancies in the first solidification steps and; ii) solidification ending with multiple peaks at low cooling rate. Metallographic observation of the samples gave hint for understanding the discrepancies while the presence of rounded multi-phase pools -or s0<alled rosettes - entrapped within dendrite arms explained the multiple peaks because they solidified independently of each other.
The very fine eutectic microstructure in these rosettes was investigated by scanning electron microscopy which showed the precipitation of a four-phase eutectic. Focused ions beam milling was then used to investigate the topology of the distribution of the four phases. Electron backscattered diffraction analysis was carried out to investigate their local crystallographic orientations and transmission electron microscopy analysis was per formed to identify the very fine crystalline structures. This eutectic appears as one of the very few regular four phase eutectics reported in the literature.
1. Introduction
Al Cu Si alloys are the base of foundry alloys of interest because of being heat treatable and having good corrosion resistance. For die casting these alloys are however complemented with a low amount of iron to limit sticking of the melt to the die, and they contain also some manganese to avoid the formation of the most detrimental Fe bearing phases. As part of an extended study devoted to the effect of fluid flow on the microstructure and defect formation in Al alloys, synthetic A!Si6Cu4 alloys with 0.5, 1 and 2 added Fe Cali in wt%) were in vestigated (mode} for A 319 alloy family) [1).
According to literature [2 4), solidification of aluminium alloys in the Al Cu Si Fe system may involve precipitation of Al3Fe, A4Fe,
Al,Cu2Fe,
a
Al8Fe:iSi, � Al�e:iSi2, 8 Al� and Si in addition to thealuminium rich solid solution (Al). With the above contents in Cu, Si and Fe, the expected phases are in fact a, �. Al2Cu, Si and (Al). The aim
of this work was to investigate how the cooling rate could affect pre cipitation of the minor phases, and it was chosen to work with a high enough Fe content so that the alloy would be hyper eutectic. Differ ential thermal analyses (DTA) were performed which showed: i) in consistencies in the first thermal arrests on cooling from the liquid
• Corresponding author.
E-mail address: [email protected] (J. Lacaze).
state; and ü) solidification ending with multiple peaks at low cooling rates. These two features were more particularly studied by various microscopy techniques whose results are reported below.
2. Experimental details
The A!Si6Cu4Fe2 alloy was prepared from high purity materials provided by Hydro Aluminium Rolled Products GmbH, Bonn, Germany. The inductively coupled plasma optical emission spectrometry (ICP OES) has been used for the determination of the alloying constituents: 5.93 Si, 2.08 Fe and 3.98 Cu (wt0/4) and Jess than 50 ppm of any other elements.
Differential thermal analysis experiments were performed with a SETSYS 16/18 apparatus from SETARAM, with alumina crucibles and alumina powder as inert referenœ. Samples were cylinders 3.9mm in diameter and 5 mm in height. DT A records have been made upon cooling after melting at a rate of 10 •c;min up to a maximum tem perature of 650 •c or 700 •c. The choice of the upper temperature de pended on the subsequent cooling rate, being 650 •c when the cooling rate was lower than 3 •c;min and 700 •c when higher. Six cooling rates were considered: 0.2, 0.5, 1, 2, 3 and 5
•omm.
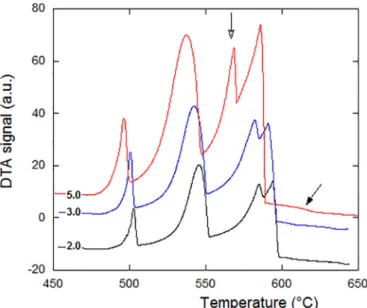
The records were1. Precipitation ofα Al8Fe2Si at 641.3 °C.
2. Appearance of (Al) at 608.6 °C in an eutectic reaction withα. 3. Appearance ofβ Al9Fe2Si2at 603.4 °C which replacesα.
4. Appearance of Si as a three phase (Al) Siβ eutectic at 559.6 °C.
5. Final four phase (Al) Siβ Al2Cu eutectic at 521.6 °C.
From the predicted amount of phases to precipitate at each of these reactions, the three main peaks are easily related to precipitation of (Al), Si and Al2Cu, i.e. reactions 2, 4 and 5 in the above listing, re
spectively. Furthermore, the intermediate peak should correspond to precipitation ofβ. Also, a careful observation ofFig. 1shows that the record at 5 °C/min presents a shallow thermal arrest at about 620 °C which could relate to primary precipitation ofα (solid arrow inFig. 1). Then, for this particular record, the intermediate peak could effectively be associated withβ precipitation. However, for the two other records, primary precipitation could not be evidenced leading to some un certainty on the nature of the intermediate peak.
Fig. 2a shows the whole DTA records at cooling rates of 0.2, 0.5 and 1 °C/min where the same three main peaks are observed. It is noticed again that no thermal arrest could be evidenced at temperature higher than that for the first main peak, i.e. above 600 °C. Also, the inter mediate peak does not appear similarly in these three curves. For 0.5 and 1.0 °C/min, there is one intermediate arrest similar to those in
Fig. 1, while at the lowest cooling rate two thermal arrests could be identified. Further understanding of the changes in the upper tem perature range of the records was gained by observing the micro structures, see later.
However, the most striking observation inFig. 2a is that the third main thermal arrest starting at about 510 °C is not simple and consists in successive and short peaks. In the zoom of the DTA traces inFig. 2b, it is seen that the very last arrests may appear at a temperature lower than 500 °C, i.e. more than 10 °C below the start of thefinal eutectic reaction, and more than 20 °C below the equilibrium four phase eu tectic temperature. Similar multi stage eutectic solidification had been observed previously at the end of solidification of Al Cu Mg Si alloys where they could be related to independent crystallization of isolated pockets of liquid [7]. Because of the significant undercooling at which
these pockets solidify, their microstructure was veryfine and suggested to call them “rosettes”. Similar features were observed during the present study as detailed below.
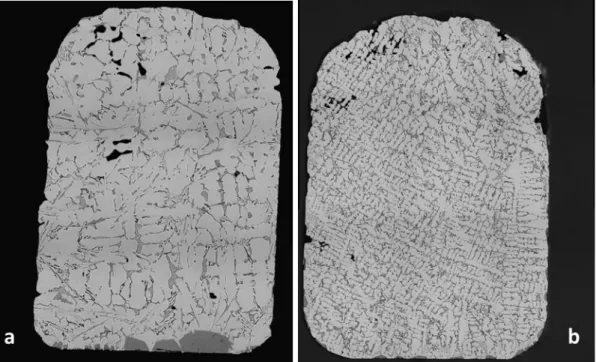
3.2. Light optical observation of the samples microstructure
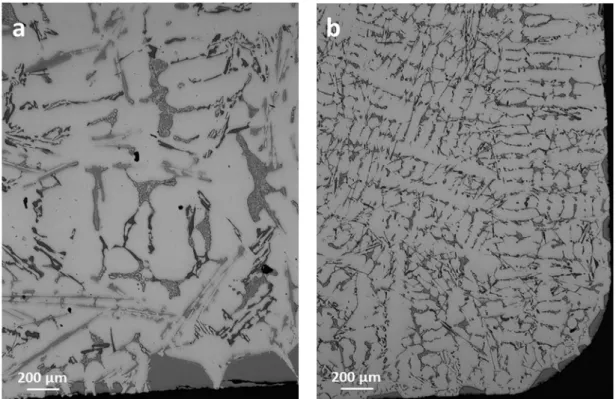
The diametrical vertical sections of the six samples were observed and those for 0.5 °C/min and 5 °C/min are presented inFig. 3. One clearly sees the dendritic structure of the (Al) phase that becomesfiner with increase in the cooling rate. Also, at the bottom of all six samples, a few large and blocky dark grey precipitates were observed which certainly precipitated before the development of the (Al) dendritic network, seeFig. 4for an enlarged view. With increasing cooling rate, these precipitates becomefiner and could be observed also along the vertical surface of the samples as illustrated with the micrograph in
Fig. 4b for the sample cooled at 5 °C/min.
EDS measurements on the large precipitates confirmed they consist ofα phase. Thus, the α phase was effectively the first phase to appear during cooling from the liquid, in contact with the crucible and either only at the bottom of the samples at low cooling rate or also along the vertical surface at higher cooling rate. As the amount of theα phase to precipitate is low, this arrest was clearly detected only at 5 °C/min. Further, the growth of the precipitates depleted progressively the melt in iron and it may well be that the liquid was not homogeneous when the network of (Al) dendrites formed. This may have led to changes in the conditions forβ nucleation explaining the discrepancies between the records, and in particular that the thermal arrest associated to this phase appeared at significantly lower temperature for the cooling rate of 0.2 °C/min than for the other cooling rates.
Finally,Fig. 5illustrates the various minor phases that could be observed in the interdendritic areas of the bulk of all samples.β pre cipitates appear as thin light grey platelets which are most often asso ciated with Si plates with dark grey contrast. Al2Cu appears as very Fig. 1. DTA records upon cooling at 2, 3 and 5 °C/min as indicated on the
curves.
uncorrected in any ways and particularly not for cooling rate effect. Calibration of the DTA cell at very low scanning rate indicated a maximum possible shift of 2 °C of the recorded temperatures.
After standard metallographic preparation, the samples were ob served by light optical microscopy (LOM) and scanning electron mi croscopy (SEM). A rosette was then selected that was submitted to se quential thinning with a focused ion beam (FIB, ThermoFischer Helios 600i) for 3D characterization using both SEM images and elements mapping by X ray energy dispersive spectrometry (EDS). Two other foils were prepared by FIB milling, one thin foil for characterizing the crystallography of the phases by transmission electron microscopy (TEM, JEOL JEM 2100F) and by scanning transmission electron mi croscopy (STEM), and another one to determine phases and grains or ientation distribution by electron backscattered diffraction (EBSD) analysis. EBSD was performed with a JEOL JSM 7100F with a working distance of 15 mm, an accelerating voltage of 20 kV. EBSD was coupled with EDS to avoid confusion between Si precipitates and (Al). The pole figures presented in the Results section are oriented the same way as the corresponding images (X and Y being respectively the horizontal and vertical directions in the plane of the image, and Z the normal to this plane).
3. Results 3.1. DTA results
In Fig. 1 are plotted the DTA records upon cooling at 2, 3 and 5 °C/ min, which have been offset along the Y axis for clarity. They all show similar features characterized by three main peaks starting respectively at about 600 °C, 550 °C and 500 °C on the record at 2 °C/min. Note that the slope at the beginning of each of these three main peaks is such that it is ensured the corresponding reactions proceeded with some under cooling. In between the two first main peaks at higher temperatures, it is seen that one additional arrest shows up which is indicated with an open arrow. This sequence of thermal arrests may be compared to the solidification sequence predicted with the Scheil module of the Ther mocalc software [5] and using the TCAL2 database [6]:
light grey irregular and rounded precipitates while (Al) constitutes the background and has the brightest contrast. Note that the spatial and size distributions of the phases are inhomogeneous and irregular in these interdendritic areas.
In all samples, rounded areas with a veryfine microstructure could be observed as illustrated inFig. 6. In fact, contrary to previous report on a ternary Al Fe Si alloy [8], the number of these so called rosettes was increasing as the cooling rate was decreased. Owing to thefineness of their microstructure, they were expected to have solidified with significant undercooling and, being isolated from each other, this must have happened independently and could well explain the sequence of small peaks at lowest temperatures inFig. 2b. If this is the case, the microstructure of these rosettes should consist in a four phase eutectic and this was looked for by electron microscopy.
3.3. Electron microscopy observation of the rosettes
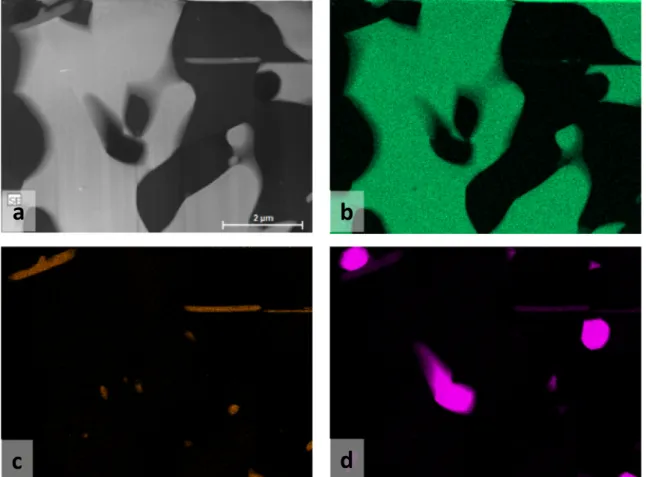
Fig. 7shows a SEM micrograph of another rosette in the sample cooled at 0.2 °C/min together with the corresponding EDS maps of Si, Cu and Fe. The various FIB sections prepared for the present work are located on the SEM image (Fig. 7a). The microstructure of the rosette appears as afine intermix of (Al) in dark grey contrast and Al2Cu in
bright contrast as also evidenced with the Cu map inFig. 7c. The si licon map inFig. 7b shows clear Si precipitates which are nearly evenly distributed in the rosette, with only a slightly higher amount at the periphery. From the iron map inFig. 7d, one could imagine there are also Fe bearing precipitates but this should be ascertained by closer investigation.
TEM and EBSD analyses as well as a 3D reconstruction have been carried out on the areas indicated inFig. 7a.Fig. 8presents images of the 3D reconstruction as obtained by stacking EDS maps recorded
Fig. 2. DTA records upon cooling at 0.2, 0.5 and 1 °C/min as indicated on the respective curves: a) whole solidification range; b) enlargement on the final thermal arrest.
during FIB milling. Here are presented 3D maps of the areas rich in silicon (a) and in iron (b). It is noteworthy that the silicon particles seem disconnected while both (Al) and Al2Cu were found to be each
interconnected, as well as being entangled. In a previous study on three phase rosettes in an Al Fe Si alloy, both (Al) and Si were connected and entangled while short β plates were unevenly distributed and dis connected from each other [9]. It is quite interesting to notice that the predicted fraction of Si is nearly the same, about 10%, in the three phase eutectic of the ternary Al Fe Si system and in the four phase eutectic of the Al Cu Fe Si system.
FromFig. 8b, it may be guessed that the Fe rich phase appears also as plates in the rosette of the quaternary alloy, though shorter than in interdendritic areas (Fig. 5). To verify which phase it consists of, a thin foil was ion milled out from the same rosette and thin plates were ef fectively observed and characterized by TEM as illustrated withFig. 9a and b. This phase was analysed by EDS and by selected area electron diffraction (SAED) on the area defined with a circle inFig. 9b. The EDS analysis confirmed that it is rich in iron and, as expected, the experi mental SAED (Fig. 9c) could be indexed asβ phase with an error less than 10%. This indexation (Fig. 9d) was carried out comparing the
Fig. 4. LOM micrographs of the samples cooled at 0.5 °C/min (a) and 5 °C/min (b).
Fig. 5. LOM micrographs of the samples cooled at 0.5 °C/min (a) and 5 °C/min (b).
Fig. 7. Backscattered electron (BSE) image (a) of a rosette in the sample cooled at 0.2 °C/min and EDS maps of Si, Cu and Fe (respectively b, c and d images). The localization of the different zones for TEM analysis, EBSD analysis and 3D reconstruction are shown in the BSE image.
Fig. 8. 3D reconstruction of the silicon rich (a) and iron rich (b) areas in the rosette. The nominal size of the reconstruction box was 5x10x38μm3with slices 50 nm thick. The actual thickness of the slices was 63 nm.
experimental plane distances and angles related to the diffracted spots of the diffraction pattern with literature values [10].
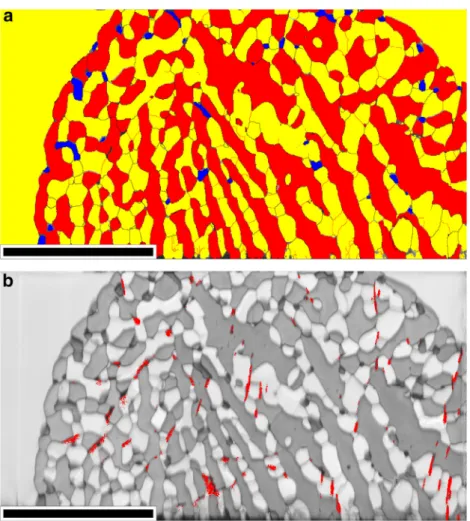
A foil labelled“EBSD” inFig. 7a was extracted using FIB for further analysis of phases and their orientation by EBSD. The phase mapping is seen inFig. 10a, with (Al) in yellow, Al2Cu in red and silicon in blue.
Crystallographic data used for phase identification are: i) (Al), space group Fm3¯m with a = 4.050 Å; ii) Al2Cu, space group I4/mcm with
a = 6.067 Å, c = 4.877 Å; and ii) Si, space group Fd3¯m with a = 5.43 Å. As a matter of fact, the beta phase was not indexed which may be due to the small size of the precipitates as seen inFig. 9. Instead, a network of thin dark lines is observed to divide the (Al) phase in blocks. A few of these dark lines are also present in the Al2Cu phase. It is noteworthy
that the partitioning of the (Al) phase by the network of dark lines appears quite regular.
This network can be partly revealed by superimposing iron Kα map and band contrast image (Fig. 10b). It is thus seen that the beta plates correspond to many of the thin elongated areas that could not be in dexed (Fig. 10a), though some dark lines or areas remain which are probably sub grain boundaries. The map inFig. 10b is consistent with TEM observation where β phase was found in (Al) matrix or at boundary between (Al) and Al2Cu. This observation is illustrated in the
STEM high angle annular darkfield (HAADF) micrograph inFig. 11a where the Al2Cu phase appears light grey (see the EDS map of Cu in Fig. 11b) and theβ phase dark grey (see the EDS map of Fe inFig. 11
c). (Al) and Si precipitates appear both in dark contrast but the last ones can be distinguished with the silicon EDS map (Fig. 11d).
The orientation variations of the different phases have been
examined in order to give some insight on the solidification mechanism. The (Al) phase isfirst examined inFig. 12, which represents a mapping of the misorientation with respect to the matrix grain (deep blue) where a reference point was selected (red disc at the top left of the map). This mapping reveals a progressive increase of the misorientation from the periphery toward the centre of the rosette. This suggests solidification of (Al) started from the surrounding matrix followed by quite a con tinuous change in orientation of the (Al) grain though some highly misoriented areas (in orange) are also seen from place to place. As clearly evidenced by the pole figures, the increasing misorientation corresponds to a continuous rotation around one single [100] direction which is stressed with the light grey regions superimposed to the pole figures. This rotation axis is identified with a dashed circle in the {100} figure. What can also be seen in comparingFigs. 10 and 12is that the local changes in orientation of the (Al) phase are closely related to the presence ofβ plates and possibly of Si precipitates as well. In other words, the blocks defined in the (Al) phase by the network of thin dark lines seen in Fig. 10a all show little internal misorientation while neighbouring blocks are slightly misoriented between each other.
The polefigures and angular deviation from a defined orientation for the Si precipitates are shown inFig. 13. Silicon precipitates appear much as randomly oriented. This implies they are not interconnected as was suggested by the 3D reconstruction inFig. 8a. A few of the Si precipitates appear with two crystallographic orientations (different colours corresponding to twinning).
A similar analysis of crystal orientation has been conducted on the
Fig. 9. TEM brightfield image of the whole foil (a) and zoom on one plate which was found rich in iron (b) (dashed square in a). Related experimental (c) and calculated (d) SAED pattern of theβ phase along the [1,0,0] zone axis (solid disc in b). Crystallographic data used for calculation are from Hansen et al. [10] and the reconstruction was performed with CaRIne software [11].
Fig. 10. Map of the phases that could be indexed with EBSD-EDS analysis: (Al) in yellow, Al2Cu in red and silicon in blue (a). Phase and grain boundaries (misorientation higher than 10°) are indicated by dark lines and sub-grain boundaries (misorientation between 2 and 10°) for (Al) by yellow lines. (b): Image obtained by superimposition of band contrast and iron Kα (in red) maps. Band contrast (from black to white) corresponds to the quality of the diffraction pattern. The scale bar represents 20μm. (For interpretation of the references to colour in thisfigure legend, the reader is referred to the web version of this article.)
a
b
c
d
Fig. 11. STEM– HAADF micrograph (a), and STEM – EDS maps of copper (b), iron (c) and silicon (d) showing the positioning of β and silicon precipitates with respect to the majority phases Al2Cu and (Al).
Fig. 12. Map of angular deviation (0°-60°) from a defined orientation for the (Al) phase in the rosette. The reference location is located in the outer (Al) matrix and marked with a red disc at the top left of the map. The corresponding pole figures of (Al) phase are shown in the lower row and indicate a rotation of the grains around a 100 pole as indicated by grey shading. The scale bar represents 20μm. (For interpretation of the references to colour in this figure legend, the reader is referred to the web ver-sion of this article.)
Al2Cu phase which is presented inFig. 14. Two grains could be iden
tified which correspond to well separated orientations on the pole fig ures and also to well defined regions on the image. The regions have been separated with an interrupted curve inFig. 14. For each grain a continuous misorientation is observed which spreads over as much as 60°. It appeared convenient to define two reference points, one for each grain, which are shown as red discs on the bottom right of the map.
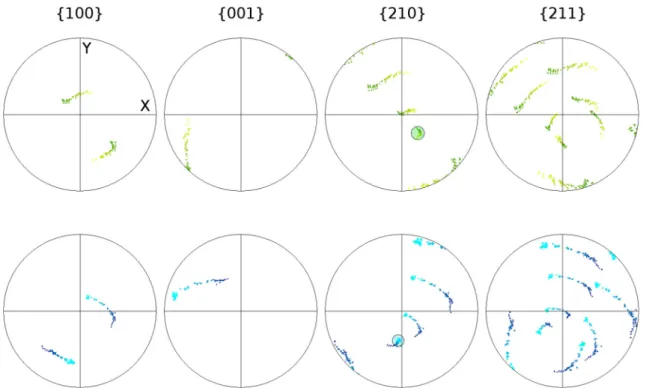
The stereographic projections for different poles are shown in
Fig. 15independently for both grains. It appears that the misorientation in each grain corresponds to a continuous rotation around afixed [210] direction. This rotation axis is well distinct for each grain and is shown with a circle in each of the {210} projections. Concerning the or ientation relationship between the two grains it is not clear if it consists in a rotation (circa 90° around the image normal) or if it is a twin re lation.
Further, the orientation relation between Al2Cu and (Al) phases is
quite difficult to establish since these crystals continuously rotate across the rosette. In the literature and for a AleCu alloy rosette, Kim and Cantor [12] have noticed a superposition of [001]Aland [113]Al2Cu. For
a slowly grown (Al)/Al2Cu eutectic, Kraft [13] proposed the following
phase juxtaposition which was later accepted by other authors [14]: Interface//{111}(Al)//{211}Al2Cuwith〈101〉(Al)//〈120〉Al2Cu.
This was confirmed by Davies and Hellawell [15] who wrote them as:
〈 〉
Interface//{111}(Al)//(211)Al2Cuwith 110(Al)//[210]Al2Cu
The latter authors however observed orientations differing from those reported by Kraft in that the {201}(Al) was almost parallel to
(110)Al2Cu and {111}(Al) parallel to (012)Al2Cu. Also, they could de
monstrate that axes and directions of rotation change progressively with the phase appearing to follow one another. Lawson et al. [16]
observed the following orientations: Growth direction//[100]Al2Cu//〈310〉(Al)
Interface//(001)Al2Cu//{113}(Al)
These authors noticed an approximate coincidence of (211)Al2Cuand
(111)(Al)on the stereograms but stressed that the above planes are far
from those reported by Kraft. To sum up, it appears that any of the orientation relationships observed in the literature could be evidenced from the information inFigs. 12 and 14. Further, since the rotations of the (Al) and Al2Cu phases do not seem to be correlated, it may be ar
gued that (Al) and Al2Cu could grow side by side during solidification of
the rosette without consideration to their respective crystallographic orientation.
4. Discussion
Rosettes have been already reported in a number of works, e.g. in partly remelted melt spun AleCu ribbons [12] and in direct chill (DC) casting of Al Fe Si [17] and Al Fe Mn Si [18] alloys. Rosettes have also been observed in materials reheated for solution treatment [19]. The very fine multiphase structure was related to solidification under cooling of isolated liquid droplets by Kim and Cantor [12], and this has been confirmed by DTA on an Al Cu Mg Si alloy [7]. In this latter alloy as well as in Al Fe Si alloys [8,9], it was noticed that the number of rosettes increased with cooling rate. That the present results show an opposite trend is guessed to be due to the very large amount of eutectic in the present alloy which leads to isolation of liquid pools only when the structure has enough time for coarsening during solidification.
A particular feature of rosettes is that estimates of their composition have shown they are enriched in solutes with respect to the stable
Fig. 13. Polefigures and angular deviation from a defined orientation for the Si pre-cipitates. The colour from blue to red shows the change in orientation (between 0 and 60°) of the Si precipitates with respect to the orientation of the (Al) matrix out of the rosette (the reference point is the blue circle at the top left of the image). The scale bar represents 20μm. (For interpretation of the references to colour in thisfigure le-gend, the reader is referred to the web version of this article.)
eutectic composition [7,18]. This off equilibrium enrichment could
possibly explain the observation that melting occurred at temperature lower than the stable eutectic during heat treatment [20,21].
In the interdendritic areas (seeFig. 5), the eutectic is irregular in the same way as the four phase Al/Cu/Ag/Mg eutectic studied by direc tional solidification by Bin Zhou and Froyen [22]. By contrast, in the rosettes, the distribution of the four phases appears quite regular as was the case for the directionally solidified Pb/Sn/Cd/Zn four phase eu tectic investigated by Fisher and Kurz [23]. It is of further interest to note that theβ phase is here perpendicular to the main direction of the (Al) and Al2Cu phases, acting in disrupting their growth. Such a feature
was also characteristic of one of the minor phases in the four phase eutectic studied by Fisher and Kurz. This distinct “lattice work” ap pearance was assumed to allow minimizing interfacial area together with avoiding interferences in the diffusion fields [23].
5. Conclusions
DTA analysis of a Al Cu Fe Si alloy revealed a multiple peak at the end of solidification that could be associated with independent solidi fication of areas isolated from the interdendritic zones because of coalescence of the (Al) dendrites. Within these areas, a veryfine four phase eutectic with a so called rosette like appearance was observed. Contrary to the four phase eutectic in the interdendritic zones, the eutectic in the rosettes shows a quite regular space distribution of the four phases, i.e. this is one of the very few regular four phase eutectics reported in the literature.
Contributions
D. Oquab and C. Josse performed the FIB milling and 3D re construction, A. Pugliara has carried out TEM investigation, A. Proietti and B. Viguier analysed the grain and phase orientations, J. Lacaze, S. Steinbach and D. Ferdian carried out DTA and optical microscopy
Fig. 14. Map of angular deviation from a defined orientation of the two separate regions (A and B) of Al2Cu phase. A reference point for each region is indicated as a red disc on the bottom right side. The colour code is identical for the map and for polefigures, yellow to green for region A and light to dark blue for region B. The scale bar represents 20μm. (For interpretation of the references to colour in this figure legend, the reader is referred to the web version of this article.)
analyses as well as the literature review. All co authors contributed to writing of the paper and have approved the present submission. Data availability
The raw data are available upon request to the corresponding au thor.
Declaration of competing interest None.
Acknowledgments
Part of this work was conducted within the ESA MAP programme MICAST, contract 14347/01/NL/SH. The sample material was kindly provided by Hydro Aluminium Deutschland GmbH, Bonn, Germany. Thanks are due to A. Lejri for the nice metallographic work he per formed during his 4 week licence internship at the CIRIMAT laboratory. References
[1] S. Steinbach, et al., Investigation of the effect of fluid flow on microstructure evo-lution in Al-Si-Fe alloys: The MICAST project, Proceedings of the 5th Decennial International Conference on Solidification Processing, Old Windsor, July 2017, pp. 267–271.
[2] L.F. Mondolfo, Aluminium Alloys, Structure and Properties, Butterworths, London, 1976.
[3] L. Backerud, G. Chai, J. Tamminen, Solidification Characteristics of Aluminum Alloys, vol. 2, AFS/Skanaluminium, Des Plaines, Illinois, 1990.
[4] N.A. Belov, D.G. Eskin, A.A. Aksenov, Multicomponent Phase Diagrams: Applications for Commercial Aluminum Alloys, Elsevier, Oxford, 2005. [5] J.O. Andersson, T. Helander, L. Höglund, P.F. Shi, B. Sundman, Thermo-Calc and
DICTRA, computational tools for materials science, Calphad 26 (2002) 273–312.
[6] Thermo-Calc Software TCAL aluminum-alloys database version 2
[7] J. Lacaze, G. Lesoult, I. Ansara, Rosettes in Al-Cu-Mg-Si aluminium alloys, Proc. ICAA-5, Mater. Sci. Forum 217-222 (1996) 171–176.
[8] D. Ferdian, Y. Thebault, A. Freulon, J. Lacaze, Characterization of rosettes forma-tion in an Aluminum– Silicon alloy, Int. J. Cast Met. Res. 28 (2015) 290–294. [9] D. Ferdian, D. Oquab, J. Lacaze, 3D characterisation of a rosette in an
aluminum-silicon alloys, Proceedings of the 5th Decennial International Conference on Solidification Processing, Old Windsor, July 2017, pp. 410–413.
[10] V. Hansen, B. Hauback, M. Sundberg, C. Rømming, J. Gjønnesa,β-Al4.5FeSi: a combined synchrotron powder diffraction, electron diffraction, high-resolution electron microscopy and single-crystal X-ray diffraction study of a faulted structure, Acta Crystallogr. B B54 (1998) 351–357.
[11] C. Boudias, D. Monceau, CaRIne crystallography 3.1 (c) 1989-2019,http://carine. crystallography.pagesperso-orange.fr.
[12] W.T. Kim, B. Cantor, Heterogeneous nucleation of Al2Cu in Al-Cu eutectic liquid droplets embedded in an Al matrix, Acta Metall. Mater. 42 (1994) 3045–3053. [13] R.W. Kraft, Crystallography of equilibrium phase interfaces in Al-CuAl2eutectic
alloys, Trans. Metall. Soc. AIME 224 (1962) 65–75.
[14] G. Garmong, C.G. Rhodes, Interfacial structure of Al-Al2Cu eutectic composites, Acta Metall. 22 (1974) 1373–1382.
[15] I.G. Davies, A. Hellawell, The structure of directionally frozen Al-CuAl2eutectic alloy, Philos. Mag. 19 (1969) 1285–1297.
[16] W.H.S. Lawson, H.W. Kerr, M.H. Lewis, Cellular morphologies in rapidly solidified Al-Al2Cu and Al-Al3Ni eutectic alloys, J. Cryst. Growth 12 (1972) 209–216. [17] P. Liu, T. Thorvaldsson, G. Dunlop, Formation of intermetallic compounds during
solidification of dilute Al–Fe–Si alloys, Mater. Sci. Technol. 2 (1986) 1009–1018. [18] D.T.L. Alexander, A.L. Greer, Formation of eutectic intermetallic rosettes by
en-trapment of liquid droplets during cellular columnar growth, Acta Mater. 52 (2004) 5853–5861.
[19] P.N. Anyalebechi, J. Hogarth, Effect of supereutectic homogenization on incidence of porosity in aluminum alloy 2014 ingot, Metall. Mater. Trans. B Process Metall. Mater. Process. Sci. 25 (1994) 111–122.
[20] J.E. Hatch, Aluminum Properties and Physical Metallurgy, ASM International, 1984.
[21] J.R. Davis, Aluminum and Aluminum Alloys, ASM International, 1993. [22] L. Bin Zhou, Froyen, Microstructure development in Al-Cu-Ag-Mg alloy, IOP Conf.
Series: Mater. Sci. Eng. 27 (2012) (012031).
[23] D.J. Fisher, W. Kurz, Novel morphology of Pb/Sn/Cd/Zn quaternary eutectic, Metall. Trans. 5 (1974) 1508–1510.
Fig. 15. Stereographic projections for various poles, as indicated, for the two regions labelled A (upper row) and B (lower row) inFig. 14. The colour code is the same as inFig. 14. (For interpretation of the references to color in thisfigure legend, the reader is referred to the web version of this article.)