HAL Id: tel-02304705
https://tel.archives-ouvertes.fr/tel-02304705
Submitted on 3 Oct 2019HAL is a multi-disciplinary open access archive for the deposit and dissemination of sci-entific research documents, whether they are pub-lished or not. The documents may come from teaching and research institutions in France or abroad, or from public or private research centers.
L’archive ouverte pluridisciplinaire HAL, est destinée au dépôt et à la diffusion de documents scientifiques de niveau recherche, publiés ou non, émanant des établissements d’enseignement et de recherche français ou étrangers, des laboratoires publics ou privés.
Experimental and numerical investigation of the
progressive collapse resistance of reinforced concrete
beam-column sub-assemblages
Guoqiang Zhao
To cite this version:
Guoqiang Zhao. Experimental and numerical investigation of the progressive collapse resistance of re-inforced concrete beam-column sub-assemblages. Other [cond-mat.other]. Université Grenoble Alpes, 2019. English. �NNT : 2019GREAI043�. �tel-02304705�
THÈSE
Pour obtenir le grade de
DOCTEUR DE LA COMMUNAUTE UNIVERSITE
GRENOBLE ALPES
Spécialité : 2MGE : Matériaux, Mécanique, Genie civil
Arrêté ministériel : 25 mai 2016
Présentée par
Guoqiang ZHAO
Thèse dirigée par Pascal FORQUINet co-dirigée par Yann MALECOT
préparée au sein du Laboratoire Sols, Solides, Structures et Risques
dans l'École Doctorale I-MEP2- Ingénierie - Matériaux, Mécanique, Environnement, Energétique, Procédés, Production
Etude expérimentale et numérique
de la résistance à l'effondrement
progressif de sous-assemblages
poteaux-poutres en béton armé
Thèse soutenue publiquement le 3 juillet 2019, devant le jury composé de :
Monsieur Emmanuel FERRIER
Professeur, Université Claude Bernard - Lyon 1, Président
Madame Evelyne TOUSSAINT
Professeur, Université Clermont Auvergne, Rapporteur
Monsieur Stéphane GRANGE
Professeur, INSA de Lyon, Rapporteur
Madame Wen CHEN
Maître de Conférences, Université de Lorraine, Examinateur
Monsieur Pascal FORQUIN
Professeur, Université Grenoble Alpes, Directeur de thèse
Monsieur Yann MALECOT
THESIS
To obtain the grade of
DOCTOR OF THE COMMUNAUTE UNIVERSITE
GRENOBLE ALPES
Specialty: 2MGE: Matériaux, Mécanique, Genie civil
Ministerial decree: 25 mai 2016
Presented by
Guoqiang ZHAO
Thesis directed by Pascal FORQUINand co-directed by Yann MALECOT
Prepared in the Laboratory Sols, Solides, Structures et Risques
in the École Doctorale I-MEP2- Ingénierie - Matériaux, Mécanique, Environnement, Energétique, Procédés, Production
Experimental and numerical
investigation of the progressive
collapse resistance of reinforced
concrete beam-column
sub-assemblages
Thesis publicly defended on July 3, 2019 In front of the defense jury composed of:
Mr. Emmanuel FERRIER
Professor, Université Claude Bernard - Lyon 1, President
Mrs. Evelyne TOUSSAINT
Professor, Université Clermont Auvergne, Reviewer
Mr. Stéphane GRANGE
Professor, INSA de Lyon, Reviewer
Mrs. Wen CHEN
Associate professor, Université de Lorraine, Examiner
Mr. Pascal FORQUIN
Professor, Université Grenoble Alpes, Thesis director
Acknowledgements
This Ph.D. dissertation has been one of the most significant challenges that I have faced in my study. Last year, my family and I went through a hard time. Due to family affairs, progress was barely made in my work during a long time. Under pressure, the study was too stressful to be continued and I would like even to give it up. However, my professors gave me invaluable advices and supports in my study. Their diligence, motivation and rigorous attitudes in research make me understand that I should accomplish my dissertation. As an old Chinese saying, “start well an end well”, so that I conquered the difficulties and completed the dissertation. Thus, I would like to express my gratitude to all people who gave me help and support during my Ph.D. study in 3SR laboratory.
First and foremost I would like to acknowledge my advisors, Professor Pascal Forquin and Professor Yann Malecot, for their patience, guidance and encouragement during my study and experiment design. They introduced me into the field of “dynamic experiment” and taught me how to be a good researcher. Without their support and guidance, this dissertation would have been impossible to complete. I will always be grateful for this and thank you for everything you have done for me.
Next, I want to give my sincere gratitude to all the members of the jury. Thank you for taking time out of your busy schedule to attend my defense. Special thanks go to Mrs. Toussaint and Mr. Grange for their invaluable feedback and constructive criticisms in their reports. Thanks is also due to Mrs. Chen for her intelligent questions and detailed comments. Finally, I am also thankful to Mr. Emmanuel for accepting to be the president of the jury and for his insightful suggestions. A fruitful scientific discussion on the day of the defense helped me understand my research area better.
I would like to sincerely thank to Dr. Briffaut Matthieu for helping in software and hardware. I also appreciate the help provided by Dr. Lukic Bratislav, Dr. Chao Yuan, Dr. Zhao Hua Li and all the colleagues in our team. We often discussed problems respecting numerical simulation
and it was unforgettable experience of cooperation.
Further appreciation extends to the master students Luis Calos Arevalo, Dmitriy Baturkin and Hui Hu who helped to make specimens of the test. Besides, I would like to thank the technicians of the 3SR laboratory, Mehideb Karim, Toni Jean-benot, and Decosne Jean-luc for their support in the experiment.
This work was supported by Country China Scholarship Council (CSC) . Thanks to CSC for offering me an opportunity of study in France.
Finally, I would like to thank my parents, my wife, my son and my daughter for their uncompromising support. Their smile makes me feel warm and give me the impetus to move forward. I appreciate them very much. I love you.
Abstract
Important buildings may be subjected to accidental loads, such as explosions or impacts, during their service life. It is, therefore, necessary not only to evaluate their safety under traditional loads and seismic action. The structural performances related to progressive collapse scenarios need to be investigated.
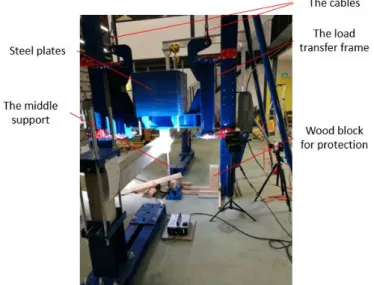
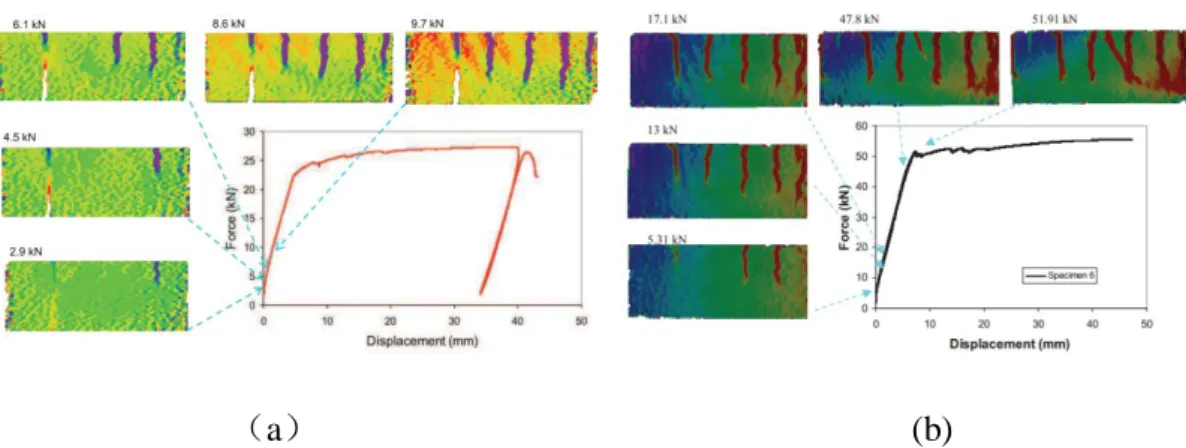
The study of progressive collapse involves a dynamic problem, but unfortunately dynamic experiments on the behavior of the civil engineering structures under dynamic conditions are rare. In this research, beam-column sub-assemblage specimens were tested under dynamic load. The loading program consists in placing a large mass, as a dead load, on the top of the middle column of a beam-column sub-assemblage. The support under the middle column is suddenly removed for simulating the sudden loss of a column and the damage that will result in the structure. The loading system and supporting devices were specially designed for this test. The upper dead load can be changed by increasing or decreasing the applied mass to different specimens. The supports for the side column have a controlled rigidity in the horizontal direction and are designed to restrain rotation of the side-column. Thus, the boundary conditions are supposed to be similar to real situations. During the test, a laser was installed under the middle pillar to collect the falling velocity and a high-speed camera was used to visualize the whole process of failure. The images obtained from the camera were processed by Digital Image Correlation (DIC) technology to get the corresponding displacements and strain fields. By these means, all the information of the structure under dynamic loading was captured and recorded, such as the period of vibration, frequency, velocity and displacement. Based on these experimental data, the effect of section and span of the specimen on dynamic response was discussed and the damage of the specimens under different loads was analyzed by the damage factor. Time history of resistance force curves and resistance force versus vertical displacement curves were produced. The performance of the beam-column assemblages under dynamic loads is different from the previous published quasi-static experiments in terms of structural mechanisms, crack patterns, damage mode. And it demonstrate that the beam-column
of the local structure.
In addition, numerical simulations were developed for simulating the failing process of the structure. A technique named “connector” was proposed into beam-column finite element model by adding a series of springs to investigate the interaction between steel rebars and concrete. A concrete damage model, named DFH-KST model, was used to characterize the development of concrete crack and damage. The versatility of the adopted methodology allows assessing the influence of the material nonlinear behavior and the geometry of the tested structure. Calibration and validation studies show that the proposed model can successfully represent the resistance of structure and behavior.
Résumé
Au cours de leur durée de vie, les bâtiments importants sont susceptibles d’être soumis à des charges accidentelles, telles que des explosions ou des impacts. Evaluer leur stabilité vis-à-vis de charges traditionnelles statiques et sismiques ne suffit pas. Leurs performances structurelles liées à des scénarios d’effondrement progressif doivent également être examinées.
L’étude de l’effondrement progressif est un problème dynamique. Malheureusement, les expériences sur le comportement des structures de génie civil dans des conditions dynamiques sont rares car difficiles à réaliser. Dans cette étude, des sous-assemblages poteaux-poutres en béton armé ont été testés sous chargement dynamique. Le chargement a consisté à placer une masse importante jouant le rôle de « charge morte » sur la colonne centrale d’un sous-assemblage simulant la liaison de 3 poteaux avec 2 poutres. Une pièce fusible jouant le rôle de support sous la colonne centrale est brutalement déverrouillée pour simuler la perte de portance soudaine de cette colonne. Le comportement dynamique et les dommages locaux causés à la structure ont été mesurés et étudiés. Le bâti de chargement et les dispositifs de support ont été conçus spécialement pour cet essai. La charge morte supérieure peut être modifiée et appliquées à différents spécimens. Les supports des colonnes latérales ont une rigidité horizontale contrôlée et sont conçus pour limiter la rotation de ces mêmes colonnes. Ainsi, les conditions aux limites des essais réalisés sont supposées être représentatives de situations réalistes. Au cours des essais, un laser a été installé sous la colonne centrale pour mesurer la vitesse de chute. Une caméra numérique rapide a été utilisée pour visualiser l'ensemble du processus de ruine du sous-assemblage. Les images obtenues de la caméra ont été traitées par une technique de DIC (Digital Image Correlation) afin d’obtenir le champs de déplacement et les déformations correspondantes. Grâce à ces mesures dynamiques, des données importantes ont été produites et enregistrées, notamment la période de vibration, la fréquence, la vitesse et le déplacement des différents échantillons testés. Sur la base de ces données expérimentales, l’effet de la section et de la portée des poutres sur la réponse dynamique et sur le mode d’endommagement des sous-assemblages a été discuté. Cette étude montre que les résultats expérimentaux obtenus, en
peuvent être utilisés pour analyser le comportement de sous-assemblages de structures réelles.
De plus, une modélisation numérique des essais a été réalisée pour simuler le processus de ruine de la structure. Une technique appelée «connecteur» a été proposée dans le modèle aux éléments finis du sous-assemblage poteaux-poutres. Cette technique consiste à ajouter une série de ressorts pour étudier le rôle de l’interaction entre les armatures en acier et le béton. Un modèle d'endommagement anisotrope, appelé modèle DFH-KST, a été utilisé pour caractériser l'évolution de la fissuration et l’endommagement du béton.
La polyvalence de la méthodologie adoptée permet d’évaluer l’influence du comportement non-linéaire du matériau et celle de la géométrie de la structure testée. Les études numériques de calibration et de validation montrent que le modèle proposé peut reproduire le comportement et la résistance de la structure avec succès.
Table of contents
CHAPTER 1 INTRODUCTION ...1
1.1 BACKGROUND ...1
1.2 SCOPE AND OBJECTIVES ...4
1.3ORGANIZATION THE DISSERTATION ...6
CHAPTER 2 LITERATURE REVIEW ...8
2.1REGULATIONS AND PROVISIONS FOR RESISTANCE PROGRESSIVE COLLAPSE IN CODES AND STANDARDS ...8
2.1.1 European standard ...8
2.1.2 American standards and guidelines ...9
2.2EXPERIMENTAL RESEARCH PROGRESS ... 18
2.2.1 Experiment study performed with RC frames ... 18
2.2.2 Beam-column sub-assemblages experiment ... 21
2.3NUMERICAL SIMULATION ANALYSIS ... 33
2.4STUDY OF INTERACTION PROPERTIES BETWEEN REBARS AND CONCRETE ... 39
CHAPTER 3 EXPERIMENTAL AND ANALYTICAL EVALUATION OF RESPONSE OF A RC BEAM-COLUMN SUB-ASSEMBLAGES UNDER A REMOVAL SUPPORT ... 43 3.1INTRODUCTION ... 43 3.2SPECIMEN DESIGN ... 44 3.2.1 Dimensions of specimens ... 45 3.2.2 Material ... 48 3.2.3 Fabrication of specimen ... 50
3.2.4 Estimation of the bearing capacity by traditional design method and identification of the range of failure loads ... 52
3.3.2 Design of the support for the side columns ... 57
3.3.3 Unloading device under the middle column ... 61
3.3.4 Instrumentation ... 61 3.4EXPERIMENTAL PROCEDURE ... 63 3.5TEST RESULTS ... 64 3.5.1 Specimen 1-1 L=2m 110mm×180mm ... 64 3.5.2 Specimen 2-1 L=3m 110mm×180mm ... 69 3.5.3 Specimen 2-2 L=3m 110mm×180mm ... 76 3.5.4 Specimen 3-1 L=3m 110mmx270mm ... 78
3.6THE DYNAMIC ANALYSIS OF THE BEAM-COLUMN ASSEMBLAGES ... 82
3.6.1 Calculation of vibration properties 𝛇, 𝝎𝑫, 𝑻𝑫 ... 82
3.5.2 Evaluation of the damage state of the sub-assemblages under dynamic loads 87 CHAPTER 4 APPLICATION OF CONNECTOR IN SIMULATING BOND-SLIP BEHAVIOR ... 89
4.1INTRODUCTION ... 89
4.2THE CONCRETE CONSTITUTIVE MODEL ... 89
4.3CONNECTOR TECHNOLOGY ... 91
4.3.1 Connector elements ... 91
4.3.2 Connector behavior ... 91
4.4IDENTIFICATION AND VALIDATION OF PARAMETERS FROM PULL-OUT TESTS ... 93
4.4.1 Identification of parameters ... 93
4.4.2 Numerical model of pull-out test ... 94
4.4.3 Identification the connector parameters (D12mm) ... 95
4.4.4 The effect of different restrain modes on the beam ... 96
CHAPTER 5 NUMERICAL INVESTIGATION OF REINFORCED CONCRETE STRUCTURE IN PROGRESSIVE COLLAPSE ... 102
5.1.1 Assessment of the design of the support for the side columns ... 102
5.1.2 Analysis of the stress and strain of the supports ... 103
5.2NUMERICAL SIMULATION THE BEAM-COLUMN ASSEMBLAGES UNDER THE REMOVAL OF THE MIDDLE SUPPORT ... 108
5.2.1 Evaluation the resistance of beam-column assemblages subjected to the middle support removal in the quasi-static state loading ... 109
5.2.2 Numerical simulation study of the dynamic behavior of beam-column assemblages subjected to middle support removal ... 118
CHAPTER 6 CONCLUSIONS AND RECOMMENDATIONS ... 125
6.1CONCLUSIONS ... 125
6.2RECOMMENDATIONS FOR FUTURE RESEARCH ... 128
6.2.1 Experimental research ... 128
6.2.2 Numerical simulation ... 129
List of figures
Figure 1. 1 Ronan point apartment collapse, 1968 ...2
Figure 1. 2 Murrah Federal Office building, 1995 ...2
Figure 1. 3 World trade center, 2001 ...3
Figure 1. 4 Bankers trust, New York ...4
Figure 2. 1 Measurement of θ after formation of plastic hinges ... 14
Figure 2. 2 (a) Collapse limit state of model frame; (b) middle column load versus unloading displacement of failed middle column; (c) effect of downward displacement of middle column on horizontal displacement of columns at first floor.( Yi et al 2008) ... 19
Figure 2. 3(a) South-east view of evaluated building; (b) Locations of strain gauges on first floor columns; (c) Strain gauge histories installed on first floor Column A1. (Sasani and Sagiroglu, 2008) ... 20
Figure 2. 4 The circled columns on North Side of the Building were Removed During the Experiment (Sezen and Song, 2009)... 20
Figure 2. 5 (a) Model of frame; (b) static collapse test setup; (c) frame horizontal displacement (He, 2009) ... 21
Figure 2. 6 Force-displacement relationships (Sasani and Kropelnicki, 2008) ... 22
Figure 2. 7 (a) Test setup; (b) effect of flexural reinforcement ratio; (b) effect of ratio of beam span to depth. (Su et al. 2008) ... 23
Figure 2. 8 (a) The specimen and the boundary conditions;(b) The detailing of the beam-column specimen; (c) The relationship between the applied force and the middle joint displacement; (d) The relationship between the horizontal reaction force and the middle joint displacement. (Yu and Tan, 2010) ... 24
Figure 2. 9 (a) Test set-up for the beam-column; (b) Load-displacement relationships; (c) Reinforcement detailing of the specimen ;(d) Damage mode of the specimen (H.Choi, J.Kim 2011) 5S: 5 storey, seismic-load resisting; 5G: 5 storey, gravity-load resisting .... 26
Figure 2. 10 (a) Illustration of moment redistribution and deformed shape; (b) the test set-up. (Yap and Li, 2011) ... 27
Figure 2. 11 (a) Overview of a specimen prior testing; (b) Reaction force versus vertical displacement responses (Qian and Li, 2012) ... 27
Figure 2. 12 (a) experimental set-up; (b) Vertical load versus displacement of the middle column (Lanhui Guo et. al, 2013)... 28
Figure 2. 13 Pictures of RC structures after the experiments. Macro-cracks are visible near the middle joint. (a) Rebar ∅8 h=180mm; (b) Rebar ∅12 h=180mm (P. Forquin and W. Chen, 2014) ... 29
Figure 2. 14 (a) overview of test setup; (b) configuration of middle column; (c) testing procedure at 30ms; (d) at the end of the test. (Jun Yu et al., 2013) ... 30
Figure 2. 15 Failure mode of beam-column assemblages ... 33
Figure 2. 16 P-I curves for different damage degrees D (Shi et al., 2010) ... 37
Figure 2. 17 (a) Single story reinforced concrete frame model for blast analysis; (b) Damage contour of the detailed model; (c) Damage contour of the simplified model (Kim et al., 2013) ... 37
Figure 2. 18 Collapse evolution for structures with increasing α (Masoero et al. 2010) ... 38
Figure 2. 19 Pull out test: Failure types for concrete specimen with and without confinement (W.Yeih et al. 1997) ... 40
Figure 2. 20 (a) Bond failure at the steel concrete interface; (b) Steel bar failure (J. Humbert et al. 2009) ... 40
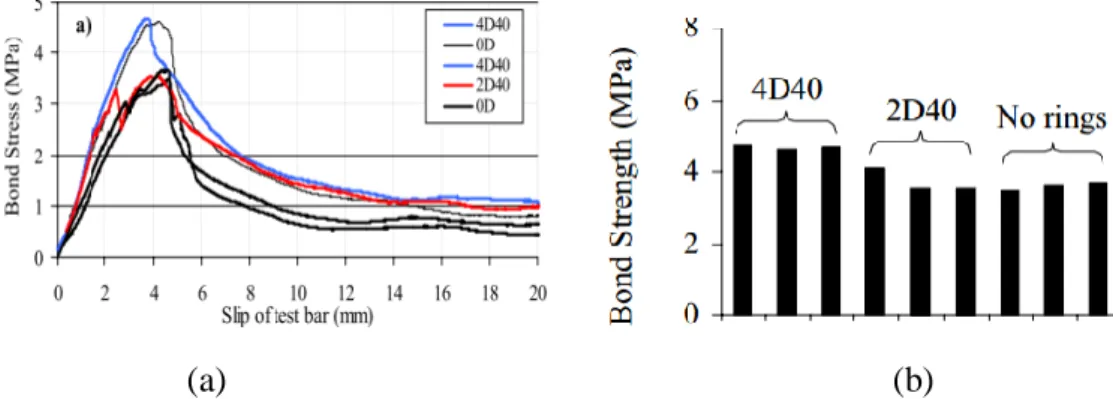
Figure 2. 21 (a) Mode failure of specimen without rings (0D); (b) Mode failure of specimen with rings (4D40) (Tastani and Pantazopoulou, 2002) ... 41
Figure 2. 22 (a) Slip curve of DTP-BT of steel bars with different arrangements of loose metal rings along the anchorage; (b) comparative values of bond strength obtained by two test setups (Tastani and Pantazopoulou, 2002) ... 41
Figure 2. 23 (a) Radial stress; (b) Longitudinal stress (Mahran, 2008) ... 42
Figure 3. 1 The prototype building and local sub-assemblage used for the test ... 45
Figure 3. 2 Boundaries of removed elements based on GSA ... 45
Figure 3. 3 Specimen S1 180x110 L=2000mm ... 47
Figure 3. 4 Specimen S2 180x110 L=3000mm ... 47
Figure 3. 5 Specimen S3 270x110 L=3000mm ... 48
Figure 3. 6 Stress-strain curve of steel rebar... 50
Figure 3. 7 Making of specimens (a) Reinforcement cage and mould; (b) concrete constituents; (c) Casting the specimen; (d) Spraying the specimen ... 51
Figure 3. 8 Flowchart of the concrete mixing ... 52
Figure 3. 9 Rectangular stress distribution (Eurocode 1-1) ... 53
Figure 3. 10 Bending moment diagram ... 54
Figure 3. 11 Layout of test set-up ... 56
Figure 3. 12 (a) front elevation of the loading system; (b) lateral view of the loading system 57 Figure 3. 13 The support for side columns ... 58
Figure 3. 14 Deformation of structure after the removal of the middle support ... 59
Figure 3. 15 Simplified diagram of the deformed shape of the support connector plate ... 59
Figure 3. 16 designed support for side columns ... 60
Figure 3. 17 Unloading device ... 61
Figure 3. 18 Measurement device ... 63
Figure 3. 19 Layout of set-up before the test ... 64
Figure 3. 20 Calculation sketch of the resistance force ... 65
Figure 3. 21 Velocity of the middle column of the specimen 1-1 under the dynamic load 2662kg. The maximum velocity is 0.43m/s. ... 67
Figure 3. 22 Time history of vertical displacement of the middle column and the strain field under the load 2662kg ... 67
Figure 3. 23 The vertical displacement of the middle column versus time and the damage under the load 2662kg ... 67
Figure 3. 24 (a) Resistance force versus vertical displacement of middle column; (b) The stain field near the middle joint by the DIC (S1-1 Load=2662kg) ... 68
Figure 3. 25 Calculation diagram of the displacement of the support... 69
Figure 3. 28 Velocity versus time under several successive loadings of 675kg ... 71
Figure 3. 29 Vertical displacement of the middle column versus time for the first loading at 675kg and strain fields in the horizontal direction ... 72
Figure 3. 30 Vertical displacement of the middle column versus time under the load of 675kg for the second time and the strain in the horizontal direction ... 72
Figure 3. 31 Velocity versus time under the load of 994kg ... 72
Figure 3. 32 Vertical displacement of the middle column versus time under the load of 994kg for the first time and the strain field in the horizontal direction ... 73
Figure 3. 33 Crack development after the first loading at 994kg... 73
Figure 3. 34 Vertical displacement of the middle column versus time under the third loading at 994 kg and the strain of the side column in the horizontal direction ... 73
Figure 3. 35 Crack development under the third loading at 994 kg ... 74
Figure 3. 36 Velocity versus time under a loading of 2063kg and after undergoing previous loading of 675kg and 994kg ... 75
Figure 3. 37 Vertical displacement of the middle column versus time under the load of 2063kg ... 75
Figure 3. 38 Failure mode of the structure under the load of 2063kg ... 75
Figure 3. 39 Velocity versus time under a loading of 2063kg (the specimen 2-1 was previously loaded with multiple smaller loading; the specimen 2-2 was loaded with a unique load of 2063kg.) ... 77
Figure 3. 40 Vertical displacement of the middle column versus time under a load of 2063kg ... 77
Figure 3. 41 (a) Time history of vertical resistance force; (b) Resistance force versus vertical displacement of middle column (S2-1 Load=2063kg, S2-2 Load=2063kg) ... 78
Figure 3. 42 Velocity versus time under successive loads of 994kg ... 80
Figure 3. 43 Vertical displacement of the middle column versus time and strain field under the load of 994kg (first loading time) ... 80
Figure 3. 44 Vertical displacement of the middle column versus time and the strain under the load of 994kg (second loading time) ... 80
Figure 3. 45 Velocity versus time under the load 2737kg (third loading time) ... 81
Figure 3. 46 Vertical displacement of the middle column versus time and strain field under the load 2737kg (third loading time) ... 81
Figure 3. 47 Damage of structure under the load of 2737kg at the end of the test ... 81
Figure 3. 48 (a) Time history of vertical resistance force; (b) Resistance force versus vertical displacement of middle column (S3-1 Load=2737kg) ... 82
Figure 3. 49 Dynamic analysis diagram ... 83
Figure 4. 1 Connector damage evolution ... 91
Figure 4. 2 Evolution of force versus displacement for the pull out tests ... 94
Figure 4. 3 Boundary and loading conditions for the FE model ... 95
Figure 4. 4 Schematic representation of connector in FE model ... 95
Figure 4. 5 (a) Pull out force versus displacement of steel bar; (b) The response of the single connector (D12mm) ... 96
Figure 4. 7 Numerical model of reinforcement cage for the three studied cases ... 98
Figure 4. 8 Effect of different constraint modes of rebars on bearing capacity (D12mm) of beams ... 99
Figure 4. 9 Cracking development ... 100
Figure 5. 1 Calculation sketch diagram ... 102
Figure 5. 2 Force diagram of beam-column assemblage in elastic state (a) horizontal force; (b) vertical force; (c) bending moment... 103
Figure 5. 3 Details of the support (thickness=5mm, 4 slices) ... 104
Figure 5. 4 Details of the support (thickness=5mm, 6 slices) ... 104
Figure 5. 5 Details of the support (thickness=4mm, 6 slices) ... 105
Figure 5. 6 (a) Mises stress in the support; (b) Lateral displacement of the support (thickness=5mm, 4 slices) ... 106
Figure 5. 7 (a) Mises stress in the support; (b) Lateral displacement of the support (thickness=5mm, 6 slices) ... 107
Figure 5. 8 (a) Mises stress in the support; (b) Lateral displacement of the support (thickness=4mm, 6 slices) ... 108
Figure 5. 9 Numerical model used in ABAQUS representing the quarter of a beam ... 110
Figure 5. 10 Additional connectors in the plastic zone... 110
Figure 5. 11 Middle column load versus vertical displacement of failed middle column ... 112
Figure 5. 12 Effect of downward displacement of middle column on horizontal displacement ... 113
Figure 5. 13 PEEQ of tension reinforcement at middle and end sections ... 116
Figure 5. 14 Damage development in the specimen ... 118
Figure 5. 15 Numerical model used in ABAQUS and gravitational field ... 118
Figure 5. 16 Resistance force versus vertical displacement of middle column ... 120
Figure 5. 17 Comparison of experimental and numerical results for the vertical displacement history of the middle joint ... 121
List of tables
Table 2. 1 Strength-increase factor for various construction materials ... 14
Table 2. 2 Size of specimens in different experiments ... 33
Table 3. 1 Span-depth ratio of the specimen ... 48
Table 3. 2 specimen properties ... 48
Table 3. 3 Composition and properties of R30A7 concrete [22] [77] ... 49
Table 3. 4 Material properties of steel reinforcement [22] ... 50
Table 3. 5 Consumption of materials for each type of specimen ... 51
Table 3. 6 Basic configuration of specimens and bearing capacity... 55
Table 3. 7 The summary of experimental results ... 82
Table 3. 8 The stiffness of the beam ... 83
Table 3. 9 The frequency and period of damped vibration ... 87
Table 3. 10 Damage factor of the structure under different level loads ... 88
Table 4. 1 Parameters of connector law (with hardening) for D12mm ... 94
Chapter 1 Introduction
1.1 Background
Generally, a building is designed by taking into account the applied static dead load, live load, and depending on the location of the building, seismic and climate related loads. While some important existing buildings could be subjected to abnormal loadings such as earthquake, explosion or other man-made or natural hazards. These accidental events may induce local structural damage. This local failure leads to a load redistribution in the structure and may cause a chain reaction of key structure load-carrying members’ failures disproportionate to the initial damage, leading to more widespread failure of the surrounding members and partial or complete structure collapse. This type of collapse is named “progressive collapse”. The General Services Administration of the United States (2003) defines this phenomenon as “a situation where local failure of a primary structural component leads to the collapse of adjoining members which, in turn, leads to additional collapse.[1]” Other definition is from ASCE/SEI 7 (2010) “the spread of an initial local failure from element to element, eventually resulting in the collapse of an entire structure or disproportionately large part of it. [2]” The key characteristic of both is that the total damage is disproportionate to the original cause.
One of the earliest well-known example of progressive collapse was the collapse of Ronan Point apartment. On the morning of 6 May 1968, Ronan point apartment tower in east London, partially collapsed due to a gas explosion, which pulled down the precast concrete panels near the corner of the building. The loss of support at the 18th floor leaded to the floors above to collapse. Four people died in this accident. The impact of the upper floors on the lower ones led to a sequential failure all the way down to the ground level [3]. As a result, the entire corner of the building collapsed, as can be observed in Figure 1. 1. This partial collapse was attributed to the inability of the structure to redirect loads after the loss of a load-carrying member. It is a particularly representative example since the magnitude of the collapse was completely out of proportion with respect to the triggering event [3]. Since the collapse of the Ronan Point, the progressive collapse resistance of building structures has attracted the attention of engineers
After that event, there have been more global progressive collapse accidents due to various reasons.
Figure 1. 1 Ronan point apartment collapse, 1968
On 19 April 1995, the Murrah Federal Office building in Oklahoma City collapsed consequently to a bomb attack [4], which only destroyed three columns initially. The failure was transferred from location columns to adjacent girders causing the progressive collapse of the upper stories. Finally, the whole building was destroyed (Figure 1. 2.) and 168 people were killed as well as more than 800 people were injured in this terrorist attack.
The World trade center in New York City was attacked by terrorist on 11 September 2001. A Boeing 767 airplane crashed into the building at a very high speed (see Figure 1. 3). The crash caused fire hazard so that the internal steel components softened and lost their ability to support load above. It results in a progression of failures extending from impact zone to the ground. According to the report prepared by the National Institute of Standards and Technology (NIST, 2008a) the fireproofing on the Twin Towers' steel infrastructures was blown off by the initial impact of the planes and concluded that, if this had not occurred, the towers would likely have remained standing [5]. It was a horrible disaster. More than thousand people lost their lives in that event. In fact, as early as 1993, the World Trade center was already attacked by a car bomb, which exploded in the underground garage [6]. The explosion resulted in severe damage in the garage, however, the building didn’t collapse.
Figure 1. 3 World trade center, 2001
Debris from collapse of WTC 2 removed an exterior column over a partial height of the Bankers trust building (see Figure 1. 4). The redundancy of the structure above provided the necessary bridge to transfer loads from the lost column.
Figure 1. 4 Bankers trust, New York
With the recent collapse of the Federal Building, World Trade Center, and subsequently a series of accident during this decade, it is noted that large-scale public buildings are much easier to suffer from destruction. When this kind of building collapse, it often causes costly damages and massive casualties and can have very bad social consequences. In the international structural engineering academic circles, “progressive collapse” and “disproportionate collapse” have become common vocabulary. Reinforced concrete structures are widely used in civil engineering throughout the world as well as for large infrastructures or buildings. Abnormal loads may induce local structural damage that occurs firstly at the beam-column joint leading to more widespread failure of the surrounding members and to partial or complete structure collapse. Therefore, apart from ensuring the security and reliability of the structure in strength, stability and rigidness when it bears its service design load designed from regular design methods, a reinforced concrete structure also should be able to resist to abnormal load caused by a local damage or by a sudden change in the support system.
1.2 Scope and objectives
In observing above cases of collapse, although progressive collapse involves the global structure with partial or full collapse, the crucial issue is the behavior of the local structure subjected to accidental load. Beam-column system is a very common structural building system that can be chosen as a typical structure. In experimental work, the beam-column is then a
subassembly often used as a laboratory testing object. Based on the two federal guidelines GSA 2003 and DoD 2005 that provided the strategy and proposed threat independent-analysis procedures to evaluate the potential of progressive collapse of a structure following the notional removal of major loading bearing elements, one of the most probable scenarios is the loss of exterior ground column. In that case, the effect of abnormal load on the adjacent elements can be considered apart from testing object. In terms of experimental studies in the literature, there are few dynamic tests conducted to investigate the response of structures by removing the middle vertical supporting element. Using a well designed fusing support for the middle column, this test can reproduce a typical dynamic local failure process.
A partial damage of the structure due to accidental load could trigger progressive collapse, which involves a series of nonlinear problems such as brittle damage of concrete, interaction between concrete and steel bar as well as large deformation of members beyond the traditional scope of design. In numerical simulation studies, these efforts focus on material (brittle damage) and geometric (interaction between concrete and steel bars) nonlinearities in the process of component failure. For this purpose, a concrete anisotropic damage model, named DFH model, was used in this numerical calculation. In addition, a type of spring wire connector was applied for the detailed modeling of reinforced concrete structures with the commercial finite element code ABAQUS.
The overall objective of this research is to characterize the resisting mechanisms and to better understand the dynamic response of the reinforced concrete structure after the loss of a vertical supporting component. In conjunction with the general objective, dynamic tests of beam-column sub-assemblages with different sections and span lengths were conducted to investigate the effect of reinforcement ratio and the effect of span-depth ratio (span of beam divided by the depth of the beam) on the behavior of beam-column assemblages. The characterization of the resisting mechanisms has been done using the results of the experiments and thanks to analytical studies. In addition, the research was devoted to the development of an experimental equipment including the loading and unloading system as well as the support system for the testing
Another objective is to propose and to validate a numerical simulation approach which is able to deal with the nonlinear problem that constitute the simulation of progressive collapse of reinforced concrete building.
1.3 Organization the dissertation
This dissertation is organized as follows:
Chapter 1 presents the background of progressive collapse and gives a series of examples of progressive collapse. The scope and the objectives of this research work are also presented. The last part presents the organization of dissertation.
Chapter 2 summarizes regulations, provision and analysis techniques in current codes and standards concerning progressive collapse resistance and introduces research progresses of recent years.
A dynamic test of beam-column assemblies is designed and presented in Chapter 3, including design of specimens, test set-up and obtained results. Four beam-column specimens with different sizes were tested under middle support removal scenario. It is highlighted that a new type of steel support was adopted in this test instead of common pin or fixed supports constraint so that it can supply a boundary conditions close to the member in the real frame would do. This section also discusses the results for successive increasing loading process.
Chapter 4 mainly presents connector skill. Connector model is built to describe the nonlinear relationship between two nodes. On the basis of this model, the interaction of concrete and reinforcement bars can be studied. This connector model was used to simulate the pull-out test successfully. The effect of parameters on the model is also studied.
Numerical simulation work is reported in Chapter 5. In this section, the dynamic tests are simulated. The connector element is used in the beam-column numerical model in order to analyze the influence of reinforcement bar in the overload resistance.
Chapter 2 Literature review
In the literature, it is found that the bond strength of reinforcing steel bar and concrete has a great influence on the bearing capacity of components [5][10]. Considering this, the review literature was divided into four parts, codes and standards, experimental works, numerical simulation works and studying of bond slip behavior between reinforcing steel bar and concrete.
2.1 Regulations and provisions for resistance progressive collapse in codes and standards
2.1.1 European standard
The Eurocodes are detailed and comprehensive standards covering various aspects of structural design. They are divided into packages by groups Eurocodes for each of building materials, reinforced concrete, steel, composite concrete and steel, timber and so on. Eurocode- basis of structural design states that “A structure shall be designed and executed in such a way that it
will not be damaged by events such as explosion, impact, and the consequences of human errors, to an extent disproportionate to the original cause”[11]. It indicates potential damage shall be
avoided or limited by appropriate choice of one or more of the following:
- avoiding, eliminating or reducing the hazards to which the structure can be subjected; selecting a structural form which has low sensitivity to the hazards considered;
- selecting a structural form and design that can survive adequately the accidental removal of an individual member or a limited part of the structure, or the occurrence of acceptable localized damage;
- avoiding as far as possible structural systems that can collapse without warning; - tying the structural members together.
Part 1-7 of Eurocode 1 provides principles and rules for safety of the buildings and other civil engineering works against identifiable and unidentifiable accidental actions. It emphasizes that structures shall be designed to resist to a progressive collapse resulting from an internal explosion.
Eurocode 2 mainly concerns concrete structure design and civil engineering works in plain, reinforced and prestressed concrete. The chapters that refer to robustness of concrete structure
can be found in the part 1-1. In the section 5 of part 1-1, it presents nonlinear analysis method and plastic analysis in design structure by selecting or changing the calculation parameters of material in order to improve the ductility of the structure.
These sections mainly indicate the basic requirements to meet in the design or the selection of structural form. However, they do not seem to give specific approach or practical information about how meet these requirements in the structural design and no quantitative method can be found in these chapters.
2.1.2 American standards and guidelines
ASCE 7-02
The American Society of Civil Engineers Minimum Design Loads for Buildings and Other
Structures (ASCE, 2002) has a section about “general structural integrity” that mentions
“Buildings and other structures shall be designed to sustain local damage with the structural system as a whole remaining stable and not being damaged to an extent disproportionate to the original local damage. This shall be achieved through an arrangement of the structural elements that provides stability to the entire structural system by transferring loads from any locally damaged region to adjacent regions capable of resisting those loads without collapse. This shall be accomplished by providing sufficient continuity, redundancy, or energy-dissipating capacity (ductility), or a combination thereof, in the members of the structure [3].” In the early days, standard from ASCE mainly focus on redundancy and alternate load paths for avoiding disproportionate collapse. The degree of redundancy is not specified, and the requirements are entirely threat-independent. However, the ASCE 7-10 Standard provides recommendations for enhancing the ductility, continuity and redundancy of the structure.
Direct method is that certain elements considered as key elements are designed to be able to resist the load combination of Equation 2.1, or are checked after removal of an important structural element to provide the required resistance to withstand the gravity load combination of Equation 2.2 and to provide the required lateral stability resistance for the notional lateral force of Equation 2.3 [2] [12].
Alternate load path method:
(0.9 𝑜𝑟 1.2)𝐷 + 0.5𝐿 + 0.2(𝐿𝑟 𝑜𝑟 𝑆 𝑜𝑟 𝑅) (2.1)
Key elements designs:
(0.9 𝑜𝑟 1.2)𝐷 + 𝐴𝑘+ 0.5𝐿 + 0.2𝑆 (2.2) Lateral stability:
𝑁𝑖 = 0.002 ∑ 𝑃𝑖 (2.3) Where: D, L, 𝐿𝑟 S and R are the dead, live, roof live, snow and rain loads respectively;
𝐴𝑘 is the load effect arising from an abnormal event; ∑𝑃𝑖 is the gravity force acting at level i.
ACI 318-11
Similarly, the American Concrete Institute Building Code Requirements for Structural Concrete (ACI, 2002) includes requirements for structural integrity in the chapter 7 about details of reinforcement [13]. The recommendation says in the detailing of reinforcement and connections, members of a structure shall be effectively tied together to improve integrity of the overall structure.
We can also find some prescriptive requirements for continuity of reinforcing steel bars and interconnection members such as following:
- At least one-sixth of the tension reinforcement required for negative moment at the support, but not less than two bars;
- At least one-quarter of the tension reinforcement required for positive moment at midspan, but not less than two bars.
The commentary states that it is the intent of this section of the code to improve the redundancy and ductility in structures. Thus, in the event of damage to a major supporting element or due to an abnormal loading event, the resulting damage may be confined to a relatively small area and the structure will have a better chance to maintain its overall stability.
GSA PBS Facilities Standards 2000
The 2000 edition of the GSA’s Facilities Standards for the Public Buildings Service (GSA, 2000) included a “Progressive Collapse” heading in the “Structural Considerations” section: “The
structure must be able to sustain local damage without destabilizing the whole structure. The failure of a beam, slab, or column shall not result in failure of the structural system below, above, or in adjacent bays. In the case of column failure, damage in the beams and girders above the column shall be limited to large deflections. Collapse of floors or roofs must not be permitted.”
This is an absolute and unequivocal requirement for one-member (beam, slab, or column) redundancy, unrelated to the degree of vulnerability of the member or the level of threat to the structure[3].
Progressive Collapse Analysis and Design Guidelines for New Federal Office Buildings and Major Modernization Projects (GSA, 2003)
In order to assist in the reduction of the potential for progressive collapse of Federal Office Building and in order to assist in the assessment of the potential for progressive collapse of existing Federal Office Buildings, the U.S. General Services Administration (GSA) published the “Progressive Collapse Analysis and Design Guidelines for New Federal Office Buildings and Major Modernization Projects”. The GSA document provides an insight to current thinking related to mitigating of progressive collapse. This approach is the concept of multiple load paths and structural redundancy which will produce a robust structure. The GSA criteria for new and existing structures, contains guidelines for the analyses of “typical” and “atypical” structural systems [1]. A typical structure is defined as having relatively simple layout with no unusual structural configurations. Unlike the codes of the past, these guidelines provides an independent methodology and a series criteria for improving design and reducing the risk of progressive collapse.
The guidelines give a procedure to estimate progressive collapse potential of the new as well as existing structures. Generally, it can be summarized in four steps [1]
(a) Identify if the building is important and/or big enough to be targeted; (b) Identify if the design of the frame is prone to progressive collapse;
(c) Conduct the analysis to verify the building sensitivity to progressive collapse; (d) Apply structural modifications and restart from step (b).
To determine the potential of progressive collapse for a typical structure, designers can perform structural analyses in which the instantaneous loss of one of the following first floor columns at a time is assumed:
1. An exterior column near the middle of the long side of the building. 2. An exterior column near the middle of the short side of the building. 3. A column located at the corner of the building.
4. A column interior to the perimeter column lines for facilities that have underground parking and/or uncontrolled public ground floor areas.
Designers may use linear elastic static analyses or non-linear dynamic analysis to check structural members in the alternate path structure, i.e. the structure after removal of a single column.
For static analysis purposes the following gravity load is applied to each structural member of the alternate path structure:
Load = 2(DL + 0.25LL) (2.4)
For dynamic analysis procedure, the structure is required to be analyzed under vertical load combination as follows:
Load=DL+0.25LL (2.5)
Where, DL = Dead load; LL = Floor Live load (higher of the design live load or the code live load). The coefficient 2 in the load combination to be used in the static analysis procedure is used to take into account the dynamic effects.
In the section 4 of the guidelines, the Demand Capacity Ratio (DCR) is presented. An examination of the linear elastic analysis results shall be performed to identify the magnitudes and distribution of potential demands on both the primary and secondary structural elements for quantifying potential collapse areas. The magnitude and distribution of these demands can be indicated by DCR. It is calculated from the following equation:
Where 𝑄𝑈𝐷 =Acting force (demand) determined in component or connection/joint (moment, axial force, shear, and possible combined forces); 𝑄𝐶𝐸 = Expected ultimate, un-factored capacity of the component and/or connection/joint (moment, axial force, shear and possible combined forces).
In order to prevent collapse of the alternate path structure, the DCR values for each structural element must be less than or equal to the following:
DCR ≤ 2.0 for typical structural configuration; DCR ≤ 1.5 for atypical structural configuration.
Structural elements that have DCR values exceeding the above limits will not have additional capacity for effectively redistributing loads, are considered failed, and can, therefore, result in collapse of the entire structure. The above DCR methodology is based on NEHRP (National Earthquake Hazards Reduction Program) guidelines for the seismic Rehabilitation of Buildings issued by FEMA in 1997.
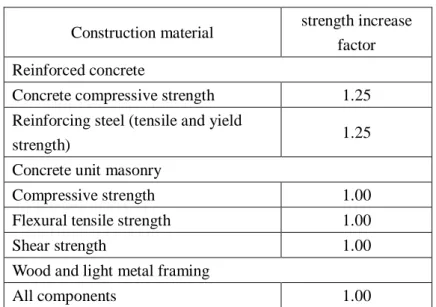
In addition, these guidelines also refer to the material strengths in static linear elastic analysis approach. The guidelines point out that the design material strengths may be increased by a strength-increase factor to determine the expected material strength (for determining capacities, etc.) as the following table 2.1. To determine the ultimate capacity of the structural component, a material strength increase of 25% is allowed for concrete and reinforcing steel. These should be used only in cases where the designer or analyst is confident in the actual state of the facility’s materials.
Table 2. 1 Strength-increase factor for various construction materials
Construction material strength increase factor Reinforced concrete
Concrete compressive strength 1.25 Reinforcing steel (tensile and yield
strength) 1.25
Concrete unit masonry
Compressive strength 1.00
Flexural tensile strength 1.00
Shear strength 1.00
Wood and light metal framing
All components 1.00
Compared to linear analysis procedure, nonlinear analysis procedure is generally a more sophisticated analysis approach to characterize the performance of a structure. The guidelines based upon the plastic hinge rotation and displacement ductility ratios set up a group of acceptance criteria for nonlinear analysis according to various component combinations. It can be used to predict the potential collapse of a structural element. For example, the maximum allowable rotation θ for reinforced concrete beam is 6 degrees [14] [15]. If a beam rotates beyond than 6 degrees, it has the possibility of collapsing. Rotation for members can be determined using Figure 2. 1 provided below.
Figure 2. 1 Measurement of θ after formation of plastic hinges
The GSA guidelines represent the state-of-the-practice in blast engineering of buildings but, similar to current building codes for seismic design, make use of indirect methods of analysis and prescriptive procedures of unknown reliability [16]. In fact, most calculations are based on previous experience. In the actual analysis, because of the time cost factors, people still conduct mostly static linear analysis. The reliability of the results urgently need a lot of dynamic experimental data for reference.
Design of Buildings to Resist Progressive Collapse (UFC 4-023-03) (The Department of Defense (DOD), 2005)
In 1999 and 2001, the department of Defense (DOD) developed interim guidelines to reduce the risk of progressive collapse. These threat independent guidelines were developed to provide resistance to collapse propagating outside of a local collapse region.
In 2004, DOD began an effort to develop a Unified Facilities Criteria (UFC) on the Design of Buildings to Resist Progressive Collapse to provide designers of its facilities with specific, enforceable design criteria for mitigation of progressive collapse due to blast, severe impact or other natural or manmade events. In an effort to update and expand the DOD Interim guidelines, the DOD searched and then adapted the best available approaches from different organizations and countries.
In UFC 4-023-03, structural analyses must consider the “removal” of external columns near the middle of the each side and at the corner of the building. Columns must also be removed at locations where the plan geometry of the structure changes significantly or at locations where there is an abrupt change in loads, member geometry, or bay sizes. The GSA guidelines require only removal of ground floor elements while UFC 4-023-03 requires that analyses to be performed for each floor, one at a time. The motivation for the DOD requirement is that facilities could be attacked with direct or indirect fire weapons, which could damage a structure at upper floors.
DOD has additional prescriptive requirements that increase resistance to progressive collapse. For all Levels of Protection (use UFC 4-020-01 to define a level of protection) [17]:
• All multistory vertical load carrying elements must be capable of supporting the vertical load after the loss of lateral support at any floor level (i.e., a laterally unsupported length equal to two stories must be used in the design or analysis). The loads from the “removed” story should not be applied to the wall or column.
• All floors and roofs must be able to withstand a prescribed net upward load applied to each bay. The uplift loads are not applied concurrently to all bays. For Medium and High Levels of Protection:
• All perimeter columns must have sufficient shear capacity to develop the full plastic flexural moment.
The UFC defines four Occupancy Category (OC) according to the level of occupancy and building function and then sets different levels of design requirements for each category of protection level. Three approaches are presented to design existing and new structures to resist progressive collapse, including tie force, alternate path method and enhanced local resistance.
1. Tie Forces, which prescribe a tensile force strength of the floor or roof system, to allow the transfer of load from the damaged portion of the structure to the undamaged portion; there are three horizontal ties that must be provided: longitudinal, transverse, and peripheral. Vertical ties are required in columns and load bearing walls.
Required tie strength for the longitudinal or transverse ties:
𝐹𝑖 = 3𝑤𝐹𝐿1 (2.7)
Required peripheral tie strength for the frame structures and two-way load-bearing wall buildings:
𝐹𝑖 = 6𝑤𝐹𝐿1𝐿𝑝+ 3𝑊𝑐 (2.8)
𝑤𝐹 is the floor load; 𝑊𝑐 is 1.2 time the dead load of cladding over the length of 𝐿1, where 1.2
is the dead load factor; 𝐿1is the largest of the distances between the centers of the columns, frames, or walls supporting any two adjacent floor spaces in the direction under consideration; 𝐿𝑝 is 1m.
2. Alternate Path method, in which the building must bridge across a removed element. Following the general philosophy of the standard Load and Resistance Factor Design (LRFD) approach, the design strength is taken as the product of the strength reduction factor ϕ and the nominal strength 𝑅𝑛calculated in accordance with the requirements and assumptions of applicable material specific codes. The design strength must be larger than or equal to the required strength:
ϕ𝑅𝑛 ≥ 𝑅𝑢 (2.9)
where ϕ𝑅𝑛 is the design strength; ϕ is the strength reduction factor; 𝑅𝑛corresponds to the nominal strength ; 𝑅𝑢is the required strength.
3. Enhanced Local Resistance, in which the shear and flexural strength of the perimeter columns and walls are increased to provide additional protection by reducing the probability of extent of initial damage.
Taking into account local strengthening in the design easily leads to a large section or size of the component, greatly increases costs and reduces used space. Therefore, these guidelines are more suitable for large-scale public buildings.
In summary, many of the provisions exposed in previous paragraph agreed on common features-ductility, continuity and energy absorption-that structures should possess to help preventing progressive collapse. These guides supply two design methods to consider progressive collapse of structure, indirect design and direct design. The former emphasizes passively providing minimum levels of strength, continuity, and ductility to insure structural integrity. The latter contains the specific load resistance and the alternate path approaches. Few of them offered any quantitative analytical methods for evaluating the potential for progressive collapse.
In addition, researchers found that both the GSA and DoD methods may not give reliable predictions of structural progressive collapse and usually underestimate the stress and strain response at the joint of adjacent columns [16][18]. Besides, the prediction and estimation of the progressive collapse capacity of structure have still absence of efficient method. In order to understand completely the behavior of a structure under progressive collapse, two methods are usually combined: experiment and numerical simulation. It is then necessary to do more bibliography about experimental aspect and numerical simulation analysis that way offer a detail design method for resisting to progressive collapse.
2.2 Experimental research progress
2.2.1 Experiment study performed with RC frames
General services administration describes progressive collapse as follow: “a situation where local failure of a primary structural component leads to the collapse of adjoining members which, in turn, lead to additional collapse.” Many of these collapses are due to explosion, terrorist attack, or other incidental events. Generally, traditional design approach only considered the performance of construction material from elastic to plastic phase, while the progressive collapse of a building more concerns the structure or members in the whole process from plastic to destruction [19].
From the progressive collapse of the Ronan Point apartment tower in 1968, the research on progressive collapse went thought three stages. The key point of research transferred from structure system to process simulation and collapse mechanism step by step. Last decade, many people were enthusiastic about studying progressive collapse through the experimental approach, including both components experimentation and frames experimentation. This subject can be approach from two different perspectives: one for which an ideal collapse of the structure is aimed to be achieved and corresponds to the controlled demolition of a building and another which treats the mitigation of the potential of progressive collapse of structures.
Yi et al. [20] did a static experiment to investigate progressive failure of a RC frame structure. This frame experiment influenced the research developed in LEM3 and 3SR laboratory [21], [22]. A test model as following (see Figure 2. 2 (a)) was tested. It was a four-bay and three story one-third scale model representing a segment of a larger planar frame structure. A constant vertical load of 109 kN was applied on the top of the middle column by a servo-hydraulic actuator. Initially, the load applied by the servo-hydraulic actuator was transmitted to the lower jack through the middle column. Then the step-by-step unloading process was initiated by moving down the mechanical lower jack. In the paper, the authors have thought that failure resulting from progressive collapse of the RC concrete frame structure was ultimately controlled by the rupture of the reinforcing steel bars in the floor beams (step D). This is different from the normal limit state for beam bending, which is controlled either by crushing
of concrete in compression or shear failure. As shown in Figure 2. 2 (b), the process of collapse can be divided into five stages: elastic stage, elastoplastic stage, plastic stage, catenary stage and rebar failure. One can note that the resistance gradually increased after plastic stage. On the curve of load-displacement any softening behavior due to the concrete crushing or tension cracks does appear. It indicates that longitudinal bars have an important effect on the bearing capacity during catenary stage. Figure 2. 2 (c) shows the horizontal displacement of the first-floor frame column. It illustrates that the motion of adjacent joints to the middle column also plays an influence in the bearing capacity.
(a) (b)
(c)
Figure 2. 2 (a) Collapse limit state of model frame; (b) middle column load versus unloading displacement of failed middle column; (c) effect of downward displacement of middle column
on horizontal displacement of columns at first floor.( Yi et al 2008)
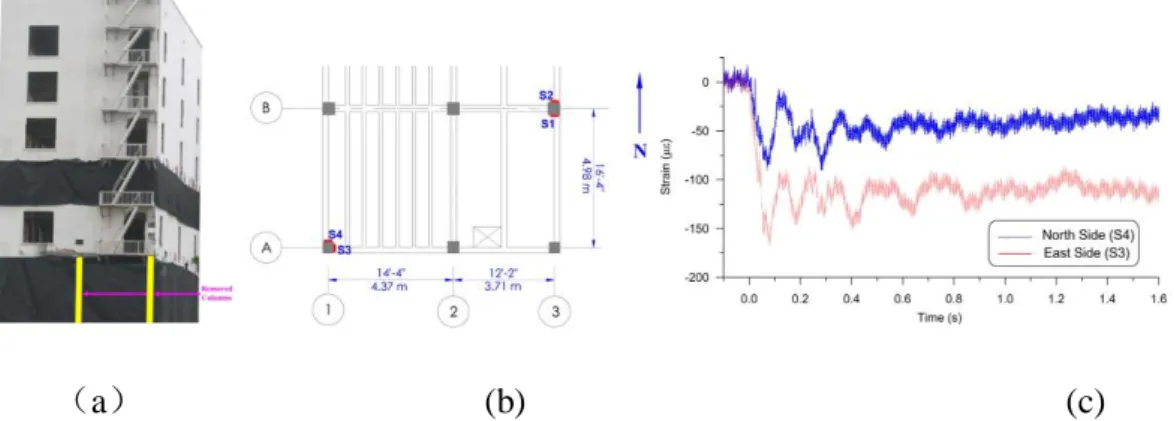
The same year, Sasani and Sagiroglu [18] reported experimental and analytical data from the testing of a building located in San Diego, California. They studied the progressive collapse potential of Hotel San Diego. The Hotel San Diego building was instrumented with similar strain gauges to measure the strain while two of the exterior columns were removed (see Figure
conditions. In this paper, authors also discussed the applicability of GSA (2003) but did not calculate some indexes such as DCR to evaluate each member. The following year, Sezen and Song [23] investigated the progressive collapse performance of an actual steel frame building. The Ohio State Union building was tested by physically removing four of first story columns from one of the long perimeter frames prior to building's scheduled demolition (see Figure 2. 4). They followed the GSA (2003) guidelines and calculated the DCR values when four exterior columns were removed from the structure. Their research compared the predicted and calculated building static responses using the GSA (2003) as a guideline. The results shows that the GAS elastic static analysis method is more conservative.
(a) (b) (c)
Figure 2. 3(a) South-east view of evaluated building; (b) Locations of strain gauges on first floor columns; (c) Strain gauge histories installed on first floor Column A1. (Sasani and
Sagiroglu, 2008)
Figure 2. 4 The circled columns on North Side of the Building were Removed During the Experiment (Sezen and Song, 2009)
He et al [24] performed an 1:3 scaled concrete reinforcement (RC) frame model to investigate the response of building under the middle column sudden removal, followed by a static collapse test under controlled displacement. The experimental model is shown on Figure 2. 5 (a) and the
static collapse test setup on Figure 2. 5 (b). After explosion the bottom column is removed, the vertical or horizontal displacements are only up to several millimeters as show on Figure 2. 5 (c). The whole frame remains in an elastic state. Then, the displacement load was applied at a speed of 10mm/s to the residual frame. This research shows that the catenary action in the frame can transmit a part of gravity load, however, because of the limited lateral stiffness of side columns in the frame, the capacity of the frame could not be markedly raised by catenary action. What a pity is this research did not apply any dynamic load to the residual frame in order to observer the dynamic behavior of the frame. A large number of data should be also dug further.
(a) (b)
(c)
Figure 2. 5 (a) Model of frame; (b) static collapse test setup; (c) frame horizontal displacement (He, 2009)
2.2.2 Beam-column sub-assemblages experiment
Besides frame test, considering the economy and feasibility, a great number of component tests were conducted by many researchers to investigate the performance of RC structures in progressive collapse.
Sasani and Kropelnicki [25] performed an experiment with a 3/8 scaled perimeter beam component model to evaluate the behavior of the beam following the loss of the supporting column. The beam-column model was constructed with fixed boundary conditions. The displacement was applied at the middle column at a rate of 5.08cm/s. The relationships between the vertical force and the displacement of the beam center point obtained is shown in the Figure 2. 6. The bottom bars were broken at the first peak in the curve. Following the bars failure, catenary action provided by the top reinforcement leads in an increasing resistance of the beam.
Figure 2. 6 Force-displacement relationships (Sasani and Kropelnicki, 2008)
In the same year, Su et al. [26] tested twelve specimens in order to study the effect of axially-restrained boundary conditions on progressive collapse resistance. These specimens were designed with different sections and spans. Each specimen represented a two-bay beam resulting from the removal of a supporting column. The results show that the compressive arch action due to longitudinal restrain can significantly enhance the flexural strength of a beam subjected to vertical loads. In the Figure 2. 7 (b), the strength enhancement factor was observed to decrease in an approximately linear pattern from 2.63 to 1.91 as the reinforcement ratio increased from 0.46 to 1.13%. Figure 2. 7 (c) indicates that the strength enhancement factor ∝ that measures the beneficial compressive arch effect on beam gravity load capacity decreases as the 𝑙𝑛/ℎ increases.
(a)
(b) (c)
Figure 2. 7 (a) Test setup; (b) effect of flexural reinforcement ratio; (b) effect of ratio of beam span to depth. (Su et al. 2008)
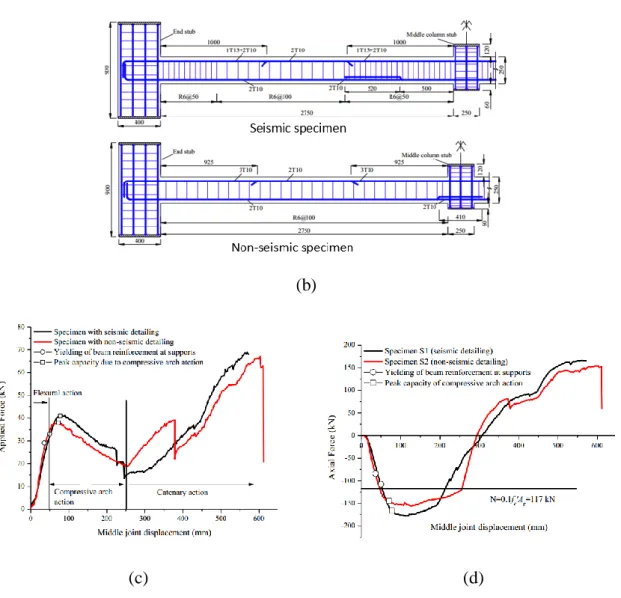
In 2010, Yu and Tan [27] studied the resistance property of RC beam-column sub-assemblages by experimental approaches with either seismic or non-seismic design. One-half scaled specimens were designed and tested under a middle column removal scenario. Each end of specimens was restrained by two rods and pin on rollers as show on Figure 2. 8 (a). Test data on Figure 2. 8 (b) indicate that there is no obvious difference in structural performance due to different design rules. The paper also point out that the conventional plastic hinge mechanism can be used to compute the capacity of flexural action and Park’s model can be modified for calculating the capacity of compressive arch action with an acceptable accuracy.
(b)
(c) (d)
Figure 2. 8 (a) The specimen and the boundary conditions;(b) The detailing of the beam-column specimen; (c) The relationship between the applied force and the middle joint displacement; (d) The relationship between the horizontal reaction force and the middle joint
displacement. (Yu and Tan, 2010)
H. Choi and J. Kim [28] carried out experiments to investigate the progressive collapse-resisting capacity of RC beam-column sub-assemblages built with and without seismic design. The right and left hand columns were fixed to the jigs and the actuator was connected to the middle column. Contrary to above mentioned tests, a monotonically increasing load was applied at the middle column of the specimens in the horizontal direction rather than in vertical direction as show on Figure 2. 9 (a). Force–displacement relationships are plotted in the Figure 2. 9 (b). It was observed that the non-seismically designed specimen failed by crushing of concrete at the exterior column–girder joint of the left-hand girder before catenary action was activated. While, the force–displacement relationship of the specimen designed for seismic load continues to increase after fracture of the girder lower rebars near the middle column due to the catenary
force of upper rebars. The authors thought that significant catenary action of girders could be induced in reinforced concrete moment-resisting buildings seismic design codes against progressive collapse initiated by sudden loss of a column. As previously above mentioned, on the contrary, with the same reinforcement bar, the results from Jun Yu and Kang-Hai Tan’s test [29] show there was no obvious difference in structural performance due to seismic design. Hence, other parameters may have an influence in activating catenary action and this needs to be studied further.
(a) (b)
(d)
Figure 2. 9 (a) Test set-up for the beam-column; (b) Load-displacement relationships; (c) Reinforcement detailing of the specimen ;(d) Damage mode of the specimen (H.Choi, J.Kim
2011) 5S: 5 storey, seismic-load resisting; 5G: 5 storey, gravity-load resisting
In 2011, Yap and Li [30] conducted experiments to investigate the performance of reinforced concrete exterior beam-column sub-assemblages in progressive collapse. In order to ensure loading and boundary conditions closed to actual scenario, the specimens were designed by the bending moment diagram and deformed shape of the assumed structural frame as shown in the Figure 2. 10 (a). The test results indicate the increase in the percentage of transverse reinforcement in the joint region improved the shear strength of the joint through the development of the truss mechanism. A bond failure was observed in the beam bars in specimens without improved design. If the adjacent components cannot carry the increase in load, it may result in a collapse.


![Figure 3. 6 Stress-strain curve of steel rebar Table 3. 4 Material properties of steel reinforcement [22]](https://thumb-eu.123doks.com/thumbv2/123doknet/14528254.723185/68.892.258.613.102.368/figure-stress-strain-curve-table-material-properties-reinforcement.webp)