HAL Id: tel-02425827
https://tel.archives-ouvertes.fr/tel-02425827v2
Submitted on 12 Feb 2021HAL is a multi-disciplinary open access archive for the deposit and dissemination of sci-entific research documents, whether they are pub-lished or not. The documents may come from teaching and research institutions in France or abroad, or from public or private research centers.
L’archive ouverte pluridisciplinaire HAL, est destinée au dépôt et à la diffusion de documents scientifiques de niveau recherche, publiés ou non, émanant des établissements d’enseignement et de recherche français ou étrangers, des laboratoires publics ou privés.
prediction of Alzheimer’s disease
Jorge Alberto Samper Gonzalez
To cite this version:
Jorge Alberto Samper Gonzalez. Learning from multimodal data for classification and prediction of Alzheimer’s disease. Artificial Intelligence [cs.AI]. Sorbonne Université, 2019. English. �NNT : 2019SORUS361�. �tel-02425827v2�
Sorbonne Université
École Doctorale d’Informatique, de Télécommunication et d’Électronique (EDITE) ARAMIS LAB à l’Institut du Cerveau et de la Moelle épinière (ICM)
L E A RN I NG F R O M MU L T I M O DA L DA TA
F OR CL A S S I F I CA T I ON A N D PRE D I C T I ON
O F A L Z HE IME R' S D IS E A S E
APPRENTISS AGE A PARTIR DE DONNEES MULTIMODALES POUR LA CLASIFICATION ET LA PREDICTION DE LA MALADIE D’ALZHEIMER
JORGE A. SAMPER GONZÁLEZ
Thèse de doctorat d’informatique Dirigée par Olivier Colliot et Theodoros Evgeniou
Présentée et soutenue publiquement le 3 avril 2019 Devant un jury composé de :
o M. Christian BARILLOT
Directeur de recherche, CNRS, Rapporteur o M. Habib BENALI
Professeur, Concordia University, Rapporteur o Mme. Aurélie KAS
Professeur, Sorbonne Université, Examinateur o M. Renaud LOPES
Ingénieur de recherche, CHU de Lille, Examinateur o Mme. Ninon BURGOS
Chargée de recherche, CNRS, Invitée, Co-encadrante de thèse o M. Olivier COLLIOT
Directeur de recherche, CNRS, Directeur de thèse o M. Theodoros EVGENIOU
iii
Abstract
LEARNING FROM MULTIMODAL DATA FOR CLASSIFICATION AND PREDICTION OF ALZHEIMER’S DISEASE
by Jorge A. SAMPER GONZÁLEZ
Alzheimer’s disease (AD) is the first cause of dementia worldwide, affecting over 20 million people. Its diagnosis at an early stage is essential to ensure a proper care of patients, and to develop and test novel treatments. AD is a complex disease that has to be characterized by the use of different measurements: cogni-tive and clinical tests, neuroimaging including magnetic resonance imaging (MRI) and positron emission tomography (PET), genotyping, etc. There is an interest in exploring the discriminative and predictive capabilities of these diverse markers, which reflect different aspects of the disease and potentially carry complementary information, from an early stage of the disease.
The objective of this PhD thesis was thus to assess the potential and to integrate multiple modalities using machine learning methods, in order to automatically classify patients with AD and predict the development of the disease from the ear-liest stages. More specifically, we aimed to make progress toward the translation of such approaches toward clinical practice.
The thesis comprises three main studies. The first one tackles the differential diagnosis between different forms of dementia from MRI data. This study was per-formed using clinical routine data, thereby providing a more realistic evaluation scenario. The second one proposes a new framework for reproducible evaluation of AD classification algorithms from MRI and PET data. Indeed, while numer-ous approaches have been proposed for AD classification in the literature, they are difficult to compare and to reproduce. The third part is devoted to the pre-diction of progression to AD in patients with mild cognitive impairment through the integration of multimodal data, including MRI, PET, clinical/cognitive evalu-ations and genotyping. In particular, we systematically assessed the added value of neuroimaging over clinical/cognitive data only. Since neuroimaging is more expensive and less widely available, this is important to justify its use as input of classification algorithms.
v
Résumé
APPRENTISSAGE A PARTIR DE DONNEES MULTIMODALES POUR LA CLASIFICATION ET LA PREDICTION DE LA MALADIE D’ALZHEIMER
par Jorge A. SAMPERGONZÁLEZ
La maladie d’Alzheimer (MA) est la première cause de démence dans le monde, touchant plus de 20 millions de personnes. Son diagnostic précoce est essentiel pour assurer une prise en charge adéquate des patients ainsi que pour développer et tester de nouveaux traitements. La MA est une maladie complexe qui nécessite différentes mesures pour être caractérisée : tests cognitifs et cliniques, neuroim-agerie, notamment l’imagerie par résonance magnétique (IRM) et la tomographie par émission de positons (TEP), génotypage, etc. Il y a un intérêt à explorer les capacités discriminatoires et prédictives à un stade précoce de ces différents mar-queurs, qui reflètent différents aspects de la maladie et peuvent apporter des in-formations complémentaires.
L’objectif de cette thèse de doctorat était d’évaluer le potentiel et d’intégrer dif-férentes modalités à l’aide de méthodes d’apprentissage statistique, afin de classi-fier automatiquement les patients atteints de la MA et de prédire l’évolution de la maladie dès ses premiers stades. Plus précisément, nous visions à progresser vers une future application de ces approches à la pratique clinique.
La thèse comprend trois études principales. La première porte sur le diag-nostic différentiel entre différentes formes de démence à partir des données IRM. Cette étude a été réalisée à l’aide de données de routine clinique, ce qui a permis d’obtenir un scénario d’évaluation plus réaliste. La seconde propose un nouveau cadre pour l’évaluation reproductible des algorithmes de classification de la MA à partir des données IRM et TEP. En effet, bien que de nombreuses approches aient été proposées dans la littérature pour la classification de la MA, elles sont difficiles à comparer et à reproduire. La troisième partie est consacrée à la prédic-tion de l’évoluprédic-tion de la maladie d’Alzheimer chez les patients atteints de troubles cognitifs légers par l’intégration de données multimodales, notamment l’IRM, la TEP, des évaluations cliniques et cognitives, et le génotypage. En particulier, nous avons systématiquement évalué la valeur ajoutée de la neuroimagerie par rap-port aux seules données cliniques/cognitives. Comme la neuroimagerie est plus coûteuse et moins répandue, il est important de justifier son utilisation dans les algorithmes de classification.
vii
Scientific production
JOURNAL PAPERS
1. Samper-González J, Burgos N, Bottani S, Fontanella S, Lu P, Marcoux A, Routier A, Guillon J, Bacci M, Wen J, Bertrand A, Bertin H, Habert M-O, Durrleman S, Evgeniou T, and Colliot O, for the ADNI & the AIBL, Repro-ducible evaluation of classification methods in Alzheimer’s disease: Frame-work and application to MRI and PET data, NeuroImage, 183, 504–521, 2018.
https://hal.inria.fr/hal-01858384.
2. Marcoux A, Burgos N, Bertrand A, Teichmann M, Routier A, Wen J,
Samper-González J, Bottani S, Durrleman S, Habert M-O, and Colliot O, for the ADNI, An Automated Pipeline for the Analysis of PET Data on the Corti-cal Surface, Frontiers in Neuroinformatics, 12, 2018. https://hal.inria. fr/hal-01950933
SUBMITTED JOURNAL PAPERS
1. Morin A, Samper-González J, Bertrand A, Stroer S, Dormont D, Mendes A, Coupe P, Ahdidan J, Levy M, Samri D, Hampel H, Dubois B, Teichmann M, Epelbaum S, and Colliot O, Accuracy of MRI classification algorithms in a tertiary memory center clinical routine cohort, Submitted to
Neuroradiol-ogy.
2. Wen J, Samper-González J, Bottani S, Routier A, Burgos N, Jacquemont T, Fontanella S, Durrleman S, Epelbaum S, Bertrand A, and Colliot O, for the ADNI, Reproducible evaluation of diffusion MRI features for automatic clas-sification of patients with Alzheimer’s disease., Submitted to
Neuroinfor-matics. https://arxiv.org/pdf/1812.11183.pdf.
3. Koval I, Bône A, Louis M, Bottani S, Marcoux A, Samper-González J, Burgos N, Charlier B, Bertrand A, Epelbaum S, Colliot O, Allassonnière S, and Dur-rleman S, for the ADNI, Simulating Alzheimer’s disease progression with personalised digital brain models. https://hal.inria.fr/hal-01964821
PEER-REVIEWED CONFERENCE PROCEEDINGS
1. Samper-González J, Burgos N, Bottani S, Habert MO, Evgeniou T, Epelbaum S, Colliot O, for the ADNI, Reproducible evaluation of methods for predict-ing progression to Alzheimer’s disease from clinical and neuroimagpredict-ing data.
In Proc. SPIE Medical imaging Conference, San Diego, CA, USA, Feb. 2019.
2. Samper-González J, Burgos N, Fontanella S, Bertin H, Habert MO, Durrle-man S, Evgeniou T, and Colliot O, for the ADNI, Yet Another ADNI Ma-chine Learning Paper? Paving the Way Towards Fully-reproducible Research on Classification of Alzheimer’s Disease. In Proc. Workshop on Machine
Learning in Medical Imaging MLMI 2017 [MICCAI Satellite Workshop], Lecture Notes in Computer Science, pp. 53-60. Springer, Québec, Canada, Sept. 2017. https://hal.inria.fr/hal-01578479
3. Burgos N, Samper-González J, Bertrand A, Habert M-O, Ourselin S, Dur-rleman S, Cardoso MJ, and Colliot O, for the ADNI, Individual Analysis of Molecular Brain Imaging Data Through Automatic Identification of Abnor-mality Patterns, In Proc. Workshop on Computational Methods for
Molec-ular Imaging [MICCAI Satellite Workshop], Lecture Notes in Computer Science, Volume Molecular Imaging, Reconstruction and Analysis of Mov-ing Body Organs, and Stroke ImagMov-ing and Treatment, Québec, Canada, Sept. 2017. https://hal.inria.fr/hal-01567343
4. Bône A, Louis M, Routier A, Samper-González J, Bacci M, Charlier B, Colliot O, and Durrleman S, for the ADNI, Prediction of the progression of subcorti-cal brain structures in Alzheimer’s disease from baseline. In Proc. Workshop
on Mathematical Foundations of Computational Anatomy MFCA 2017 -MICCAI Satellite Workshop, Lecture Notes in Computer Science, Volume Graphs in Biomedical Image Analysis, Computational Anatomy and Imag-ing Genetics, pp. 101-113. SprImag-inger, Québec, Canada, Sept. 2017. https: //hal.archives-ouvertes.fr/hal-01563587v2
CONFERENCE ABSTRACTS
1. Samper-González J, Bottani S, Burgos N, Fontanella S, Lu P, Marcoux A, Routier A, Guillon J, Bacci M, Wen J, Bertrand A, Bertin H, Habert M-O, Dur-rleman S, Evgeniou T, and Colliot O, for the ADNI & the AIBL, Reproducible evaluation of Alzheimer’s Disease classification from MRI and PET data, In
Annual meeting of the Organization for Human Brain Mapping - OHBM 2018, Singapore, June 2018,https://hal.inria.fr/hal-01761666
ix 2. Wen J, Samper-González J, Bottani S, Routier A, Burgos N, Jacquemont T, Fontanella S, Durrleman S, Epelbaum S, Bertrand A, and Colliot O, for the ADNI, Comparison of DTI Features for the Classification of Alzheimer’s Disease: A Reproducible Study, In Annual meeting of the Organization
for Human Brain Mapping - OHBM 2018, Singapore, June 2018, https: //hal.inria.fr/hal-01758206
3. Marcoux A, Burgos N, Bertrand A, Teichmann M, Routier A, Wen J,
Samper-González J, Bottani S, Durrleman S, Habert M-O, and Colliot O, for the ADNI, A pipeline for the analysis of 18F-FDG PET data on the cortical sur-face and its evaluation on ADNI, In Annual meeting of the Organization
for Human Brain Mapping - OHBM 2018, Singapore, June 2018, https: //hal.archives-ouvertes.fr/hal-01757646
4. Routier A, Guillon J, Burgos N, Samper-González J, Wen J, Fontanella S, Bottani S, Jacquemont T, Marcoux A, Gori P, Lu P, Moreau T, Bacci M, Dur-rleman S, and Colliot O, Clinica: an open source software platform for re-producible clinical neuroscience studies, In Annual meeting of the
Orga-nization for Human Brain Mapping - OHBM 2018, Singapore, June 2018,
https://hal.inria.fr/hal-01760658
5. Wen J, Samper-González J, Bottani S, Routier A, Burgos N, Jacquemont T, Fontanella S, Durrleman S, Epelbaum S, Bertrand A, and Colliot O, for the ADNI, Using diffusion MRI for classification and prediction of Alzheimer’s Disease: a reproducible study, In AAIC 2018 - Alzheimer’s Association
In-ternational Conference, Chicago, United States, July 2018, https://hal. inria.fr/hal-01758167
6. Burgos N, Samper-González J, Cardoso MJ, Durrleman S, Ourselin S, Col-liot O, for the ADNI, Early Diagnosis of Alzheimer’s Disease Using Subject-Specific Models of FDG-PET Data In AAIC 2017 - Alzheimer’s
Associa-tion InternaAssocia-tional Conference, Jul 2017, London, United Kingdom. https: //hal.inria.fr/hal-01621383.
TALKS AND POSTERS
1. Oral presentation – SPIE Medical imaging Conference. San Diego, CA, USA, February 2019.
2. Poster – Annual meeting of the Organization for Human Brain Mapping-OHBM, Singapore, June 2018.
3. Poster – 8th International Workshop on Pattern Recognition in Neuroimag-ing, Singapore, June 2018.
4. Poster – International Workshop on Machine Learning in Medical Imaging, Québec, Canada, September 2017.
5. Poster – ICM - IoN Workshop, London, UK, October 2017.
SCIENTIFIC POPULARIZATION
1. Fête de la science, Campus Jussieu, Paris, France, 2016 2. Salon Culture et Jeux Mathématiques, Paris France, 2016 3. Fête de la science, ICM, Paris, France, 2017
xi
Contents
Abstract iii
Résumé v
Scientific production vii
Contents xi
List of Figures xv
List of Tables xvii
List of Abbreviations xix
Introduction 1
1 Machine learning from neuroimaging data to assist the diagnosis of
Alzheimer’s disease 5
1.1 Alzheimer’s disease. . . 5
1.2 Interest of ML for identification of AD . . . 7
1.3 Modalities involved in AD diagnosis . . . 8
1.3.1 Mono-modal approaches . . . 8 1.3.1.1 Anatomical MRI . . . 8 1.3.1.2 PET . . . 10 1.3.1.3 Diffusion MRI . . . 12 1.3.1.4 Functional MRI . . . 13 1.3.1.5 Non-imaging modalities . . . 14 1.3.2 Multimodal approaches . . . 14
1.3.2.1 Anatomical MRI and FDG PET . . . 14
1.3.2.2 Other combinations . . . 14
1.3.2.3 Combination with non-imaging modalities . . . . 15
1.4 Features . . . 15
1.4.1 Voxel-based features . . . 15
1.4.2 Regional features . . . 18
1.5 Dimensionality reduction . . . 19
1.5.1 Feature selection . . . 19
1.5.1.1 Univariate feature selection . . . 19
1.5.1.2 Multivariate feature selection . . . 20
1.5.2 Feature transformation. . . 20
1.6 Learning approaches . . . 21
1.6.1 Logistic regression . . . 21
1.6.2 Support vector machine . . . 21
1.6.3 Ensemble learning . . . 22
1.6.4 Deep neural networks . . . 22
1.6.5 Patch-based grading . . . 23 1.6.6 Multimodality approaches . . . 23 1.7 Validation . . . 24 1.7.1 Cross-validation . . . 24 1.7.2 Performance metrics . . . 25 1.8 Datasets . . . 26 1.9 Conclusion . . . 27
2 Accuracy of MRI classification algorithms in a tertiary memory center clinical routine cohort 29 2.1 Abstract . . . 29
2.2 Introduction . . . 30
2.3 Material and Methods . . . 31
2.3.1 Participants . . . 31
2.3.2 MRI acquisition . . . 33
2.3.3 Fully automated volumetry software . . . 34
2.3.4 Automatic classification using SVM . . . 34
2.3.4.1 Preprocessing: extraction of whole gray matter maps 34 2.3.4.2 SVM classification . . . 34
2.3.5 Radiological classification . . . 35
2.4 Results . . . 36
2.4.1 Automated segmentation software . . . 36
2.4.2 Automatic SVM classification from whole-brain gray matter maps . . . 36
2.4.3 Automatic SVM classification from AVS volumes . . . 38
2.4.4 Radiological classification . . . 38
2.5 Discussion . . . 39
2.6 Conclusion . . . 42
xiii 3 Reproducible evaluation of classification methods in Alzheimer’s
dis-ease: framework and application to MRI and PET data 47
3.1 Abstract . . . 47 3.2 Introduction . . . 48 3.3 Materials . . . 50 3.3.1 Datasets . . . 50 3.3.2 Participants . . . 51 3.3.2.1 ADNI . . . 51 3.3.2.2 AIBL . . . 52 3.3.2.3 OASIS . . . 52 3.3.3 Imaging data . . . 56 3.3.3.1 ADNI . . . 56 3.3.3.2 AIBL . . . 56 3.3.3.3 OASIS . . . 56 3.4 Methods . . . 57
3.4.1 Converting datasets to a standardized data structure . . . . 57
3.4.1.1 Conversion of the ADNI dataset to BIDS . . . 58
3.4.1.2 Conversion of the AIBL dataset to BIDS . . . 59
3.4.1.3 Conversion of the OASIS dataset to BIDS. . . 59
3.4.2 Preprocessing pipelines . . . 60
3.4.2.1 Preprocessing of T1-weighted MR images . . . 60
3.4.2.2 Preprocessing of PET images . . . 60
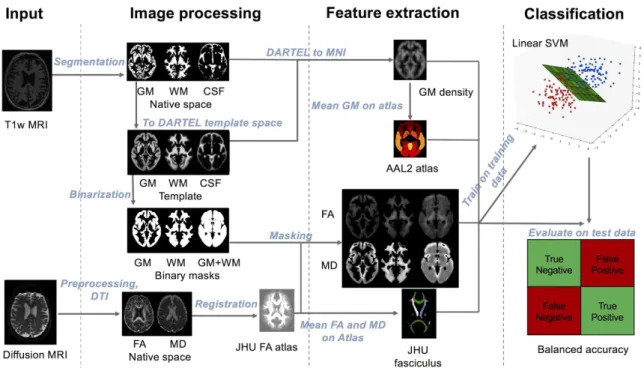
3.4.3 Feature extraction. . . 61
3.4.4 Classification models . . . 62
3.4.4.1 Linear SVM . . . 62
3.4.4.2 Logistic regression with L2 regularization . . . 63
3.4.4.3 Random forest . . . 63 3.4.5 Evaluation strategy . . . 63 3.4.5.1 Cross-validation . . . 63 3.4.5.2 Metrics . . . 64 3.4.6 Classification experiments . . . 65 3.5 Results . . . 67
3.5.1 Influence of the atlas . . . 67
3.5.2 Influence of the smoothing . . . 68
3.5.3 Influence of the type of features. . . 69
3.5.4 Influence of the classification method . . . 70
3.5.5 Influence of the partial volume correction of PET images . . 71
3.5.6 Influence of the magnetic field strength . . . 72
3.5.8 Influence of the dataset . . . 75
3.5.9 Influence of the training dataset size . . . 76
3.5.10 Influence of the diagnostic criteria . . . 78
3.5.11 Computation time . . . 79
3.6 Discussion . . . 79
3.7 Conclusions . . . 84
4 Reproducible evaluation of methods for predicting progression to Alzheimer’s disease from clinical and neuroimaging data 85 4.1 Introduction . . . 85
4.2 Materials and methods . . . 88
4.2.1 Data . . . 88
4.2.2 Data conversion. . . 88
4.2.3 Preprocessing and feature extraction . . . 90
4.2.4 Age correction. . . 91
4.2.5 Classification approaches . . . 91
4.2.5.1 Classification using clinical data . . . 91
4.2.5.2 Image-based classification . . . 91
4.2.5.3 Integrating clinical and imaging data . . . 92
4.2.5.4 Integrating amyloid status . . . 92
4.2.5.5 Prediction at different time-points . . . 92
4.2.6 Validation . . . 93
4.3 Results . . . 93
4.3.1 Classification using clinical data . . . 93
4.3.2 Integration of imaging and clinical data . . . 94
4.3.3 Integration of amyloid status . . . 95
4.3.4 Prediction at different time-points . . . 99
4.4 Conclusions . . . 99
Conclusion & Perspectives 101
A Reproducible evaluation of diffusion MRI features for automatic
classi-fication of patients with Alzheimer’s disease 107
xv
List of Figures
1.1 T1 MRI for CN subject and AD patient . . . 9
1.2 FDG PET for CN subject and AD patient . . . 11
1.3 Amyloid PET for CN subject and AD patient . . . 11
1.4 Diffusion MRI, FA and MD for CN subject and AD patient . . . 13
1.5 GM, WM and CSF tissues probability maps for CN subject and AD patient . . . 16
1.6 Cortical thickness for CN subject and AD patient . . . 17
2.1 Classification results for univariate classification from hippocampal volumes obtained with NeuroreaderTMASS. . . 36
2.2 Classification results for SVM classification from Whole Gray Mat-ter maps . . . 37
2.3 Spatial pattern learned by the classification algorithm . . . 37
2.4 Classification results for SVM classification from all volumes ob-tained using volBrain and NeuroreaderTM . . . 38
2.5 Population Flow Chart. . . 42
2.6 Mean volumes obtained through automatical segmentation using NeuroreaderTM . . . 43
2.7 Classification results for univariate classification from gray matter volumes obtained using NeuroreaderTM . . . 43
2.8 Classification results for univariate classification from caudate nu-cleus volumes obtained using NeuroreaderTM . . . 44
2.9 Classification results for univariate classification from amygdala vol-umes obtained using NeuroreaderTM . . . 44
2.10 Classification results for univariate classification from temporal lobe volumes obtained using NeuroreaderTM . . . 44
2.11 Classification results for univariate classification from frontal lobe volumes obtained using NeuroreaderTM . . . 45
2.12 Classification results for univariate classification from parietal lobe volumes obtained using NeuroreaderTM . . . 45
3.1 Influence of atlas . . . 68
3.3 Influence of classification method . . . 71
3.4 Influence of partial volume correction . . . 72
3.5 Influence of class imbalance . . . 74
3.6 Influence of training dataset size . . . 77
3.7 Influence of training set size when combining datasets . . . 78
xvii
List of Tables
2.1 Demographic and clinical characteristics of the population . . . 33
2.2 Comparative performances of neuroradiologists, univariate AVS, and automatic classifiers . . . 39
3.1 Summary of participant demographics, MMSE and global CDR scores for ADNIT1w . . . 53
3.2 Summary of participant demographics, MMSE and global CDR scores for ADNICLASS . . . 53
3.3 Summary of participant demographics, MMSE and global CDR scores for ADNICLASS,Aβ . . . 54
3.4 Summary of participant demographics, MMSE and global CDR scores for AIBL . . . 55
3.5 Summary of participant demographics, MMSE and global CDR scores for OASIS . . . 55
3.6 List of classification tasks for each dataset. . . 65
3.7 Summary of classifiers and parameters used for each type of features. 66 3.8 Summary of all the classification experiments run in our analysis for each dataset, imaging modality, feature type . . . 67
3.9 Influence of feature types . . . 70
3.10 Influence of magnetic field strength. . . 73
3.11 Influence of dataset . . . 76
4.1 Studied populations. Summary of participant demographics, MMSE and global CDR scores . . . 89
4.2 Subpopulation used for the experiments using MRI-derived vol-umes and a regional FDG-PET feature (as available in ADNIMERGE) 89 4.3 Subpopulation used for the experiments using the amyloid status . 89 4.4 Results for models based on clinical data only (socio-demographic, cognitive data and APOE genotype) . . . 94
4.5 Results for models based on imaging data only and on the combi-nation of imaging and clinical data . . . 96
4.6 Results using MRI-derived volumes and a regional FDG-PET fea-ture (as available in ADNIMERGE) . . . 97
4.7 Results using the amyloid status . . . 98
4.8 Balanced accuracy for sMCI vs pMCI task for different follow up times with the number of subjects in each class. . . 99
xix
List of Abbreviations
Aβ Amyloid beta protein
AD Alzheimer’s disease
ADASCog Alzheimer’s disease assessment scale cognitive sub-scale
ADNI Alzheimer’s Disease Neuroimaging Initiative
AIBL Australian Imaging, Biomarker and Lifestyle Flagship Study of Ageing
ApoE4 Allele 4 of the apolipoprotein E
AUC Area under the receiver operating characteristic curve
AVS Automated volumetry software
BIDS Brain Imaging Data Structure
CBD Cortico-basal syndrome
CDR Clinical dementia rating
CN Cognitively normal
CSF Cerebrospinal fluid
CV Cross-validation
DTI Diffusion tensor imaging
EOAD Early-onset AD
FDG 18F 2-fluoro-2-deoxy-D-glucose
fMRI Functional magnetic resonance imaging
FTD Fronto-temporal dementia
FWHM Full width at half maximum
GM Gray matter
LBD Dementia with Lewy Bodies
LBD Lewy body dementia
LOAD Late-Onset- AD
LogMem Logical Memory test
lv-PPA Logopenic variant of primary progressive aphasia
MCI Mild cognitive impairment
ML Machine learning
MMSE Mini-mental state examination
MNI Standard space of the Montreal Neurological Institute
MRI Magnetic resonance imaging
nf-PPA Non-fluent/agrammatic variant of primary progressive aphasia
OASIS Open Access Series of Imaging Studies
PCA Posterior cortical atrophy
PET Positron emission tomography
pMCI Progressive mild cognitive impairment
PPA primary progressive aphasia
PSP Progressive supranuclear palsy
PVC Partial volume correction
RAVLT Rey auditory verbal learning test
rs-fMRI Resting state functional magnetic resonance imaging
SCD Subjective cognitive decline
SD Semantic variant of primary progressive aphasia
sMCI Stable mild cognitive impairment
SUVR Standardized uptake volume ratio
SVM Support vector machine
T1 T1-weighted magnetic resonance imaging
VD Vascular dementia
WGM Whole gray matter
xxi
A mis abuelos,
1
Introduction
Dementia is a major public health concern that affects a significant part of the world population. Only in France, there were about 1 175 000 patients with de-mentia in 20121. This term describes a group of symptoms usually starting with memory troubles, behavioural changes and cognitive issues. The symptoms pro-gressively worsen until the patient’s death. The main type of dementia is Alzheimer’s disease (AD).
Given that the processes causing these diseases usually start many years before the symptoms appear, it is of great importance to find a way to identify, as early as possible, if a certain subject will develop dementia. This is important to provide adequate care to the patient and information to the family. Moreover, this is vital in order to provide an effective treatment in the future. Indeed, future therapies are more likely to be effective if administered early. It is thus important to iden-tify which patients should be included in clinical trials and/or could benefit of the treatment. Before the development of dementia, patients go through a phase dur-ing which they have objective deficits but which are not severe enough to result in dementia. This phase is called mild cognitive impairment (MCI). Patients with MCI may remain stable or subsequently progress to dementia.
Diagnosis of AD mainly relies on clinical evaluation and cognitive assessment using neuropsychological tests. However, in the past decade, diagnosis has evolved thanks to advances in neuroimaging and fluid biomarkers. Currently, diagno-sis relies not only on clinical assessment, but also on biomarker-based criteria. T1-weighted anatomical magnetic resonance imaging (MRI) and 18F 2-fluoro-2-deoxy-D-glucose (FDG) positron emission tomography (PET) scans provide spa-tial patterns of atrophy and hypometabolism, respectively. This is used to identify the topography of neurodegeneration within the brain. Moreover, pathophysio-logical markers, reflecting the presence of specific abnormal protein deposits, are also available. Specifically, the two pathological hallmarks of AD, amyloid and tau, can be assessed in vivo using PET imaging with specific tracers and with biomarkers of the cerebrospinal fluid (CSF).
However, early and accurate diagnosis remains a difficult task. In particular, how to optimally combine the different measures and markers remains an open
question. To that purpose, machine learning (ML) algorithms are particularly at-tractive due to their ability to learn relevant patterns within the data and pro-vide automatic classifications and predictions. In the past years, large datasets of patients explored with multimodal data have been made available. The most well known is the Alzheimer’s Disease Neuroimaging Initiative2(ADNI) but other publicly available datasets exist, including the Open Access Series of Imaging Studies3 (OASIS) and the Australian Imaging, Biomarker and Lifestyle Flagship Study of Ageing4(AIBL). This has considerably propelled the development of ML methods to assist diagnosis and prognosis of AD: in the last decade, several hun-dreds of papers have been published on that topic.
In spite of these intense research activities, there has been very little translation of these methods to clinical routine. Several reasons may explain this fact.
First, it is very difficult to assess the comparative merits of these approaches. Even though most of them use the same public dataset, ADNI, it is very difficult to compare their performances because they differ in terms of subject subsets, im-age preprocessing or feature extraction procedures. It is thus hard to tell which method performs best and which component of the approach (e.g. feature extrac-tion or classificaextrac-tion algorithm) has the most influence on the results. Moreover, these studies are also very difficult to reproduce because several key components are not readily available. Reproducibility has recently become an important con-cern in areas of science as varied as cognitive psychology, cancer treatment or neu-roimaging. It is also a concern in the field of ML for AD detection.
A second reason is probably that, most of these approaches using neuroimag-ing as input, their performance is very rarely compared to that of clinical/cognitive data. This aspect has been mostly overlooked by the medical image computing community while it is critical to progress towards clinical translation of these ML tools. Indeed, clinical/cognitive data are the core tools used by neurologists to make the diagnosis. In order to adopt neuroimaging-based ML techniques, they will need to be convinced that they offer an added value. Moreover, neuroimaging is more expensive and less widely available than neuropsychological testing.
Finally, most of the published works have been devoted to classification of pa-tients with AD and cognitively normal (CN) subjects, or prediction of progression to AD in patients with MCI. However, distinguishing AD patients and CN sub-jects does not correspond to a clinically realistic scenario. Indeed, several diseases may cause dementia, including AD but also vascular dementia, dementia with Lewy Bodies and fronto-temporal dementia, among others. The clinician is thus
2http://adni.loni.usc.edu/ 3https://www.oasis-brains.org/ 4https://aibl.csiro.au/
Introduction 3 faced with distinguishing between these possible diseases or with cases of subjec-tive cognisubjec-tive impairment. Moreover, most papers have used data from research studies, in which the quality of neuroimaging data is strictly controlled. Few of them have used clinical routine neuroimaging. Therefore, the evaluation of ML techniques in clinically realistic conditions has remained insufficient.
* * *
The general objective of this thesis was to contribute towards the future trans-lation to clinics of ML approaches for diagnosis and prognosis of AD. To that pur-pose, we explored different research avenues which can be grouped into three main categories. The first concerns the evaluation of classification techniques in a more clinically-realistic scenario. Specifically, we evaluated their performance for distinguishing between different types of dementia using clinical routine MRI data. The second objective was to design a framework for reproducible evalua-tion of classificaevalua-tion methods. We designed a unified set of tools for data manage-ment, image preprocessing, feature extraction, classification and evaluation. These tools were made freely available to the community. We applied the framework to compare different modalities (T1 MRI and FDG PET), features, preprocessing and classifiers. The third objective was to assess the added value of neuroimaging com-pared to clinical/cognitive data for prediction of AD in patients with MCI. To that purpose, we leveraged our framework for reproducible evaluation. We proposed new approaches that combine multimodal data (neuroimaging, clinical/cognitive) and systematically evaluated their respective performances.
To summarize, our main contributions are:
• The evaluation of ML techniques for distinguishing between different types of dementia using MRI obtained under clinical conditions.
• The development of a framework for reproducible evaluation of classifica-tion of AD and its applicaclassifica-tion to T1w MRI and FDG PET.
• The combination of multimodal neuroimaging and clinical/cognitive data for prediction of progression of MCI patients.
• The release to the community of open source software that was developed during this PhD.
* * *
The document is divided into five chapters.
First, Chapter1introduces Alzheimer’s disease and the interest of using ma-chine learning for its prediction. It also covers the different data modalities, fea-tures and machine learning techniques used for AD prediction in the last years.
Chapter2presents the study of a cohort (CLINAD) of patients affected by dif-ferent types of dementia. The classification of images obtained in a clinical envi-ronment and how useful it can result for a differential diagnosis are explored.
In Chapter3, we tackle the issue of comparability and reproducibility of AD classification methods. A framework for reproducible and objective classification experiments in AD using three databases is proposed. It is then used to assess the influence of different factors in AD classification.
In Chapter4, previous work (Chapter3) is extended to the combination of mul-timodal clinical and neuroimaging data. In particular, the added value of neu-roimaging over using only clinical data is systematically assessed.
Finally, in Conclusion and Perspectives, the main results are recalled and future work directions are presented.
In addition, we present, as an appendix, another publication to which we con-tributed, in collaboration with another PhD student, Junhao Wen. This study ex-tends the framework we developed for reproducible evaluation to the case of dif-fusion MRI data.
5
Chapter 1
Machine learning from neuroimaging
data to assist the diagnosis of
Alzheimer’s disease
In this chapter we aim to provide an overview of the main concepts involved in this PhD as well as a state of the art on the topic of classification of Alzheimer’s dis-ease (AD) from neuroimaging data based on machine learning (ML) techniques. Note that we do not aim to provide an exhaustive review of all published meth-ods on the topic. This has been addressed by a recently published review paper (Rathore et al.,2017), to which we refer the reader.
The chapter is organized as follows. We first briefly present concepts related to AD and its diagnosis (Section1.1), followed by a motivation for designing ML methods in this field (Secion 1.2). We then introduce the data modalities (neu-roimaging but also non-neu(neu-roimaging) that are of interest (Section 1.3). At the same time, we review the main papers using these modalities either alone or in combination. Section 1.4 presents the different types of features that can be ex-tracted from the data. This is followed by a description of some of the most widely used dimensionality reduction (Section1.5) and learning methods (Section1.6). Fi-nally, we describe how to evaluate the performances of the methods (Section1.7) and the main datasets that have been used for that purpose (Section1.8).
1.1
Alzheimer’s disease
AD is the main cause of dementia. Currently, it has reached epidemic levels, mainly in developed countries with aging populations, but with higher life ex-pectancy across the globe, the number of cases are augmenting rapidly in low and middle income countries. Worldwide, in 2015, there were over 46 millions of per-sons with dementia, and this number is expected to almost double every 20 years1.
This is why research on AD has been made a priority by many countries and in-ternational organizations.
Underlying mechanisms of the disease start many years before the first clini-cal symptoms become noticeable. The stage during which pathologiclini-cal changes accumulate in the absence of any symptoms is called the preclinical or presymp-tomatic stage (Dubois et al., 2016; Sperling et al., 2011). Then, there is a stage during which the patient has mild cognitive deficits, mainly memory troubles, but is not demented. This stage is called mild cognitive impairment (MCI) (Dubois and Albert, 2004; Albert et al., 2011). Next, along with the aggravation of the memory problems, language, executive and motor functions start being affected, making the patient in the impossibility to carry out everyday tasks and thus com-pletely dependent on caregivers. This stage is called dementia (McKhann et al.,
1984; McKhann et al.,2011).
AD is a complex pathology in which different processes co-exist (Duyckaerts, Delatour, and Potier, 2009). The first one is the accumulation of amyloid beta (Aβ) proteins in extracellular space, creating amyloid plaques in the brain. This accumulation can start up to 20 years before the diagnosis. Another observed phenomenon is the formation of neurofibrillary tangles made of tau proteins link-ing to each other inside neurons and causlink-ing their death. These processes lead to the death of neurons resulting in brain atrophy, usually following a specific pattern, and the corresponding functional loss associated to the affected regions. AD is mainly a sporadic disease, even though some familial forms exist. In spo-radic cases, the main known genetic factor is the presence of the allele 4 of the apolipoprotein E (ApoE4) (Mahley, Weisgraber, and Huang,2006).
The diagnosis of AD is typically based on clinical assessment and neuropsy-chological tests, and is usually made once the disease is at an advanced stage. Earlier diagnosis would allow providing adequate care to the patient (for instance symptomatic treatment) and accurate information to the patient and their family. Until now, no effective treatment to slow the progression of the disease, nor to cure it, exists. Late diagnosis is an important barrier to the design and testing of new therapies. Indeed, it is likely that, to be effective, future therapies will need to be administered early in the disease course. In order to achieve an earlier and more accurate diagnosis, new criteria have been published in the last decade (Dubois et al.,2007; Dubois et al.,2014; Albert et al.,2011). These criteria use biomarkers to supplement clinical and cognitive tests. These biomarkers, established thanks to different techniques including neuroimaging and fluid biomarkers (Hampel et al.,
2014), are able to measure different aspects of the pathological process. However, to date, they remain mainly used in the more advanced centers. We will review these biomarkers in more details in Section1.3.
1.2. Interest of ML for identification of AD 7
1.2
Interest of ML for identification of AD
Early and accurate identification of patients with AD is an important task. An attractive avenue for that purpose is to design ML approaches that can exploit dif-ferent types of data to identify patients with AD at an early stage. As previously mentioned, a subject goes through different stages until the development of AD. Depending on the stage that is considered, different ML problems can be formu-lated.
A first question is to differentiate patients with AD dementia (denoted AD pa-tients in the following) from cognitively normal subjects (CN). This is a classifica-tion task that will be referred to as AD vs CN in the following. Earlier studies on ML for AD diagnosis were devoted to this task (e.g. Magnin et al., 2009; Vemuri et al.,2008; Klöppel et al.,2008b). In general, for this task, high classification per-formances have been obtained with most studies achieving between 85% and 95% of accuracy (Rathore et al.,2017). The differences between a CN subject and an AD patient are easily detectable in brain imaging and cognitive tests so the practical applications of these classification systems are limited. They could nevertheless be useful to reinforce the confidence in the diagnosis.
Naturally, studies have then aimed to identify AD from an earlier stage. In particular, one question is to differentiate MCI patients from CN subjects. The problem is that MCI in itself is a very heterogeneous condition that could possibly develop into AD but also into other neurodegenerative diseases, or stay stable as MCI or even revert back to the CN stage. Therefore, the classification of a patient as MCI is not very useful to predict AD directly. Nevertheless, this classification task (MCI vs CN) has been performed in a large number of papers. The obtained classification accuracy typically ranges from 75% to 85%, even though a few stud-ies reach over 90% (Rathore et al.,2017).
A more interesting option is to distinguish MCI subjects that will progress to AD (denoted as pMCI) in the future (e.g. in 12, 18 or 36 months) from those who will remain stable (denoted as sMCI). If the time-point is fixed (e.g. conversion in 36 months), this can be formulated as a classification problem: pMCI vs sMCI. This would allow predicting the group of subjects that will likely develop the disease and could be included in clinical trials. This question has been the subject of in-tense research but the achieved performance is usually within the 65% - 80% range (Rathore et al., 2017). A few studies achieved higher accuracies, namely 82% for (Misra, Fan, and Davatzikos,2009), 81% for (Eskildsen et al.,2013), 86% for (Cabral et al., 2015) and 82% for (Moradi et al., 2015). Nevertheless, such results must be taken with caution since some of these studies involved small samples (Misra, Fan,
and Davatzikos, 2009; Cabral et al., 2015) or imbalanced groups which may dis-tort the accuracy metric. Therefore, prediction of progression to AD among MCI patients remains an unsolved problem.
Would it be possible to go to an even earlier stage and identify CN subjects who will ultimately develop AD? In theory yes, but it would be necessary to study a very large number of subjects with a long follow-up, given that only a fraction of them will develop AD and some only after a long time. Alternative options could be to restrict the study to older CN subjects (e.g. over 75 years), to CN subjects who are positive for a specific pathophysiological biomarker (e.g. amyloid positivity measured using CSF or PET), or to restrict to CN with specific genetic predisposition. Some of these options are for instance explored in the INSIGHT study conducted at the Pitié-Salpêtrière hospital (Dubois et al.,2018).
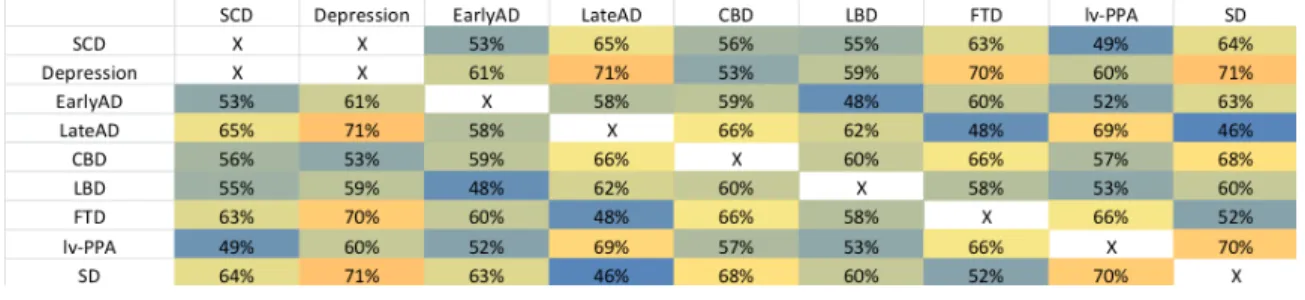
Another challenge for AD classification is differential diagnosis. Indeed, differ-ent types of demdiffer-entia exist, including not only AD but also demdiffer-entia with Lewy Bodies (LBD), vascular dementia (VD), fronto-temporal dementia (FTD) and oth-ers. In practice, specialists have to distinguish between several diseases that can be the cause of a patient’s dementia. A multi-class classification tool able to assist diagnosis based on brain scans and other biomarkers would provide a valuable help to clinicians. Systems distinguishing between different dementia would thus be more useful than those classifying CN vs AD. Only few studies have addressed differential diagnosis of dementia (Davatzikos et al., 2008; Klöppel et al., 2008b; Koikkalainen et al., 2016). Differential diagnosis of AD and FTD was considered in (Davatzikos et al., 2008; Klöppel et al., 2008b). Koikkalainen et al., 2016 con-sidered AD, FTD, VD, and DLB but they did not include other types of dementia such as primary progressive aphasia or corticobasal degeneration.
1.3
Modalities involved in AD diagnosis
In this section, we review the main data modalities that are relevant for identi-fying AD. For each of them, we first briefly explain its interest for AD and then overview some of the main ML approaches using this modality. We also describe ML approaches using multimodal data.
1.3.1
Mono-modal approaches
1.3.1.1 Anatomical MRI
T1-weighted MRI provides an anatomical view of the brain. Currently, scanners have a high spatial resolution and show the different tissue types clearly. Tissue
1.3. Modalities involved in AD diagnosis 9 damage or loss can be estimated through structural MRI and therefore it is an excellent method to assess atrophy (Figure1.1).
FIGURE 1.1: T1 MRI for a cognitively normal subject (left) and for a patient with Alzheimer’s disease (right). One can note the marked atrophy of the medial temporal lobe and the enlargement of the
ven-tricles.
Cerebral atrophy is considered a measure of neurodegeneration. It is corre-lated with tau deposition (Vemuri et al.,2011) and cognitive deficits (Sarazin et al.,
2010). In AD the progression of atrophy is well established, starting in the medial temporal lobe, then the temporal neocortex, associative parietal areas and frontal regions. On the other hand, visual and primary sensorimotor cortices remain rela-tively spared until late in the disease course (Koval et al.,2018).
Another advantage of using MRI is that it is widely available, non-invasive and relatively cheap compared to other modalities. Moreover, it is recommended to systematically perform an MRI for evaluation of dementia or cognitive impair-ment2, mainly for ruling out other possible causes, for example brain tumors. Therefore, in AD patients, MRI is acquired as part of the clinical routine exami-nation.
Atrophy measures of the whole brain and certain specific structures obtained thanks to structural MRI are markers of the neurodegeneration progression and of the disease stage. Hippocampal atrophy, which can be measured using visual rat-ings (Scheltens et al., 1992; Boutet et al.,2012), manual volumetry (Lehéricy et al.,
1994) and automatic volumetry (Chupin et al., 2007), is an established biomarker of AD. Its accuracy to distinguish AD at the dementia stage is quite good (Colliot
et al., 2008) but lower at the MCI stage (Cuingnet et al., 2011). Moreover, hip-pocampal atrophy is not specific of AD and is found in other dementias (De Souza et al.,2013).
For all these reasons, anatomical MRI has been the most widely used modal-ity for developing ML approaches for AD classification and prediction. Based on whole-brain data, AD vs CN classification is usually highly accurate, with accu-racies ranging from 80% to 95 % (Aguilar et al., 2013; Bron et al.,2015; Cuingnet et al., 2011; Farhan, Fahiem, and Tauseef, 2014; Gerardin et al., 2009; Klöppel et al., 2008b; Magnin et al., 2009; Min et al., 2014; Minhas et al., 2018; Tong et al.,
2014; Vemuri et al., 2008; Zhou et al., 2014; Coupé et al., 2012a). On the other hand, the results for predicting conversion of MCI patients are not good, with ac-curacies from 60% to 80% for the classification of sMCI vs pMCI (Aguilar et al.,
2013; Chupin et al., 2009; Cuingnet et al., 2011; Min et al., 2014; Tong et al.,2014; Adaszewski et al., 2013; Plant et al., 2010; Costafreda et al., 2011; Sørensen et al.,
2016).
The low accuracies obtained when predicting the conversion to AD highlight the limitation of anatomical MRI, which is used to measure atrophy, a phenomenon occurring when the disease is already at an advanced stage.
1.3.1.2 PET
Positron emission tomography is a functional imaging technique that provides a representation of a given metabolic process through the detection of a positron-emitting isotope that is bound to a biologically active molecule. Depending on the metabolic process in which this molecule is involved, a specific phenomenon will be observed. Although PET is not as widely available as MRI, is more expensive, and involves injection of a radioactive tracer, it is the second most-widely used modality after anatomical MRI in AD-related ML studies. This is probably because PET provides information about the disease undetectable with MRI and because this modality is available in several publicly available research studies on AD such as ADNI.
1.3.1.2.1 FDG PET FDG is an analog of glucose, the brain’s main source of en-ergy. A reduction of glucose metabolism indicates impairment of synaptic func-tion. In AD patients, the hypometabolism is mainly found in the posterior cingu-late gyri, precuneus, and parietotemporal association cortices (Bailly et al., 2015; Del Sole et al.,2008), see Figure1.2. Regional hypometabolism is not a pathophys-iological marker of AD, but considered a result of its degenerative processes.
1.3. Modalities involved in AD diagnosis 11
FIGURE 1.2: FDG PET for a cognitively normal subject (left) and for a patient with Alzheimer’s disease (right). Hypometabolism can be
observed in the parietal associative areas and the temporal lobe.
1.3.1.2.2 Amyloid PET In amyloid PET, a marker that binds to the Aβ protein is injected to the subject. This amyloid tracer shows the areas of the brain where there occurs an Aβ deposition (Figure 1.3). The common tracers in use are the Pittsburgh Compound-B (PiB) (Klunk et al., 2004), marked with 11C, and more recently the Florbetapir (AV-45) (Choi et al.,2009), Florbetaben (Becker et al.,2013), and Flutemetamol (Vandenberghe et al.,2010), marked with18F.
FIGURE 1.3: Amyloid PET for a cognitively normal subject (left) and for a patient with Alzheimer’s disease (right). The AD patient
presents with diffuse amyloid deposits in the cortex.
The main advantage of the use of amyloid PET is detection of regions with Aβ deposition, making it a pathophysiological marker of AD (Dubois et al.,2014). The deposition occurs very early in the disease course. It is both an advantage, as the pathological process can be detected decades before symptoms, and a drawback,
as CN subjects with positive amyloid PET may not develop AD before a very long time or even not develop it at all.
Amyloid PET in general is expensive to perform and it is not widely available, being currently mainly confined to research studies.
Since the visual pattern of positivity is particularly striking, there have been few studies using ML with amyloid PET as a single modality to assist diagnosis (Vandenberghe et al.,2013).
More recently, PET tracers which can bind to tau protein deposits have been developed (Villemagne et al.,2018).
1.3.1.3 Diffusion MRI
Diffusion MRI measures the diffusion of water along axons and can provide a representation of white matter fiber bundles in the brain. It is sensitive to the microstructural damage that may be present in the white matter bundles and offers different measures of its integrity. Then, it can be used to measure the anatomical connectivity between brain regions. It allows detection of anatomical connectivity injuries that would not be detectable only with anatomical MRI.
Diffusion MRI allows distinguishing the progression pattern of the structural injury of white matter for AD (Figure 1.4). Since the MCI stage, differences with control subjects are observed in the para hippocampal gyrus, temporal white mat-ter, splenium of corpus callosum and posterior cingulum (Chua et al.,2008; Mielke et al., 2009; Huang and Auchus, 2007; Zhang et al., 2007; Fellgiebel et al., 2005). Later, for AD, the damage is more severe in the previous regions and also includes the posterior regions (Bozzali et al.,2002; Nir et al.,2013; Mielke et al.,2009; Huang and Auchus,2007; Zhang et al.,2007).
Typically, classifications making use of diffusion MRI only (O’Dwyer et al.,
2012; Maggipinto et al., 2017; Dyrba et al., 2013; Demirhan et al., 2015; Lella et al., 2017; Haller et al.,2013; Graña et al.,2011; Zhang and Liu,2018; Termenon et al., 2011; Lee, Park, and Han, 2015; Prasad et al.,2015) produce results that range from 76% to 90% of accuracy for CN vs AD, and from 63% to 93% for sMCI vs pMCI.
A drawback of diffusion MRI is that it is not usually part of a clinical routine MRI examination. Moreover, it provides high quality only on scanners with a magnetic field equal or above 3T and results in a longer acquisition time that can be troublesome for the patient.
1.3. Modalities involved in AD diagnosis 13
FIGURE1.4: Diffusion MRI, fractional anisotropy (FA) and mean dif-fusivity (MD) for a cognitively normal subject (left) and for a patient with Alzheimer’s disease (right). FA and MD are computed from the diffusion MRI data. Note that, here, the diffusion MRI is not corrected for artifacts while the FA and MD maps are obtained after the artifact
correction steps.
1.3.1.4 Functional MRI
Functional MRI (fMRI) provides a measure of changes in blood oxygen levels that is an indicator of neuronal activity. fMRI is usually acquired during cognitive tasks or during a resting state (rs-fMRI). Functional connectivity between different brain regions can then analyzed.
In particular, various studies based on rs-fMRI have evidenced alterations in the so-called “default-mode network” in MCI and AD patients (Toussaint et al.,
2014; Greicius et al.,2004). Moreover, the regions that showed connectivity alter-ations match quite well those with a heavier amyloid deposition in AD patients (Sperling et al.,2009).
Several ML approaches have been designed to assist diagnosis of AD from rs-fMRI (Chen et al.,2011; Challis et al.,2015; Khazaee, Ebrahimzadeh, and Babajani-Feremi, 2015). High accuracies have been reported: up to 100% of accuracy to distinguish AD vs CN (Khazaee, Ebrahimzadeh, and Babajani-Feremi, 2015) and up to 91% to distinguish MCI from CN (Chen et al.,2011). However, most of these studies were performed in very small samples (around 20 participants per group).
Such techniques thus need to be evaluated across large, multicenter, datasets. As diffusion MRI, fMRI is usually not part of a clinical routine MRI examina-tion. It is also a technique very sensitive to subject movement and that may be difficult to harmonize across imaging centers.
1.3.1.5 Non-imaging modalities
Besides imaging, other biomarkers exist for the detection of AD.
Cerebrospinal fluid (CSF) provides several markers, the main ones being amy-loid β 1-42 (Aβ1−42), total tau protein (T-tau), and phosphorylated tau protein
(P-tau) (Blennow and Zetterberg, 2009). These are pathophysiological markers that are specific of AD pathology. Nevertheless, they are invasive due to the lumbar puncture and can be relatively costly (the analysis is not expensive in itself but the patient is often hospitalized for a day to perform the lumbar puncture).
Genetic factors that increase the likelihood of developing AD have been identi-fied. The most important genetic factor is the allele e4 of the ApoE gene (Mahley, Weisgraber, and Huang, 2006). Besides ApoE4, many other genetic variants as-sociated to AD have been discovered (Jansen et al., 2019) but they have a weaker influence compared to ApoE4.
1.3.2
Multimodal approaches
Different modalities can provide different types of information about AD. There-fore, various works have aimed to combine several modalities in order to increase classification performances.
1.3.2.1 Anatomical MRI and FDG PET
The most common combination of modalities found in the literature concerns anatomical MRI and FDG PET. They have reached high classification accuracies for AD vs CN, up to 95% of accuracy (Hinrichs et al., 2009a; Jie et al., 2015; Suk and Shen, 2014; Teipel et al., 2015), but excellent performances could already be reached with a single modality. For the prediction of progression from MCI to AD (sMCI vs pMCI), the accuracy is up to 75% (Jie et al., 2015; Jie et al., 2013; Suk and Shen,2014; Teipel et al.,2015). In such studies, the combination of modalities resulted in a moderate improvement compared to the use of a single modality.
1.3.2.2 Other combinations
Other works have aimed to combine multiple MRI modalities, including anatomi-cal MRI, diffusion MRI and functional MRI. (Dyrba et al.,2015b; Dyrba et al.,2013;
1.4. Features 15 Li et al.,2014a) have combined anatomical and diffusion MRI. (Dyrba et al.,2015a) have combined anatomical, diffusion and resting-state functional MRI.
1.3.2.3 Combination with non-imaging modalities
Several works have aimed to combined imaging and non-imaging modalities. A combination of MRI and CSF was used in (Frölich et al.,2017; Liu et al.,2014; Da-vatzikos et al.,2011), and MRI, FDG-PET and CSF were analyzed in (Lei et al.,2017; Young et al.,2016; Cheng et al.,2015; Zhang et al.,2011). A few works have com-bined imaging and clinical data (Thung et al., 2018; Shmulev and Belyaev, 2018; Kauppi et al., 2018; Ardekani et al., 2017; Frölich et al.,2017; Korolev, Symonds, and Bozoki,2016; Wang et al.,2016; Moradi et al.,2015; Da et al.,2014; Casanova et al., 2013; Cui et al., 2011) for predicting progression to AD in patients with MCI. It is surprising that there are relatively few works on that topic. Indeed, clinical/cognitive data is the central modality used for clinical diagnosis of AD. Moreover, it is widely available and relatively cheap to obtain compared to neu-roimaging or other biomarkers. Even more surprisingly, models combining clin-ical/cognitive data with imaging rarely compare their performance to that ob-tained with clinical/cognitive data alone. This is important to assess the added value of neuroimaging.
1.4
Features
In this section, we give an overview of the main types of features that can be ex-tracted from brain images and that would subsequently be used as input of ML methods.
1.4.1
Voxel-based features
Three-dimensional brain images are composed of voxels. An image X (X ∈ Rp)
will consist of a set of p values, where p is the number of voxels in the image. The number of voxels will depend on the resolution of the image but it typically ranges from 10 M for 1 mm isotropic T1 MRI data to 500 k for low resolution PET images (even though many algorithms will take cropped images as input, thereby working at most with 100 k to 1 M voxels). Many works have considered voxel-based features (Klöppel et al., 2008b; Casanova et al., 2013; Cuingnet et al.,2011; Cuingnet et al., 2010; Termenon et al., 2011; Adaszewski et al., 2013; Plant et al.,
2010; Möller et al., 2015; Dyrba et al., 2015a; Dyrba et al., 2013; Hinrichs et al.,
2009a), i.e. the set of features is a set of values computed at each voxel of the image. In such a case, the dimensionality is that of the image.
In the case of anatomical MRI data, the feature values are usually not the MRI signal itself (which is not quantitative and thus not comparable across subjects) but rather tissue maps (gray matter, white matter and cerebrospinal fluid) obtained from a segmentation (Figure 1.5). In the case of PET data, the values are usually the standardized uptake volume ratio (SUVR), and for diffusion MRI, they are obtained from parametric maps such as fractional anisotropy, mean diffusivity, axial diffusivity or radial diffusivity.
FIGURE 1.5: Gray matter (GM), white matter (WM) and cerebro-spinal fluid (CSF) tissue probability maps from T1 MRI, for a cogni-tively normal subject (left) and for a patient with Alzheimer’s disease
(right). Tissue maps were obtained with the SPM software.
For images of different patients to be comparable, it is necessary to register them into a common space, either into a predefined template, like that of the Mon-treal Neurological Institute (MNI) (Evans et al.,1993), or into a template that is spe-cific to the population under study and that will be estimated (Ashburner, 2007). After this step, the voxels in corresponding position contain comparable informa-tion.
A similar idea can be used in the case of cortical thickness measurements (Hut-ton et al.,2008; Takao, Abe, and Ohtomo,2010). In such a case, surfaces delimiting the interface of the cortical gray matter with the white matter and the CSF are ex-tracted. Cortical thickness is then computed at each vertex of the cortical surface (Figure 1.6). The set of features is then the collection of thickness values at each vertex of the surface. Such approach has been used in (Cuingnet et al., 2011; Li et al.,2014b).
1.4. Features 17
FIGURE1.6: Cortical thickness from T1 MRI, for a cognitively normal subject (left) and for a patient with Alzheimer’s disease (right). One can observe the thinning of the medial temporal and parietal cortices.
Some authors also perform an additional spatial smoothing of the features (Ve-muri et al., 2008). With this step, they attempt to compensate for the anatomical variations between subjects even after the registration and to obtain a more normal error distribution.
The main advantages of voxel-based approaches are: i) all the information from the image is used; ii) there are no assumptions on the possible boundaries of the discriminative regions. The main drawback is the very high dimensionality of the feature space. However, several ML approaches (including support vector machines and L2-regularized logistic regression) have been shown to work well
on such high dimensional data.
It is important to have in mind that there are many different possible process-ing pipelines to extract such sets of features. For anatomical MRI, they can dif-fer by the possible image corrections that are applied (denoising, bias correction, etc.), the tissue segmentation procedure and the inter-individual registration. PET pipelines differ by the presence or absence of a partial volume correction (PVC), the nature of the PVC procedure, the reference regions used to normalize the inten-sity and the registration methods. In the literature, the feature extraction pipelines are highly variable from study to study, making it difficult to compare the results. In particular, it is not clear if an observed improvement in performance comes from a newly proposed ML algorithm or from a more efficient preprocessing or feature extraction.
1.4.2
Regional features
A natural way to reduce the dimensionality is to parcellate the brain into a set of anatomical regions. As a result, the p image voxels or vertices from image X (X ∈ Rp) are grouped into n regions, usually with n p. Different values can
be calculated for each region depending on the type of image, such as volume or mean tissue probability for anatomical MRI (Aguilar et al.,2013; Challis et al.,2015; Cheng et al.,2015; Cuingnet et al.,2011; Jie et al.,2015; Liu et al.,2014; Magnin et al., 2009; Suk and Shen, 2014; Teipel et al., 2015; Zhang et al., 2011; Zhu, Suk, and Shen, 2014b; Magnin et al., 2009) or cortical volume or thickness for cortical surface (Aguilar et al., 2013; Cuingnet et al., 2011; Desikan et al., 2009; McEvoy et al., 2009; Oliveira et al., 2010; Eskildsen et al.,2013; Wee, Yap, and Shen,2013; Lillemark et al., 2014) or average SUVR for PET data (Gray et al., 2012; Pagani et al.,2015).
To obtain such a parcellation, a common approach is to register the patients into a common space, in which a labeled atlas is available. Examples of atlases include the Automated Anatomical Labeling (AAL) atlas (Tzourio-Mazoyer et al., 2002), Hammersmith atlas (Gousias et al., 2008; Hammers et al., 2003) and LONI Prob-abilistic Brain Atlas (LPBA40) (Shattuck et al., 2008) for voxel-based parcellation and Desikan-Killiany atlas (Desikan et al., 2006) and Destrieux Atlas (Destrieux et al.,2010) for surface-based parcellation.
The positive side of regional features is that their number is relatively small. The downside is that usually the region atlases are not created to reflect the studied pathology. For example, the boundaries of the atlas regions may not correspond to the boundaries of the disease alterations. To overcome this drawback, some authors have proposed disease specific parcellations (Min et al., 2014; Fan et al.,
2007).
1.4.3
Graph features
Diffusion MRI and functional MRI can be used to measure anatomical and func-tional connectivity, respectively. In such a case, a natural representation consists in a graph encoding the connection between distant regions. First, the gray mat-ter has to be parcellated into a set of regions. These will constitute the nodes of the graph. The edges and their corresponding weights will then be defined from measures of anatomical or functional connectivity. The matrix representation of the resulting graph can be directly used as features, as done in (Chen et al.,2011; Tong et al., 2014; Challis et al., 2015). Another approach is to derive metrics that will characterize the graph topology (Jie et al., 2014; Dyrba et al.,2015a; Khazaee, Ebrahimzadeh, and Babajani-Feremi, 2015; Wee et al., 2012; Prasad et al., 2015;
1.5. Dimensionality reduction 19 Schouten et al.,2016; Ebadi et al.,2017; Zhu et al.,2014; Zhan et al.,2015; Cai et al.,
2018).
1.5
Dimensionality reduction
Given the possible high-dimensionality of brain imaging features, various works have proposed to reduce the number of features. By using different techniques, some of which will be briefly described next, the number of features is reduced, expecting to keep a maximum of information while reducing redundant features in the data. The aim is to avoid over-fitting when training on datasets of relatively small size (typically a few hundreds of patients), as is often the case in neuroimag-ing.
Broadly speaking, there are two main types of approaches to reduce the di-mensionality. The first is feature selection in which a reduced set of features are selected from the original set. The second is feature transformation which trans-forms the original features into a set of features of smaller dimension. Note that, in this case, the original features are not kept.
1.5.1
Feature selection
There are mainly two types of feature selection: univariate and multivariate.
1.5.1.1 Univariate feature selection
Univariate feature selection aims to determine which features, taken in isolation, are the most discriminant between groups. Techniques differ by the criterion which is used to assess the discriminative power of features. A simple and com-mon approach is to use the result of a univariate statistical test (such as Student’s t-test, ANOVA, Pearson’s correlation, or non-parametric testing) (Cuingnet et al.,
2011; Hinrichs et al., 2009a; Gerardin et al., 2009). A threshold on the p-value (or equivalently on the test’s statistic) is then chosen to select the most discrim-inative ones. Bagging (bootstrap aggregating) is sometimes used to make the selection more robust (Gerardin et al., 2009). A related approach is the Fisher score which selects features that maximize the difference between classes (Khaz-aee, Ebrahimzadeh, and Babajani-Feremi, 2015). A different approach is to use information gain (or Kullback–Leibler divergence), an information-theoretic mea-sure, which has the advantage of being able to also detect non-linear dependence (Dyrba et al.,2013; Dyrba et al.,2015b; Plant et al.,2010). Univariate feature selec-tion has been applied to different types of features, including voxel-based features and region-based features. However, its application to voxel-based features may
result in the selection of a spatially scattered set of features, in particular if no spatial smoothing is applied.
1.5.1.2 Multivariate feature selection
A major drawback of univariate feature selection is that it will not select group of features that would, together, be discriminative, but among which each feature, considered in isolation, is not discriminative. For this reason, multivariate feature selection techniques have been proposed. A thorough review of these techniques is beyond the scope of the present work, one can refer for instance to (Guyon and Elisseeff, 2003; Saeys, Inza, and Larrañaga, 2007; Tang, Alelyani, and Liu, 2004). In our context, various multivariate approaches have been applied, including the support vector machine-recursive feature elimination (Fan, Shen, and Davatzikos,
2005; Hidalgo-Muñoz et al.,2014; Garali,2015) and ReliefF (Demirhan et al.,2015) for instance.
The benefits of feature selection for classification of AD remain controversial. Indeed, while some approaches found increased performances with feature selec-tion (Chu et al., 2012; Demirhan et al., 2015; Ota et al., 2015; Tohka, Moradi, and Huttunen, 2016), other studies reported no improvement (Cuingnet et al., 2011). This may be due to the fact that the feature selection can be considered as an ad-ditional learning step, which may be as prone to over-fitting as the classification algorithm. Over-optimistic performances may be reported when the feature selec-tion step is not properly cross-validated (see secselec-tion 1.7.1). This was for instance demonstrated by (Maggipinto et al.,2017) in the case of AD classification based on diffusion MRI.
1.5.2
Feature transformation
Dimensionality reduction can also be performed through feature transformation, which amounts to finding a space of smaller dimension to which the features are projected. The most classical approach is probably principal component analysis, which has been applied to AD classification (Park et al., 2012; Salvatore et al.,
2015). Drawbacks of this technique include its restriction to linear transformations and the difficulty to interpret the meaning of the components (Dyrba et al.,2015a; Li et al., 2014a; Zhu, Suk, and Shen, 2014b). To alleviate the limitations of linear transformations, manifold learning approaches have been applied in the context of AD classification (Guerrero et al.,2014; Wolz et al.,2012).
Feature transformation may be done in a supervised or unsupervised way. In supervised approaches, the diagnosis (or other clinical information such as cog-nitive scores) may be used to find a subspace in which the projected features are