Publisher’s version / Version de l'éditeur: Internal and Client Reports, 2013-10-01
READ THESE TERMS AND CONDITIONS CAREFULLY BEFORE USING THIS WEBSITE. https://nrc-publications.canada.ca/eng/copyright
Vous avez des questions? Nous pouvons vous aider. Pour communiquer directement avec un auteur, consultez la
première page de la revue dans laquelle son article a été publié afin de trouver ses coordonnées. Si vous n’arrivez pas à les repérer, communiquez avec nous à PublicationsArchive-ArchivesPublications@nrc-cnrc.gc.ca.
Questions? Contact the NRC Publications Archive team at
PublicationsArchive-ArchivesPublications@nrc-cnrc.gc.ca. If you wish to email the authors directly, please see the first page of the publication for their contact information.
NRC Publications Archive
Archives des publications du CNRC
For the publisher’s version, please access the DOI link below./ Pour consulter la version de l’éditeur, utilisez le lien DOI ci-dessous.
https://doi.org/10.4224/21272080
Access and use of this website and the material on it are subject to the Terms and Conditions set forth at
Environmental aspects of RIGHTRAC TDP green munitions
Hawari, Jalal; Monteil-Rivera, Fanny; Halasz, Annamaria; Paquet, Louise; Sunahara, Geoffrey; Rocheleau, Sylvie; Dodard, Sabine; Sarrazin, Manon; Savard, Kathleen; Brochu, Sylvie; Ampleman, Guy; Thiboutot, Sonia; Brousseay, Parick; Catalin Florin, Petre
https://publications-cnrc.canada.ca/fra/droits
L’accès à ce site Web et l’utilisation de son contenu sont assujettis aux conditions présentées dans le site LISEZ CES CONDITIONS ATTENTIVEMENT AVANT D’UTILISER CE SITE WEB.
NRC Publications Record / Notice d'Archives des publications de CNRC:
https://nrc-publications.canada.ca/eng/view/object/?id=da71287a-260f-451d-a63a-8534c7bf9969 https://publications-cnrc.canada.ca/fra/voir/objet/?id=da71287a-260f-451d-a63a-8534c7bf9969
NATIONAL RESEARCH COUNCIL CANADA
ENVIRONMENTAL ASPECTS OF RIGHTRAC
TDP- GREEN MUNITIONS
Annual Report
NRC # ????
Submitted to
Submited by
October 2013
Sylvie Brochu
Defense Research and Development Canada - Valcartier
2459 Blvd Pie-XI Nord, Quebec, Quebec G3J 1X5
Jalal Hawari, PhD Chemistry
Aquatic and Crop Resource Development
National Research Council of Canada
Environmental Aspects of RIGHTTRAC
TDP- Green munitions
Annual Report
Submitted to:
Dr. Sylvie BrochuDefense Research and Development Canada - Valcartier 2459 Blvd Pie-XI Nord, Quebec, Quebec G3J 1X5
NRC-Montreal Team
Analytical & Environmental Chemistry Group
Jalal Hawari, Ph.D. Chemistry (project leader) Fanny Monteil-Rivera, Ph.D. Chemistry Annamaria Halasz, MSc. Analytical Chemistry
Louise Paquet, B.Sc. Chemistry
Applied Ecotoxicology Group
Geoffrey Sunahara, Ph. D. Environmental Toxicology Sylvie Rocheleau, M.Sc.A. Environmental Engineering
Sabine Dodard, M.Sc. Biochemistry Manon Sarrazin, B.Sc. Chemistry
Kathleen Savard, M.Sc. Biology
DRDC Team
Sylvie Brochu, Ph.D. Chemsitry Guy Ampleman, Ph.D. Chemistry Sonia Thiboutot, Ph.D, Chemistry
Parick Brousseau, Ing.
Petre Catalin Florin, Ph.D. Chemistry
ABSTRACT
The Defense Research and Development Canada (DRDC, Valcartier, QC) is
developing new green explosive and propellant formulations, as part of a sustainable training strategy for the Canadian Army. The present research responds to the needs of DRDC by providing necessary physicochemical, chemical, and
ecotoxicological data to help understand the environmental transport, fate and impact of new formulations developed within the RIGHTTRAC (Revolutionary Insensitive, Green and Healthier Training Technology with Reduced Adverse Contamination) project. The present study summarizes the dissolution, transport, transformation, and ecotoxicity of three propellant formulations, SP 7993, SP
Unique, and CMR170, and their soluble components, NG, DPA, ATEC, MC, and EC. In addition, it gathers ecotoxicity data for an explosive formulation, GIM, which has been aged for periods varying from 6 to 24 months.
Amongst the three propellant formulations tested, the single base formulation SP 7993 was found to be the most stable in terms of dissolution, even more stable than the formulation New Green M1 identified as the most stable of previously studied formulations. If scattered on soil surface and subjected to precipitations SP 7993 will give rise to low leakage of ATEC and the latter will not persist in soil.
When comparing the two double base formulations, CRM170 appeared to be more stable than SP Unique. Although the MC/graphite coating present in CMR170 might have been responsible for the higher stability this could not be ascertained due to the concomitant higher NC content of CMR170, which also decreased its ability to dissolve. If released in the environment CMR170 will induce small leakage of NG and MC, whereas SP Unique will induce a substantial leakage of NG along with a small leakage of DPA. NG which was found to be relatively stable and highly mobile in Valcartier soil will likely occur in soil in a bioavailable form.
Based on the present ecotoxicological assessment of the SP 7993, SP Unique, and CMR170 formulations, the SP 7993 formulation was the least toxic formulation, and the SP Unique formulation was toxic to the aquatic and terrestrial organisms tested,
whereas the CMR170 formulation was toxic to the terrestrial organisms only. The toxicity of the SP Unique and CMR170 formulations can be attributed to the presence of nitroglycerin in both formulations.
The ecotoxicity of GIM (Green Insensitive Munitions) after weathering and aging (W-A) was compared with data previously obtained using fresh GIM. GIM-amended soil weathered and aged for 6 months showed a time-dependent decrease in TNT content. However, toxicity tests conducted using earthworms and plants did not show any significant toxicity decrease in the aged samples compared to freshly amended soil, suggesting that longer weathering times would be necessary to detect an effect. Aquatic toxicity tests (microtox assay and algae) of three GIM explosive samples that were weathered and aged outdoor for two years showed a clear decrease of toxicity compared to fresh GIM. The latter was directly related to the lower content of TNT remaining in the aged samples.
RESUME
Afin de développer des armes moins nocives pour l’environnement, l’armée canadienne étudie présentement la possible utilisation de nouvelles formulations d’explosifs ou de charge propulsive. La présente étude répond ainsi aux besoins de RDDC, Valcartier, QC, et vise à produire des données physiques, chimiques et écotoxicologiques nécessaires pour prédire le sort et l’impact de nouvelles formulations développées dans le cadre du projet RIGHTTRAC (Revolutionary Insensitive, Green and Healthier Training Technology with Reduced Adverse Contamination). La présente étude résume la dissolution, le transport, la
transformation et l’écotoxicité de trois formulations de charge propulsive, SP 7993, SP Unique, et CMR170, ainsi que de leurs constituants, NG, DPA, ATEC, MC et EC. De plus, elle résume aussi l’écotoxicité d’une formulation d’explosifs, GIM, vieillie durant des périodes variant de 6 à 24 mois.
Parmi les trois formulations testées, SP 7993 s’est avérée être la plus stable en terme de dissolution, plus stable même que la formulation New Green M1 précédemment identifiée comme très stable. Si des particules de SP 7993 dispersées à la surface du sol sont sujettes à des précipitations elles devraient donner lieu à une dispersion minime d’ATEC. Ce dernier devrait rapidement disparaître étant donnée sa faible stabilité dans les sols.
Parmi les deux formulations à double-base, CMR170 est apparue moins soluble que SP Unique. Bien que l’enveloppe MC/graphite protégeant la formulation
CMR170 puisse être à l’origine de sa stabilité, ceci ne peut être affirmé car CMR170 contient plus de NC que SP Unique ce qui limite aussi la dissolution de ses
composés solubles. Si présentes dans l’environnement, CMR170 devrait donner lieu à une dispersion modérée de NG et MC tandis que SP Unique devrait donner lieu à une dispersion significative de NG et modérée de DPA. Etant données la stabilité et la grande mobilité de NG mesurées dans le sol Valcartier, la NG devrait demeurer très biodisponible dans de nombreux sols.
La présente évaluation écotoxicologique des formulations SP 7993, SP Unique, et CMR170 a permis de déterminer que la formulation SP 7993 était la moins toxique, que la formulation SP Unique était toxique pour les organismes aquatiques et terrestres testés, et que la formulation CMR170 était toxique pour les organismes terrestres seulement. La toxicité des formulations SP Unique et CMR170 peut être attribuée à la présence de nitroglycérine dans ces deux formulations.
La toxicité du GIM (Green Insensitive Munitions) vieilli climatiquement a été comparée à celle du GIM non vieilli. Les présents travaux montrent que la concentration de TNT mesurée dans un sol fortifié en GIM diminue au fur et à mesure du vieillissement. Cependant, après 6 mois de vieillissement, des tests de toxicité conduits sur des vers de terre et des plantes n’ont pas montré d’effet significatif, impliquant qu’un vieillissement plus long aurait été nécessaire pour discerner un effet. Des tests aquatiques (test Microtox et algues) réalisés avec des échantillons de GIM vieillis à l’extérieur durant 2 ans ont, eux, montré une nette diminution de toxicité expliquée par la concentration en TNT très inferieure dans les échantillons vieillis.
TABLE OF CONTENTS
ABSTRACT ...iv
RESUME ...vi
TABLE OF CONTENTS ... viii
LIST OF FIGURES ... xii
LIST OF TABLES ...xv
INTRODUCTION ... 1
PART I. ENVIRONMENTAL FATE OF PROPELLANT FORMULATIONS, SP 7993, SP UNIQUE, AND CMR170 ... 4
I. SOLUBILITY AND DISSOLUTION OF PROPELLANT FORMULATIONS ... 5
I.1. Materials and methods ... 5
I.1.1. Materials ... 5
I.1.2. Analytical methods ... 7
I.1.3. Aqueous solubility of individual components ... 8
I.1.4. Leaching from formulations in water batch ... 9
I.1.5. Leaching from formulations under constant water dripping... 9
I.2. Results and discussion ... 10
I.2.1. Aqueous solubility of components ... 10
I.2.2. Batch experiments for formulation dissolution ... 11
I.2.3. Dripping experiments ... 19
I.2.4. Conclusion ... 23
II. TRANSPORT OF FORMULATIONS SP 7993, SP UNIQUE, AND CMR170 AND THEIR INDIVIDUAL COMPONENTS IN SOIL ... 24
II.1. Experimental part ... 24
II.1.1. Materials ... 24
II.1.2. Kow measurements ... 25
II.1.3. Batch sorption experiments ... 25
II.2.1. Octanol-water partition coefficients (Kow’s) ... 26
II.2.2. Soil water partition coefficients (Kd’s) ... 27
II.2.3. Conclusion ... 29
III. FATE OF FORMULATIONS SP 7993, SP UNIQUE, CMR170 AND THEIR CONSTITUENTS ... 30
III.1. Fate of NG in soil and water ... 30
III.2. Fate of DPA in soil and water ... 31
III.3. Fate of ATEC in soil and water ... 33
III.4. Fate of MC and EC in soil and water ... 36
III. 5. Conclusion ... 37
IV. SUMMARY ON FATE AND TRANSPORT ... 38
V. REFERENCES ... 39
PART II. ECOTOXICOLOGICAL ASSESSMENT OF PROPELLANT FORMULATIONS, SP 7993, SP UNIQUE, AND CMR170 ... 43
I. Objectives of the ecotoxicological assessment ... 44
II. Material and Methods ... 44
II.1. Preparation of amended soil ... 44
II.2. Preparation of soil leachates ... 45
II.3. Analytical measurement of energetic materials in soil samples ... 46
II.3.1. Extraction of soil samples ... 46
II.3.2. Extraction of soil interstitial water ... 47
II.4. Toxicity tests ... 47
II.4.1. Microtox assay ... 47
II.4.2. Green algae inhibition assay ... 48
II.4.3. Terrestrial plant seedling emergence and growth inhibition test ... 48
II.4.4. Earthworm lethality test ... 49
II.4.5. Earthworm avoidance test ... 50
III. Analytical measurements of the energetic materials contained in the three selected propellant formulations ... 51
III.1. Soil-water equilibrium and bioavailability of SP 7993 formulation ... 52
III.3. Soil-water equilibrium and bioavailability of CMR170 formulation ... 60
III.4. Summary of the soil-water equilibrium and bioavailability equilibrium studies 65 III.5. Quantification of energetic materials contained in the SP 7993-amended soil used for the terrestrial plant growth and earthworm lethality tests ... 66
III.6. Quantification of energetic materials contained in the SP 7993-amended soil used for earthworm avoidance test ... 67
III.7. Quantification of energetic materials contained in the SP Unique-amended soil used for the terrestrial plant growth and earthworm lethality tests ... 68
III.8. Quantification of energetic materials contained in the SP Unique-amended soil used for earthworm avoidance test ... 70
III.9. Quantification of energetic materials contained in the CMR170-amended soil used for the terrestrial plant growth and earthworm lethality tests ... 71
III.10. Quantification of energetic materials contained in the CMR170-amended soil used for earthworm avoidance test ... 74
III.11. Quantification of energetic materials and pH measurements of the SP 7993, SP Unique and CMR170-amended soil leachates used for the Microtox and freshwater algae toxicity tests ... 75
IV. Toxic effects of the propellant Formulations ... 77
IV.1. Effects of formulation-amended soil leachates to Microtox ... 77
IV.2. Effects -amended soil leachates to freshwater algae ... 78
IV.3. Effects of formulation-amended soil to terrestrial plants ... 79
IV.4. Effects of amended soils to earthworm survival and avoidance behavior .. 80
V. Discussion of the ecotoxicological assessment results ... 82
VI. Conclusion of the ecotoxicological assessment ... 85
VII. References ... 86
PART III. Toxicological Evaluation of weathered and aged GIM ... 88
INTRODUCTION ... 89
I. Weathering-aging of GIM in soil ... 89
I.1. Materials and methods ... 89
II. Effects of weathered-and-aged GIM-amended soil on earthworms ... 94
II.1. Materials and methods ... 94
II.2. Results and discussion ... 94
III. Effects of weathered-and-aged GIM-amended soil on ryegrass (Lolium perenne) 96 III.1. Material and methods ... 96
III.2. Results ... 96
IV. Toxicity of 2-year weathered GIM Formulation ... 98
IV.1. Materials and methods ... 98
IV.1.1. Microtox assay ... 99
IV.1.2. 96h-Algal growth inhibition assay ... 99
IV.1.3. Statistical analyses ... 99
IV.2. Results ... 100
V. Conclusions ... 102
VI. Acknowledgements ... 102
VII. References ... 103
LIST OF FIGURES
Figure 1. Micrograph of the three propellant formulations. ... 6
Figure 2. Leaching of ATEC from SP 7993 as a function of temperature ... 12
Figure 3. Leaching of EC from SP 7993 as a function of temperature ... 13
Figure 4. Leaching of NG from SP Unique as a function of temperature ... 15
Figure 5. Leaching of DPA from SP Unique as a function of temperature ... 15
Figure 6. Leaching of EC from SP Unique as a function of temperature ... 15
Figure 7. Leaching of NG from CMR 170 as a function of temperature ... 17
Figure 8. Leaching of MC from CMR 170 as a function of temperature ... 18
Figure 9. Leaching of EC from CMR 170 as a function of temperature ... 18
Figure 10. .Concentrations of ATEC and EC in the eluates of SP 7993 (35.6 mg) (T = 22°C; water flow: 0.5 mL min-1)... 20
Figure 11. Microscopic photographs of a piece of SP 7993 non-exposed (left) and exposed (right) to a water dripping flow ... 20
Figure 12. Concentrations of NG, DPA, and EC in the eluates of SP Unique (1.46 mg) (T = 22°C; water flow: 0.5 mL min-1) ... 21
Figure 13. Microscopic photographs of a piece of SP Unique non-exposed (left) and exposed (right) to a water dripping flow ... 22
Figure 14. Microscopic photographs of a piece of CMR170 non-exposed (left) and exposed (right) to a water dripping flow ... 23
Figure 15. Chemical formulae of hydrosoluble components of formulations ... 26
Figure 16. Correlation between Kow’s and Kd(DRDC-09)’s ... 28
Figure 17. Fate and distribution of DPA in (left) non-sterile and (right) sterile DRDC-09 soil suspensions (Initial concentration of DPA: 20 mg L-1) ... 32
Figure 18. HPLC-UV=213nm peak area of ATEC and products in aqueous solutions (left: pH 6.75; right: pH 8.3)... 34
Figure 19. left: Fate and distribution of ATEC in non-sterile DRDC-09 soil suspensions (Initial concentration of ATEC: 5 mg L-1); right: HPLC-UV=213nm peak area of ATEC and products in soil supernatant ... 35
Figure 20. Fate and distribution of MC in non-sterile DRDC-09 soil suspensions (Initial concentration of MC: 56 mg L-1) ... 36 Figure 21. Fate and distribution of EC in non-sterile (left) DRDC-09 soil or (right)
suspensions (Initial concentration of MC: 56 mg L-1; EC: 39 mg L-1) ... 37 Figure 22. Recovery of ATEC during the SP 7993 equilibrium study using acetonitrile
extraction (n = 3). ... 52 Figure 23. Recovery of ethyl centralite (EC) during the SP 7993 equilibrium study
using acetonitrile extraction (n = 3). ... 53 Figure 24. ATEC concentrations measured in the interstitial water during the
equilibrium study of the SP 7993 formulation in soil (n = 3). ... 54 Figure 25. EC concentrations measured in the interstitial water during the
equilibrium study of the SP 7993 formulation in soil (n = 3). ... 55 Figure 26. Recovery of nitroglycerin (NG) during the SP Unique equilibrium study
using acetonitrile extraction (n =3). ... 56 Figure 27. Recovery of ethyl centralite (EC) during the SP Unique equilibrium study
using acetonitrile extraction (n=3). ... 57 Figure 28. Recovery of diphenylamine (DPA) during the SP Unique equilibrium
study using acetonitrile extraction (n=3). ... 57 Figure 29. NG concentrations measured in the interstitial water during the
equilibrium study of the SP Unique formulation in soil (n =3). ... 58 Figure 30. EC concentrations measured in the interstitial water during the
equilibrium study of the SP Unique formulation in soil (n=3). ... 59 Figure 31. DPA concentrations measured in the interstitial water during the
equilibrium study of the SP Unique formulation in soil (n=3). ... 59 Figure 32. Recovery of nitroglycerin (NG) during the CMR170 equilibrium study
using acetonitrile extraction (n = 3). ... 61 Figure 33. Recovery of ethyl centralite (EC) during the CMR170 equilibrium study
using acetonitrile extraction (n = 3). ... 61 Figure 34. Recovery of methyl centralite (MC) during the CMR170 equilibrium study using acetonitrile extraction (n = 3). ... 62
Figure 35. NG concentrations measured in the interstitial water during the
equilibrium study of the CMR170 formulation in soil (n = 3). ... 63 Figure 36. EC concentrations measured in the interstitial water during the
equilibrium study of the CMR170 formulation in soil (n = 3). ... 64 Figure 37. MC concentrations measured in the interstitial water during the
equilibrium study of the CMR170 formulation in soil (n = 3). ... 64 Figure 38. HMX (A) and TNT (B) found in GIM-amended DRDC-09 soil during the
24 weeks of W-A (Nominal concentrations are indicated in Fig. legends) ... 92 Figure 39. Ryegrass plant biomass after 19-d growth in GIM-amended soil W-A for
24 weeks... 97 Figure 40. Photograph of the 2-year aged GIM sample after hand mixing ... 98
LIST OF TABLES
Table 1. Composition of RIGHTTRAC TDP explosive and propellant formulations
studied at NRC-Montreal over the years 2008-2012 ... 2
Table 2. Composition of the three propellant formulations as provided by DRDC and measured at NRC-Montreal ... 7
Table 3. Aqueous solubility of soluble components of formulations measured at 25 C ... 10
Table 4. Cumulative amounts of ATEC and EC released from SP 7993 (~500 mg) into water (1 100 mL; 1 50 mL) after the second run ... 13
Table 5. Cumulative amounts of NG, DPA and EC released from SP Unique (~500 mg) into water (2 50 mL) after the second run ... 16
Table 6. Cumulative amounts of NG, MC and EC released from CMR170 (~500 mg) into water (2 50 mL) after the second run ... 18
Table 7. Physico-chemical properties of DRDC soils ... 24
Table 8. Measured Kow’s of soluble components of SP 7993, SP Unique and CMR170 ... 27
Table 9. Measured Kd’s and log Koc for soluble components of SP 7993, SP Unique, and CMR170 ... 29
Table 10. Measured degradation rates and products for NG ... 31
Table 11. Degradation rates and products for DPA ... 33
Table 12. Degradation rates and products of ATEC ... 35
Table 13.Selected physico-chemical properties of DRDC2010 control soil ... 45
Table 14. Summary of the equilibrium study of the different explosive formulations in soil and sediment samples... 65
Table 15. Chemical determinations of total extractable ATEC and EC from the SP 7993-amended soil in the soil samples measured at the beginning of the terrestrial plant growth and earthworm lethality tests (acetonitrile extraction). .. 67
Table 16. Chemical determinations of water soluble EC from the SP 7993-amended soil in the soil samples measured at the beginning of the terrestrial plant growth and earthworm lethality tests (extraction of interstitial water)... 67 Table 17. Chemical determinations of total extractable ATEC and EC from the SP
7993-amended soil in the soil samples measured at the beginning at the
beginning of the earthworm avoidance test (acetonitrile extraction). ... 68 Table 18. Chemical determinations of total extractable NG, EC, and DPA from the
SP Unique-amended soil in the soil samples measured at the beginning of the terrestrial plant growth and earthworm lethality tests (acetonitrile extraction). .. 69 Table 19. Chemical determinations of water soluble NG, EC, and DPA from the SP
Unique-amended soil in the soil samples measured at the beginning of the terrestrial plant growth and earthworm lethality tests (extraction of interstitial water). ... 70 Table 20. Chemical determinations of total extractable NG, EC and DPA from the
SP Unique-amended soil in the soil samples measured at the beginning at the beginning of the earthworm avoidance test acetonitrile extraction). ... 71 Table 21. Chemical determinations of total extractable NG, EC, and MC from the
CMR170-amended soil in the soil samples measured at the beginning of the terrestrial plant growth and earthworm lethality tests (acetonitrile extraction). .. 72 Table 22. Chemical determinations of total extractable NG, EC, and MC from the
CMR170-amended soil in the soil samples measured at the end of the terrestrial plant growth test (acetonitrile extraction). ... 73 Table 23. Chemical determinations of water soluble NG, EC, and MC from the
CMR170-amended soil in the soil samples measured at the beginning of the terrestrial plant growth test (extraction of interstitial water). ... 73 Table 24. Chemical determinations of water soluble NG, EC, and MC from the
CMR170-amended soil in the soil samples measured at the end of the terrestrial plant growth test (extraction of interstitial water). ... 74 Table 25. Chemical determinations of total extractable NG, EC, and MC from the
CMR170-amended soil in the soil samples measured at the beginning at the beginning of the earthworm avoidance test (acetonitrile extraction). ... 75
Table 26. Summary of the physico-chemical characteristics of the different
formulation amended soil leachates. ... 76 Table 27. Summary of toxicity responses of the different propellant amended soil
leachates to V. fischeri. ... 77 Table 28. Summary of toxicity responses of the different propellant amended soil
leachates to P. subcapitata ... 78 Table 29. Effects of SP 7993, SP Unique, and CMR170 formulations amended soil
on ryegrass seedling emergence and growth. ... 79 Table 30. Effects of SP 7993, SP Unique, and CMR170 formulations amended soil
on earthworm avoidance behavior and survival. ... 81 Table 31. Summary of the toxic effects of the different formulations on different
organisms ... 84 Table 32. Initial HMX and TNT measured in GIM-amended DRDC-09 soil before
starting the W-A procedure ... 91 Table 33. TNT transformation products recovered in DRDC-09 soil over the 24
weeks of W-A ... 93 Table 34. TNT, HMX, and TNT transformation products recovered from DRDC-09
soil prior to the toxicity assays (24-week aging) ... 93 Table 35. Summary of lethality endpoints for earthworms exposed to
freshly-amended or W-A GIM in soil samples ... 95 Table 36. Effect of GIM-amended soil (fresh or W-A) on ryegrass ... 97 Table 37. HMX and TNT recovered from GIM samples weathered for 2 years and
dissolved in acetonitrile or water over 7 d ... 100 Table 38. Aqueous toxicity of a 2-year aged GIM samples using bacteria ... 101 Table 39. Aqueous toxicity of a 2-year W-A GIM sample using freshwater green
INTRODUCTION
As part of a sustainable training of the Canadian Army, Defence Research and Development Canada (DRDC, Valcartier, QC) is developing new green explosive and propellant formulations. The newly developed formulations have to be tested for their safety, ballistic performance, as well as their environmental fate and impact. For most of the parameters tested, the new formulations must compare favourably to traditionally used munitions. The present research thus responds to the needs of DRDC by providing necessary physicochemical, chemical, and ecotoxicological data to help predict the environmental transport, fate and impact of new formulations.
During the years 2008-2012, NRC-Montreal has studied the fate and impact of numerous explosive and propellant formulations, the compositions of which are provided in Table 1 (top part for explosives; bottom part for propellants) (Hawari et al., annual reports 2009, 2010, 2011 & 2012). It was concluded from these studies that the presence of large content of nitrocellulose (NC) in propellant formulations decreases considerably the leakage of soluble components out of solid formulations, therefore decreasing the risk of contamination at firing sites. Based on this result, DRDC decided to investigate the fate of three new small arm propellant formulations containing large amounts of NC. One of the formulations, SP Unique, contains NC and triethyl-2-acetylcitrate (ATEC); the two other formulations, SP 7993 and
CMR170, contain NC and nitroglycerin (NG), processed in a different way. While formulation SP Unique results from a bulk preparation with nitrocellulose and rosin serving as binders, CRM170 was prepared in two steps where a bulk formulation of NC, NG, and EC, was covered with a MC/graphite coating.
In a previous study aimed at investigating the environmental fate and impact of the new explosive formulation, GIM, we concluded that the latter was toxic to most tested aquatic and terrestrial receptors likely due to the leakage of TNT out of GIM solid particles (Hawari et al., 2009 & 2011). However, TNT, like other nitroaromatics, is known to transform in soil into amino-derivatives that can bind covalently and irreversibly to soil organic matter or polymerize oxidatively into insoluble azo and
hydrazo-oligomers (Thorn et al., 2002a, 2002b, 2008; Yang et al., 2008). The resulting products normally exhibit less toxicity than the original nitro compounds due to their unavailability in soil. In a separate request, DRDC therefore asked the NRC to investigate the toxicity of GIM after aging the latter in soil for several months.
The present report is thus constituted of three separate parts. Part I summarizes the results on the transport and fate of the three new small arm propellant
formulations (SP unique, SP 7993, CMR170), by providing data on dissolution, sorption, and degradation of the whole formulations as well as the individual
components, if not previously studied. Results are compared to those obtained with the most similar formulation we previously studied, i.e. New Green M1. Part II summarizes the environmental impact of the same three propellant formulations by providing data on the toxicity of the formulations to aquatic and terrestrial receptors. Finally, part III summarizes the toxicity of aged GIM to various aqueous and
terrestrial receptors.
Table 1. Composition of RIGHTTRAC TDP explosive and propellant formulations studied at NRC-Montreal over the years 2008-2012
Formulation Ingredient Provided
composition (% w/w) Composition measured at BRI (% w/w) (n = 3) Composition B RDX 60 48.3 0.7 (Explosive TNT 40 40.4 1.0 Reference) HMX 0 12.0 0.3
GIM (XRT) ETPE 9.5 7.8 (by difference)
HMX 51.3 51.5
TNT 39.2 40.7
CX-85 (PBX) HTPB-TDI 10.37 Non measured
DOA 5.58 5.58 0.07
Lecithin 0.08 Non measured
HDHA 0.08 Non measured
Dantocol 0.15 Non measured
M1 NC 83.3 Non measured
(Propellant 2,4-DNT 10.7 10.1 0.2
Reference) DBP 5 5.70 0.08
DPA 1 0.94 0.03
Helova ETPE 8.9 Non measured
NC, Type 1, Gr A 14.8 Non measured
TEGDN 6.9 8.8 0.2
HMX 67.8 70.9 0.9
TPA 0.4 0.37 0.04
CAB 0 Non measured
Green M1 NC, Type 1, Gr C 68.9 Non measured
TEGDN 29.9 34.3 0.9
AK 1.0 0.93 0.03
Carbon black 0.2 Non measured
Triple base NC 50.9 Non measured
TEGDN 23.9 28.2 0.3
NQ 24.0 25.5 0.3
TPA 1.2 1.46 0.12
Carbon black 0.1 Non measured
New Green M1 NC, grade C 91.85 Non measured
ATEC 7.15 7.16 0.06
AK 1.00 0.86 0.04
MC (Added:4.30) 3.95 0.08
Abbreviations: AK: Akardite II; ATEC: Acetyltriethylacetate; DBP: Dibutylphthalate; 2,4-DNT: 2,4-Dinitrotoluene; DOA: Dioctyladipate; DPA: Diphenylamine; ETPE: Energetic
thermoplastic elastomer; HDHA: Hydroxy-6 dimethyl-N,N hexamide; HMX: Octahydro-1,3,5,7-tetranitro-1,3,5,7-tetrazocine; HTPB-TDI: Hydroxy-terminated polybutadiene and toluene di-isocyanate (= polyurethane); MC: Methyl centralite; NC: Nitrocellulose; TNT: 2,4,6-Trinitrotoluene.
PART I. ENVIRONMENTAL FATE OF PROPELLANT
FORMULATIONS, SP 7993, SP UNIQUE, AND CMR170
I. SOLUBILITY AND DISSOLUTION OF PROPELLANT
FORMULATIONS
Dissolution of formulations by precipitation is the departure point and one of the controlling factors for the transport, fate, and impact of their components (Morley et al., 2006; Furey et al., 2008). Several studies suggested that the dissolution rate of individual explosives was decreased when confined in formulations compared to the pure explosives (Lynch et al., 2002; Phelan et al., 2002; Lever et al., 2005; Taylor et al., 2009; Monteil-Rivera et al., 2010). More recently, we and others demonstrated that dissolution rates of components of propellant formulations were strongly
affected by the presence of NC (Dontsova, et al., 2009; Taylor et al., 2011; Hawari et al., 2012; Taylor et al., 2012). In the present section, we will therefore determine the dissolution ability of the three new formulations of interest (SP 7993, SP unique, CMR170). The aqueous solubility of components that have not been studied earlier will be first determined and the propensity of all soluble components to migrate out of the solid formulations upon contact with water will be then assessed in batch or dripping experiments.
I.1. Materials and methods I.1.1. Materials
The three formulations (SP 7993, SP unique, CMR170) were provided by DRDC in their original form as well as in powder if the size of particles was too large to allow homogeneous spiking in soil. Original SP 7993 particles appeared as greenish cylinders (2.5 mm 5 mm), SP unique particles appeared as thin anthracite disks (1.6 mm 0.5 mm ) and CRM170 appeared as very tiny anthracite cylinders (0.81 mm 0.85 mm) (Fig. 1). SP 7993 was grinded into powder to allow a better
homogeneity in the ecotoxicology and dissolution tests; the two other formulations were used as received. The chemical composition of each formulation was
measured at NRC-Montreal by dissolving ~40 mg (precisely weighted) in acetonitrile (100 mL), sonicating for 15 min, stirring for 1 h at room temperature (250 rpm), and analyzing the supernatant by high performance liquid chromatography (HPLC) as described below. Results are summarized in Table 2 together with the theoretical compositions provided by DRDC. Concentrations measured at NRC-Montreal agreed well with the provided values; the more precise values measured in-house were the ones used in the environmental and ecotoxicological studies described later in this report.
In these formulations, nitrocellulose (NC) serves as an energetic binder, nitroglycerin (NG) as an energetic plasticizer, acetyltriethylcitrate (ATEC) as a plasticizer, carbon as an opacifier, K2SO4 as a visible flame suppressant, and diphenyl amine (DPA), methyl centralite (MC) and ethyl centralite (EC), as stabilizers.
Some of the organic hydrosoluble components were obtained to develop analytical tools and/or to determine their environmental fate. ATEC (colorless oily liquid, 99 %), EC (greyish solid, 99 %), and DPA (white solid, 99%) were purchased from Sigma-Aldrich (Oakville, ON). MC (white solid) was provided by Defence Research and Development Canada (Valcartier, QC). NG was purchased from Cerilliant Corporation (Round Rock, TX) as a solution in acetonitrile (1000 ppm).
Figure 1. Micrograph of the three propellant formulations. From left to right: SP 7993, SP Unique, and CRM170
Table 2. Composition of the three propellant formulations as provided by DRDC and measured at NRC-Montreal
Formulation Ingredient Provided
composition (% w/w) Composition measured at BRI (% w/w) (n = 3) SP 7993 NC 89.5 Non measured (89.6) ATEC 8.00 8.0 0.6 EC 1.50 1.39 0.03 K2SO4 1.00 Non measured
Graphite < 0.15 Non measured
SP Unique NC & Rosin 58-96 Non measured (78.6)
NG 4-40 20.6 0.2 EC 0-1 0.20 0.01 DPA 0-1 0.63 0.01 CRM170 NC 86.3 Non measured (~89.4) NG 8.62 7.5 0.2 EC 0.97 0.93 0.02 K2SO4 1.55 Non measured
Carbon black 0.14 Non measured
MC (coating) 1.95 2.09 0.05
Graphite (coating) 0.49 Non measured
Abbreviations: ATEC: Acetyltriethylacetate; DPA: Diphenyl amine; EC: Ethyl centralite; MC: Methyl centralite; NC: Nitrocellulose; NG: Nitroglycerin.
I.1.2. Analytical methods
NG, ATEC, EC, and MC were analyzed in acetontrile/H2O (50/50; v/v) solutions by reverse phase high performance liquid chromatography (HPLC)-UV. The system consisted of a W600 pump (Waters, Milford, MA, USA), a 717 plus autosampler, and a 2996 Photodiode-Array Detector. Samples (50 µL) were separated with a
Discovery C18 column (25 cm 4.6 mm 56 m) (Supelco, Oakville, ON), at 35C. A water methanol gradient was run at 1 mL min-1. The initial solvent composition was 50 % methanol/ water, which was held for 18 min. A linear gradient was run from 50% to 90% methanol over 2 min. This solvent ratio was held for 8 min and then changed to the initial conditions over 2 min. The initial conditions were held for an extra 15 min for a total run of 45 min. The detector was set to scan from 192 to 450 nm. Detection limits were estimated at 0.005 mg L-1 for DPA at 284 nm, 2.5 mg L-1
for ATEC at 213 nm, 0.005 mg L-1 for MC at 242 nm, and 0.005 mg L-1 for EC at 246 nm.
Given the low sensitivity of the HPLC-UV method for ATEC, the latter was quantified at low concentration by LC-MS using a mass spectrometer (MS, Bruker MicroTOFQ mass analyzer) attached to an HPLC system (Hewlett Packard 1200 Series) equipped with a DAD detector. Aliquots (10 L) were injected into a 3.5 micron-pore size Zorbax SB-C18 column (2.1 mm ID 150 mm; Agilent,
Mississauga, Canada) at 25C. The solvent system was composed of 70% of CH3OH in H2O at a flow rate of 0.2 mL min-1. For mass analysis, positive
electrospray ionization mode (ES+) was used. Mass range was set from 40 to 1000 Da. ATEC was detected as sodium adduct ions (M+Na)+ at m/z 341.1 ± 0.05. Quantification was done using external standard. Detection limit was estimated at 1 g L-1. Transformation products of ATEC were also identified using this method but with a mobile phase consisting of 60% MeOH in water to ensure a better separation.
DPA transformation products were analyzed using a Bruker Esquire3000Plus ion trap mass analyzer attached to a HPLC system (Hewlett Packard 1100 Series) equipped with a diode array detector. The samples were injected into a 5 micron-pore size Zorbax SB-C18 capillary column (0.5 mm ID 150 mm; Agilent,
Mississauga, Canada) at 30 C. The solvent system was composed of a CH3CN/H2O gradient (50 to 90% v/v) at a flow rate of 12 L min-1. For mass analysis, positive electrospray ionization (ES+) was used to produce protonated molecules [M+H]+. The mass range was scanned from m/z 40 to 1000. Auto MS/MS mode was set to fragment an unknown compound detected at m/z 337.
I.1.3. Aqueous solubility of individual components
EC was the only chemical for which we had not measured previously the aqueous solubility. Aqueous solubility of EC was therefore measured at 25ºC by suspending 0.1 g of the chemical in 10 mL of deionized water. The samples were stirred at 25ºC. At days 8, 15 and 50, aliquots ( 1 mL) of the mixture was filtered, diluted 1:1 in
value was stable between two successive measurements. Measurements were done in triplicate.
I.1.4. Leaching from formulations in water batch
Batch experiments were conducted to determine the aqueous concentrations of each component if the propellant formulations are equilibrated with an aqueous or wet medium like in ecotoxicity tests. The formulation powder (SP7973) or small particles (SP Unique and CRM170) were stirred for long times in water batches and water was changed after reaching sequential equilibriae. For all formulations, batch experiments were conducted in water at temperatures of (10.0 ± 1), (25.0 ± 1), and (30.0 ± 1) C. A mass (10 or 500 mg) of formulation was added to 100 or 50 mL of pre-thermostated deionized water (pH 5.5) in a glass bottle. The capped samples were shaken (at 150 rpm) in a thermostated incubator protected from light. At various time intervals, aliquots (1.5 mL) of suspension were withdrawn, filtered through a Millex-HV 0.45 μm syringe filter, diluted (1:1 v/v) in acetonitrile, and analyzed for DPA, MC, EC, or NG by HPLC and for ATEC by LC-MS. Once the dissolved amounts of components reached equilibrium, the solid was isolated from supernatant and stirred again with a fresh batch of deionized water (100 or 50 mL) in order to determine the maximal potential of each component to dissolve. All
experiments were done in duplicate.
I.1.5. Leaching from formulations under constant water dripping
In order to evaluate the ability of the three propellant formulations to leach under a rain event, experiments were set up where a particle of SP7993 (cylinder of 2.6 mm diameter and 4.9 mm height; 36.5 mg), SP unique (disk of 1.6 mm diameter and 0.5 mm thickness; 1.35 mg) or CRM170 (cylinder of 0.81 mm diameter and 0.85 mm height; 0.90 mg) was deposited on a glass funnel fitted with a nylon mesh and
exposed to a continuous flow of water maintained with an HPLC pump at a rate of 0.5 mL min-1 corresponding to ~ 19 drops per min. Outflow samples were collected in glass flasks covered with aluminum foil and flasks were changed after increasing
intervals (from 1 h to 1 week). Each water fraction was analyzed for ATEC and EC for SP7993, NG, EC, and DPA for SP Unique, and NG, EC, and MC for CRM170.
I.2. Results and discussion
I.2.1. Aqueous solubility of components
Since ATEC, DPA, and MC were present in some of the formulations that we studied between 2010 and 2012 (see Table 1), their aqueous solubility had been previously measured (Hawari et al., 2012). As for NG several fairly coherent values of aqueous solubility were found in the literature (Mirecki et al., 2006). Thus, we only measured the aqueous solubility of EC in this study. Previous and present results of aqueous solubility are all gathered in Table 3 along with literature data, when available.
Table 3. Aqueous solubility of soluble components of formulations measured at 25 C
Compound Meas. Solubility (mg L-1) / 25C Reported solubility (mg L-1) (ref.)
NG Non measured 1,950 (Mirecki et al., 2006)
ATEC 3,296 41 688.2 (Chemspider, 2013)
MC 89.0 0.4 Insoluble (Mirecki et al., 2006)
DPA 38.7 0.4 39; 35-45 (Schetter, 1993,
(Drzyzga, 2003)
EC 44.6 0.7 80.0 (Mirecki et al., 2006)
NG is known to be reasonably soluble in water, with an aqueous solubility reported to range between 1,380 and 1,950 mg L-1 between 20 and 25C mg L-1. No data could be found in the literature on the solubility of ATEC but MSDS data available on the internet from several suppliers indicate a value of 7.2 g L-1 at 25C and
theoretical value predicted from the log Kow using software WSKOW v1.41 of the EPIsuite (Chemspider 2013) led to 0.7 g L-1. The value we measured (3,296 mg L-1) was between these two values. MC aqueous solubility was reported in an
the quality of the reported data was claimed to be equivocal by Mericki et al. (2006). We measured the aqueous solubility of MC at 25C and found a value of 89.0 0.4 mg L-1. DPA aqueous solubility was measured at 25ºC and found to be 38.7 0.4 mg L-1, in perfect agreement with the value of 39 mg L-1 published by the Food and Agricultural Organization of United Nations (Schetter, 1993) or the value range of 35-45 mg L-1 reported by Drzyzga for various temperatures (2003). Finally,
measurement of EC aqueous solubility led to a value (44.6 0.7 mg L-1) inferior to the value published in the Encyclopedia of Explosives and Related Items (USA-ARDEC, 1983) but logical compared to the solubility of MC.
According to these measurements, the aqueous solubility of each of the soluble components of the three formulations follows the order:
ATEC > NG > MC > DPA > EC.
I.2.2. Batch experiments for formulation dissolution
Leaching experiments were conducted to determine the amount of individual
components that would leak from the propellant formulations if contacted with water. Powders were stirred for long times in water batches and water was changed after reaching sequential equilibriae.
SP 7993. Leaching of ATEC and EC from SP 7993 powder was first monitored
under the conditions used at NRC for other formulations, i.e. 10 mg of formulation in 100 mL H2O. Very low levels of EC (< 6 ppb) and ATEC (< 70 ppb) were detected in the first aqueous phase after two months of experiment while no chemical was detected after replacing the water with fresh water (2nd run).
A second experiment was then set up with a larger concentration of formulation (500 mg / 100 or 50 mL). The resulting leaching of ATEC and EC is shown in Figures 1 and 2 for two successive runs.
Despite the non-negligible aqueous solubilities of ATEC and EC at 25C (3,296 and 45 mg L-1, respectively) the maximum concentration of both chemicals remained largely inferior to these values (Fig. 2 & 3). During the first run, ATEC and EC were
released at a faster rate than in the second run suggesting that a continued contact with water would induce a decreasing release of chemicals in water.
The corresponding cumulative dissolved fractions of ATEC and EC are reported in Table 4. Although the releases were increased by increasing the temperature, less than 1.8% of ATEC and 0.2% of EC were released after 6 months at 30C. Data thus show that very small proportions of initial amounts of ATEC or EC could be extracted from SP 7993 after several months of stirring in water. The losses measured correspond to low absolute masses of ATEC (0.75 mg at 30C) or EC (0.07 mg at 30C) thus suggesting that exposure of chunks of SP 7993 formulation to water in the environment would probably lead to extremely low levels of
contamination. The nitrocellulose was probably responsible for the limited release of ATEC and EC. It might have swollen in water and blocked the inner pores of the matrix thus reducing the diffusion of the chemicals or acted as a potential adsorbent for the soluble components.
For comparison, when similar experiments were conducted with particles of New Green M1 (see Table 1 for composition) (Hawari et al., 2012), the release of
components from these formulations was also found to be limited by processes other than pure dissolution and the extent of dissolution for ATEC (1.9% at 30C) and MC (7% at 30C) was slightly higher than the findings obtained with SP 7993.
0.0 1.0 2.0 3.0 4.0 5.0 0 20 40 60 80 100 A TE C dis s olv e d (m g/L ) Time (d) 10ºC 25ºC 30ºC 1st run 0.00 1.00 2.00 3.00 4.00 5.00 0 10 20 30 40 50 60 70 80 A TEC dis s olv e d (mg/L) Time (d) 10ºC 25ºC 30ºC 2nd run
Figure 2. Leaching of ATEC from SP 7993 as a function of temperature (SP 7993: 5,000 ppm in 1st run; 10,000 ppm in 2nd run)
0.0 0.1 0.2 0.3 0.4 0 20 40 60 80 100 E C dis s olv e d (mg/L) Time (d) 10ºC 25ºC 30ºC 1st run 0.00 0.05 0.10 0.15 0.20 0.25 0.30 0.35 0.40 0 10 20 30 40 50 60 70 80 E C di s s ol v e d (m g/ L) Time (d) 10ºC 25ºC 30ºC 2nd run
Figure 3. Leaching of EC from SP 7993 as a function of temperature (SP 7993: 5,000 ppm in 1st run; 10,000 ppm in 2nd run)
Table 4. Cumulative amounts of ATEC and EC released from SP 7993 (~500 mg) into water (1 100 mL; 1 50 mL) after the second run
ATEC from SP 7993 EC from SP 7993
10°C 25°C 30°C 10°C 25°C 30°C g % of initial chemical 401 1.00 514 1.29 714 1.79 33 0.08 51 0.13 67 0.17
SP Unique. SP Unique small particles were stirred in water at the same three
temperatures (10, 25, and 30C), and the release of NG, DPA, and EC was
monitored over time (Fig. 4-6). Dissolution of the three chemicals was much faster than with SP 7993, and plateaus were reached after only one week of stirring. Although inferior to NG aqueous solubility, the concentration of NG in water reached high values, i.e. 450 and 500 mg L-1 at 25 and 30C, respectively. After one month, the supernatant was replaced by fresh deionized water, and the dissolution
continued to occur at a fast pace, with new plateaus being reached after only 2 to 3 weeks.
The dissolution curves are consistent with a very fast release of all chemicals followed by quasi-nil release. Changing the water induced a similar fast dissolution followed again by an absence of dissolution in the second phase of the run. The existence of plateaus could be explained by: 1/ reached solubility maxima; 2/ a physical change of the NC matrix which would hamper further diffusion of chemicals
from the core of the solid to the outer layers of the solid; 3/ reached sorption equilibriae. The aqueous concentrations of the three chemicals always remained markedly lower than the aqueous solubility thus ruling out the aqueous solubility as an explanation for the plateaus. SP Unique particles have not been dried before changing the water. Therefore, if physical changes were responsible for the absence of diffusion, they would still be effective at the beginning of the second run and would not allow additional release of chemicals in fresh water. Sorption/desorption processes thus seem to play an important role in the release of chemicals from SP Unique. Kd values calculated for NG at the three temperatures were found to increase from the 1st to the 2nd runs (Fig.4), which is not consistent with a pure reversible sorption process. The increasing Kd values could be due to some irreversible sorption or some hampered dissolution from the core of the particle. It thus seems that the release of chemicals from SP Unique is governed by sorption processes on the formulation itself, but it is not clear whether sorption is partially irreversible or combined with hampered dissolution/diffusion. The presence of rosin with NC might be the cause of the faster diffusion observed compared to other propellant formulations made of pure NC. It might also be responsible for the presence of sorption sites.
At the end of the second run, the experiment was stopped. The total amount of NG, DPA and EC dissolved at 30, 25 and 10C are reported in Table 5. The present findings show that large amounts of NG were released from formulation SP Unique. It can thus be concluded that significant amounts of NG will leach out of SP Unique particles if the latter are scattered onto the soil surface and contacted with water in the field. In addition, NG leaking will occur within few days. DPA and EC which represent only 0.63 and 0.20% of the initial formulation mass will be present in water at very low or non-detectable levels.
SP Unique is therefore less stable than SP 7993. Given the observed important leaching of NG, the environmental impact of SP Unique formulation will be largely governed by the environmental impact of NG.
0 100 200 300 400 500 600 0 5 10 15 20 25 30 N G d isso lv ed (mg /L ) Time (d) 10ºC 25ºC 30ºC 1st run 0 50 100 150 200 250 300 350 400 0 5 10 15 20 25 NG d isso lv ed (mg/L) Time (d) 10ºC 25ºC 30ºC 2nd run
Figure 4. Leaching of NG from SP Unique as a function of temperature (SP Unique: 10,000 ppm in each run)
0.0 0.5 1.0 1.5 2.0 0 5 10 15 20 25 30 D P A d isso lv ed (mg /L ) Time (d) 10ºC 25ºC 30ºC 1st run 0.0 0.2 0.4 0.6 0.8 1.0 1.2 1.4 1.6 1.8 2.0 0 5 10 15 20 25 D P A d isso lv ed (mg /L ) Time (d) 10ºC 25ºC 30ºC 2nd run
Figure 5. Leaching of DPA from SP Unique as a function of temperature (SP Unique: 10,000 ppm in each run)
0.0 0.1 0.2 0.3 0.4 0.5 0 5 10 15 20 25 30 EC d isso lv ed (mg /L ) Time (d) 10ºC 25ºC 30ºC 1st run 0.00 0.05 0.10 0.15 0.20 0.25 0 2 4 6 8 10 12 14 16 18 20 22 24 EC d isso lv ed (mg /L ) Time (d) 10ºC 25ºC 30ºC 2nd run
Figure 6. Leaching of EC from SP Unique as a function of temperature (SP Unique: 10,000 ppm in each run)
Kd (30C) = 396 K d (30C) = 535 Kd (25C) = 461 K d (25C) = 636 Kd (10C) = 734 K d (10C) = 1097
Table 5. Cumulative amounts of NG, DPA and EC released from SP Unique (~500 mg) into water (2 50 mL) after the second run
NG from SP Unique DPA from SP Unique EC from SP Unique
10°C 25°C 30°C 10°C 25°C 30°C 10°C 25°C 30°C mg % 23.84 23.02 35.07 33.87 38.46 37.03 0.099 3.13 0.182 5.77 0.215 6.79 0.021 2.08 0.037 3.70 0.044 4.38
CMR 170. CMR170 small particles were stirred in water at the same three
temperatures (10, 25, and 30C), and the release of NG, MC, and EC was monitored over time (Fig. 7-9). Although CMR170, like SP Unique, contains NC, NG and EC, dissolution of NG and EC in water occurred at a much lower rate than it did from SP Unique and plateaus were not reached even after 4 months of stirring. The shape of the curves were indicative of an initial fast (though slower than for SP Unique) release of chemicals followed by a much slower release where diffusion from the core to the outside of the particles seemed to be a limiting factor. Recently, Taylor et al. (2012) reported in a study on the evaluation of the dissolution rate of propellant energetics from NC-based propellant formulations that NG had a fast initial
dissolution followed by slower mass loss, and that the amount of NG dissolved was a function of the NG/NC ratio in the propellant. Unfortunately, in addition to having been prepared differently, formulations SP Unique and CMR170 had different NG/NC ratios (0.26 and 0.10, respectively), which made more complex the direct comparison of the manufacturing processes. According to the observation made by Taylor et al. (2012), it is expected that SP Unique, with its lower content of NC, releases higher amounts of NG in water.
After four months, the supernatant was replaced by fresh deionized water, and the dissolution continued to occur at a slower rate than in the 1st run (1st run rate/2), as expected with a diffusion process.
25, and 30C after a total of almost 5 months are reported in Table 6. NG was again the chemical that was released in larger amounts from CMR170 but the masses of released NG were around 10 times less than the masses released from SP unique. Small amounts of NG will thus leach out of CMR 170 particles if the latter are
contacted with water in the field. MC and EC which represent only 2.09 and 0.93% of the initial formulation mass will be present in water at low or non-detectable levels.
The present findings indicate that CMR 170 is less stable than SP 7993 but more stable than SP Unique. The higher stability of CMR170 compared to that of SP Unique might be related to the manufacturing process which consisted in surrounding the NC-NG-EC matrix with a MC-Graphite coating. However, this cannot be ascertained since CMR170 also contains 10% more NC than SP Unique, which is less favorable to the diffusion and leaching of chemicals out of the matrix.
0 10 20 30 40 50 60 70 0 20 40 60 80 100 120 N G d isso lv ed (mg /L ) Time (d) 10ºC 25ºC 30ºC 1st run 0 2 4 6 8 10 12 14 16 18 0 5 10 15 20 25 30 N G d isso lv ed (mg /L ) Time (d) 10ºC 25ºC 30ºC 2nd run
Figure 7. Leaching of NG from CMR 170 as a function of temperature (CMR170: 10,000 ppm in each run)
0.0 2.0 4.0 6.0 8.0 10.0 0 20 40 60 80 100 120 M C d isso lv ed (mg/L) Time (d) 10ºC 25ºC 30ºC 1st run 0.0 0.5 1.0 1.5 2.0 0 20 M C di ssol v ed (m g/ L) Time (d) 10ºC 25ºC 30ºC 2nd run
Figure 8. Leaching of MC from CMR 170 as a function of temperature (CMR170: 10,000 ppm in each run) 0.00 0.10 0.20 0.30 0.40 0.50 0 20 40 60 80 100 120 EC d isso lv ed (mg /L ) Time (d) 10ºC 25ºC 30ºC 1st run 0.00 0.02 0.04 0.06 0.08 0.10 0 20 EC d isso lv ed (mg /L ) Time (d) 10ºC 25ºC 30ºC 2nd run
Figure 9. Leaching of EC from CMR 170 as a function of temperature (CMR170: 10,000 ppm in each run)
Table 6. Cumulative amounts of NG, MC and EC released from CMR170 (~500 mg) into water (2 50 mL) after the second run
NG from CMR170 MC from CMR170 EC from CMR170
10°C 25°C 30°C 10°C 25°C 30°C 10°C 25°C 30°C mg % 0.72 1.95 2.09 5.65 2.92 7.86 0.09 0.90 0.30 2.90 0.44 4.24 0.007 0.14 0.014 0.31 0.021 0.45
I.2.3. Dripping experiments
To have an idea of what would happen over long periods of time and under more dynamic conditions, long term dissolution experiments were conducted using either SP 7993, SP Unique or CMR170 particles and a continuous flow of water. The free flowing of water on the particles mimicked a rainflow falling on a particle lying on a porous soil where the water would disappear quickly into the ground. Flow rate was chosen deliberately high to accelerate the dissolution processes.
SP 7993. A particle of SP 7993 (cylinder of 5 mm length 2.6 mm diameter, 36.5
mg) was subjected to water dripping and the concentrations of ATEC and EC were monitored over time (Fig. 10). After the low concentrations of ATEC and EC
detected in the above batch experiment conducted with SP 7993 powder (Table 4), short collecting times of 0.5 h were applied at the beginning of the dripping
experiment to give rise to more concentrated samples. Despite the short times applied, EC remained at levels below the LOD (< 1 ppb) in all eluates, and ATEC was only detected in the first eluate at a concentration of 6.6 ppb (Fig. 10). Although no chemicals could be detected in the eluates after 0.5 h of dripping, the experiment was continued for 3 months.
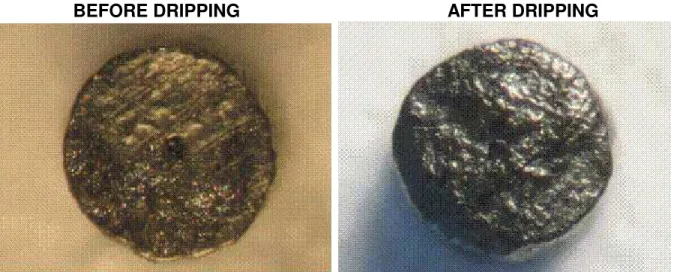
After 3 months, the experiment was stopped. The remaining particle was let to dry under air and suspended in acetonitrile for quantification of residual ATEC and EC. After fast dissolution in acetonitrile, analysis of the acetonitrile solution by HPLC allowed recovering 2.67 mg of ATEC and 0.47 mg of EC corresponding to 92% of the initial ATEC and 93% of the initial EC, respectively. After a 3-month dripping, the SP 7993 particle had thus lost 0.278 mg in total corresponding to 0.8% of its total original mass. This finding shows the very high stability of formulation SP 7993 towards dissolution in water.
In line with these results, micrographs (Fig. 11) and size measurements of the SP 7993 particle before and after the dripping experiment did not reveal any detectable changes. The dripping test thus confirmed the observations made in batch experiment. SP 7993 formulation appeared to be very stable in water; it led to
very slow leaching of ATEC and EC into water with the former being detected at ppb levels in the most loaded eluates and the second remaining below LOD.
0 10 20 30 40 50 60 70 80 90 100 0 2 4 6 8 10 C o n c e n tr a tio n i n e lu a te ( g L -1 ) Time (d) ATEC EC SP 7993
Figure 10. .Concentrations of ATEC and EC in the eluates of SP 7993 (35.6 mg) (T = 22°C; water flow: 0.5 mL min-1)
BEFORE DRIPPING AFTER DRIPPING
Figure 11. Microscopic photographs of a piece of SP 7993 non-exposed (left) and exposed (right) to a water dripping flow
SP Unique. SP unique particles that were provided to NRC were much smaller than
SP 7993 particles. The largest particle available to conduct a dripping test was a disk (0.5 mm thickness 1.6 mm diameter , 1.46 mg), which contained approx. 25 times less material than with SP 7993. When sweeping this small particle with the same water flow (0.5 mL min-1), NG was detected in the two first eluates but not in the next ones, and neither DPA nor EC was detected in any of the eluates (Fig. 12). At first, this result seemed contradictory to the high NG concentrations measured in batch experiments. But it was explained by the low mass of solid and the ensuing high dilution of dissolved components which did not allow reaching LODs.
The experiment was extended for 1 month regardless of the absence of chemical detection in the eluates. After one month of dripping, microscopic photographs of the particle showed a rough surface with some cavities in the surface of the particle (Fig. 13). Moreover, dissolution of the particle in acetonitrile followed by HPLC analysis allowed recovering 16.1% of NG, 23.5% of DPA, and 99.1 % of EC. Most of NG and DPA have thus leached out of the small particle during the 1-month dripping
experiment, whereas the content of EC remained largely unaffected. These findings show that a formulation that contains close to 80% NC can still loose most of its constituents if the latter, like NG, are highly hydrosoluble and poorly hydrophobic.
0 10 20 30 40 0.00 0.01 0.02 0.03 0.04 0.05 C o n c e n tr a tio n i n e lu a te ( m g L -1 ) Time (d) NG DPA EC SP Unique
Figure 12. Concentrations of NG, DPA, and EC in the eluates of SP Unique (1.46 mg) (T = 22°C; water flow: 0.5 mL min-1)
BEFORE DRIPPING AFTER DRIPPING
Figure 13. Microscopic photographs of a piece of SP Unique non-exposed (left) and exposed (right) to a water dripping flow
CMR 170. CMR170 particles that were provided to NRC were even smaller than SP
Unique particles. The largest particle available to conduct a dripping test was a small cylinder (0.85 mm thickness 0.81 mm diameter , 0.90 mg), which contained approx. 40 times less material than with SP 7993. When sweeping the small particle with the same water flow (0.5 mL min-1), neither NG, nor MC, nor EC were detected in any of the eluates. Again, like for SP Unique particle, this result was explained by the low mass of initial solid and the ensuing high dilution of dissolved components which did not allow attaining concentrations higher than LODs.
The experiment was also continued for 1 month regardless of the absence of chemical detection in the eluates. After one month of dripping, microscopic
photographs of the particle showed a rough surface with some cavities in the surface of the particle (Fig. 14). Dissolution of the particle in acetonitrile followed by HPLC analysis allowed recovering 79.2% of NG, 79.2% of MC, and 85.3% of EC. The higher recovery of NG in CMR170 compared to that measured in SP Unique (16%) after a similar period of water dripping is indicative of a slower dissolution rate of NG in CMR170 than in SP Unique. The lower NG dissolution rate observed with
CMR170 despite the smaller particle used in the dripping test for this formulation is in line with the results observed in the batch experiments (Figs. 4 & 7) and
mg L-1) compared to EC (45 mg L-1). The lower recovery of EC in CMR170 than in SP Unique was most likely attributable to analytical error due to the very low amount of EC in the small particles used. The present results confirm the possible leaching of NG from a formulation that contains NC. They also show that the rate and extent of NG leaching are inversely proportional to the proportion of NC in the formulation.
BEFORE DRIPPING AFTER DRIPPING
Figure 14. Microscopic photographs of a piece of CMR170 non-exposed (left) and exposed (right) to a water dripping flow
I.2.4. Conclusion
The aqueous solubility and dissolution rates of three formulations which all contain more than 75% NC were estimated using batch and dripping experiments. The single base formulation, SP 7993, (NC (90%), ATEC (8%), EC (1.4%), K2SO4, graphite), appeared to be the most stable in water, followed by CMR170 (NC (90%), NG (7.5%), EC (0.9%), K2SO4, C, MC (2.1%), graphite), and finally by SP Unique (NC & rosin (79%), NG (20.6%), EC (0.2%) and DPA (0.6%) . If exposed to a water flow, the latter will rapidly release significant amounts of NG in the environment.
II. TRANSPORT OF FORMULATIONS SP 7993, SP UNIQUE,
AND CMR170 AND THEIR INDIVIDUAL COMPONENTS IN
SOIL
Several individual components of the three formulations (NG, ATEC, DPA, MC) were present in other formulations previously studied at NRC-Montreal (Hawari et al., 2010a; report for NG Hawari et al., 2012). The transport studies of these
components were not replicated but the data previously obtained are included in this report for comparison purposes. EC was the only organic component that had not been investigated earlier. The octanol/water partition coefficient of EC was therefore determined to evaluate its relative hydrophobicity. In addition, its transport behavior was assessed in a soil from DRDC-Valcartier.
II.1. Experimental part II.1.1. Materials
A soil sampled in 2009 at a DRDC training range in Valcartier, QC, was used in this study. Selected specific properties of the soil - named “DRDC-09” throughout this report - are given in Table 7 along with properties of DRDC-08 soil also sampled at a DRDC training range but in 2008. DRDC-09 was markedly richer in silt/clay and organic matter than the soil sampled in 2008 at Valcartier.
Table 7. Physico-chemical properties of DRDC soils
Particle size distribution
Total Org. C (%) pH CECa (mequiv./100g) % Clay/Silt (< 80m) % Sand (>53m) DRDC-08 DRDC-09 6 27.5 94 72.5 0.36 2.08 4.2 6.7 6.69 13.2 a
II.1.2. Kow measurements
The octanol-water partition coefficient (Kow) of ATEC, DPA, MC, and EC was
measured at 22 2 C as described in the OECD Guideline 107 (OECD, 1981). The measurements were performed with non-saturated solvents. A volume (5 mL) of an aqueous solution of the analyte at approx. 10 mg L-1 was added to octan-1-ol (2, 3 or 4 mL) in a 16-mL PTFE-lined capped glass tube. The mixtures were equilibrated for four 10-min shaking periods spaced 10 min apart. The tubes were centrifuged at 3190 × g for 10 min. The octanol fraction was diluted (1:5) with a solution containing 70% methanol in water and the concentration of the substrate in the two fractions was determined by HPLC (or LC/MS for ATEC). Experiments were run in triplicate.
II.1.3. Batch sorption experiments
Batch equilibration was used to quantify the sorption of individual soluble
compounds of the three propellant formulations in soils 08 (for NG) or DRDC-09 (for the four other components) under aerobic conditions. A volume (10 mL) of filtered aqueous solution of analyte was added under sterile conditions to DRDC-09 soil (1.5 g) in autoclaved 125-mL headspace glass bottles. The latter were closed, but not sealed, with butyl rubber stoppers. The bottles were kept in the dark at 22 ± 1C and opened and shaken twice a week to ensure aerobic conditions. At various time intervals varying from 1 day to 3 months, three replicates were sacrificed. After 2 h of deposition, the supernatant was withdrawn, filtered through a 0.45 m
Millipore filter (Millipore Corp., Bedford, MA), diluted 1/1 in acetonitrile (CH3CN) and analyzed by HPLC or LC/MS as described in section I.1.2. Sorbed analyte was extracted from DRDC-09 soil as described in the EPA SW-846 Method 8330 (USEPA, 1997). Briefly, soil was sonicated with CH3CN (10 mL) at 20°C for 20 h, diluted 1/1 in an aqueous CaCl2 solution and filtered through a Millex-HV 0.45-m filter prior to HPLC analysis. A percent recovery was calculated by adding the soluble and sorbed fractions of analytes. The soil water distribution coefficient (Kd) was calculated as the soil to water analyte concentrations ratio.