HAL Id: hal-00429886
https://hal.archives-ouvertes.fr/hal-00429886
Submitted on 4 Nov 2009
HAL is a multi-disciplinary open access
archive for the deposit and dissemination of
sci-entific research documents, whether they are
pub-lished or not. The documents may come from
teaching and research institutions in France or
abroad, or from public or private research centers.
L’archive ouverte pluridisciplinaire HAL, est
destinée au dépôt et à la diffusion de documents
scientifiques de niveau recherche, publiés ou non,
émanant des établissements d’enseignement et de
recherche français ou étrangers, des laboratoires
publics ou privés.
Folks in folksonomies: Social link prediction from shared
metadata
Rossano Schifanella, Alain Barrat, Ciro Cattuto, Benjamin Markines, Filippo
Menczer
To cite this version:
Rossano Schifanella, Alain Barrat, Ciro Cattuto, Benjamin Markines, Filippo Menczer. Folks in
folksonomies: Social link prediction from shared metadata. third ACM international conference on
Web search and data mining, Feb 2010, New York, United States. pp.271, �10.1145/1718487.1718521�.
�hal-00429886�
Folks in Folksonomies:
Social Link Prediction from Shared Metadata
Rossano Schifanella
1∗Alain Barrat
2,3Ciro Cattuto
3Benjamin Markines
4Filippo Menczer
3,4 1Department of Computer Science, University of Turin, Italy 2Centre de Physique Théorique (CNRS UMR 6207), Marseille, France 3 Complex Networks and Systems Laboratory, ISI Foundation, Turin, Italy 4 School of Informatics and Computing, Indiana University, Bloomington, IN, USAABSTRACT
Web 2.0 applications have attracted a considerable amount of at-tention because their open-ended nature allows users to create light-weight semantic scaffolding to organize and share content. To date, the interplay of the social and semantic components of social me-dia has been only partially explored. Here we focus on Flickr and Last.fm, two social media systems in which we can relate the tag-ging activity of the users with an explicit representation of their social network. We show that a substantial level of local lexical and topical alignment is observable among users who lie close to each other in the social network. We introduce a null model that preserves user activity while removing local correlations, allowing us to disentangle the actual local alignment between users from sta-tistical effects due to the assortative mixing of user activity and cen-trality in the social network. This analysis suggests that users with similar topical interests are more likely to be friends, and therefore semantic similarity measures among users based solely on their an-notation metadata should be predictive of social links. We test this hypothesis on the Last.fm data set, confirming that the social net-work constructed from semantic similarity captures actual friend-ship more accurately than Last.fm’s suggestions based on listening patterns.
Categories and Subject Descriptors
H.1.2 [Information Systems]: Models and Principles—Human informa-tion processing; H.3.5 [Informainforma-tion Storage and Retrieval]: Online Infor-mation Services—Web-based services; H.5.3 [InforInfor-mation Interfaces and Presentation]: Group and Organization Interfaces—Collaborative comput-ing, Web-based interaction
General Terms
Algorithms, Experimentation, Measurement
∗Corresponding author. Email: [email protected]. A good
por-tion of the work in this paper was carried out while Dr. Schifanella was a visiting scholar at the Center for Complex Networks and Systems Research (CNetS) of the Indiana University School of Informatics and Computing.
Permission to make digital or hard copies of all or part of this work for personal or classroom use is granted without fee provided that copies are not made or distributed for profit or commercial advantage and that copies bear this notice and the full citation on the first page. To copy otherwise, to republish, to post on servers or to redistribute to lists, requires prior specific permission and/or a fee.
WSDM’10,February 4–6, 2010, New York City, New York, USA. Copyright 2010 ACM 978-1-60558-889-6/10/02 ...$10.00.
Keywords
Web 2.0, social media, folksonomies, collaborative tagging, social network, lexical and topical alignment, link prediction, social se-mantic similarity, Maximum Information Path
1.
INTRODUCTION
Social networking systems like Facebook and systems for con-tent organization and sharing such as Flickr and Delicious have created information-rich ecosystems where the cognitive, behav-ioral and social aspects of a user community are entangled with the underlying technological platform. This opens up new ways to monitor and investigate a variety of processes involving the inter-action of users with one another, as well as the interinter-action of users with the information they process. Social media supporting tag-ging [14, 3] are especially interesting in this respect because they stimulate users to provide light-weight semantic annotations in the form of freely chosen terms. Usage patterns of tags can be em-ployed to monitor interest, track user attention, and investigate the co-evolution of social and semantic networks.
While the emergence of conventions and shared conceptualiza-tions has attracted considerable interest [24, 16, 25, 2], little atten-tion has been devoted so far to relating, at the microscopic level, the usage of shared tags with the social links existing between users. The present paper aims at filling this gap. To this end we focus on Flickr and Last.fm, as to our knowledge they are currently the only popular social media system where: (1) a significant fraction of the users provide tag metadata for their content (photographs or songs), and (2) an explicit representation of the social links between users is readily available.
The main question that we address in this study is the follow-ing: given two randomly chosen users, how does the alignment of their tag vocabularies relate to their proximity on the social net-work? That is, does lexical alignment exist between neighboring users, and if so, how does this alignment fade when considering users lying at an increasing distance on the social graph? And if indeed such a relationship exists, does it allow us to predict so-cial links from analysis of the semantic similarity among users, ex-tracted from their annotations?
Contributions and outline
The main contributions of this paper are summarized as follows: • In § 4.1 we show that strong correlations exist across
sev-eral measures of user activity, and characterize the mixing patterns that involve user activity and user centrality in the social network.
• In § 4.2 we develop sound measures of tag overlap. We fur-ther introduce appropriate null models to disentangle the ac-tual local alignment between users from statistical effects due to the mixing properties of user activity and centrality in the social network. We apply these measures to the Flickr and Last.fm data sets. The resulting analysis shows that, despite neither Flickr nor Last.fm support globally-shared tag vocab-ularies, a substantial level of local lexical (shared tags) and topical (shared groups) alignment is observable among users who are close to each other in the social network. We also find that some observables are more adequate than others to measure lexical and topical alignment, in the sense that they are less sensitive to purely statistical effects.
• In § 5 we inquire if the observed correlations between anno-tation metadata and social proximity allow to use semantic similarity between user annotations as statistical predictors of friendship links. We evaluate a number of semantic sim-ilarity measures from the literature, based on Last.fm meta-data. We find that when we consider the annotations of the most active users, almost all of the semantic similarity mea-sures considered outperform the neighbor suggestions from the Last.fm system at predicting actual friendship relations. Scalable semantic similarity measures such as Maximum In-formation Path, proposed by some of the authors, are among those achieving the best predictive performance.
2.
RELATED WORK
One of the first quantitative studies on Flickr is presented by Marlow et al. [13], who discuss the heterogeneity of tagging pat-terns and perform a preliminary analysis of vocabulary overlap be-tween pairs of users. The analysis suggests that users who are linked in the Flickr social network have on average a higher vo-cabulary overlap, but no assessment is made of biases and other correlations that could be responsible for the reported observation. The structure and the temporal evolution of the Flickr social net-work are investigated in several papers [4, 18, 17]. Leskovec et
al.[6] place a special emphasis on the local mechanisms driving
the microscopic evolution of the network.
The role of social contacts in shaping browsing patterns on Flickr has also been explored [5, 26], providing insights into the behavior and activity patterns of Flickr users.
Prieur et al. [21] investigate the role of Flickr groups as coordina-tion tools, and explore the relacoordina-tion between the density of the social network and the density of the network of tag co-usage among the group members.
Liben-Nowell and Kleinberg [8] explore several notions of node similarity for link prediction in social networks. In our own prior work we performed a systematic analysis of a broad range of se-mantic similarity measures based on folksonomies, that can be ap-plied directly to build networks of users, tags, or resources [12, 10, 11]. Here we build upon this evaluation framework.
Li et al. [7] propose a system to discover common user interests and cluster users and their saved URLs by different interest topics. They use a Delicious data set to define implicit links between users based on the similarity of their tags. However they do not correlate the interest clusters with social connections.
Perhaps the work that most directly relates to our approach is by Santos-Neto et al. [23], who explore the question of whether tag-based or resource-based interest sharing in tagging systems re-late to other indicators of social behavior. The authors analyze the CiteULike and Connotea systems, which deal with scientific publi-cation and lack explicit social network components. Therefore they
are unable to directly explore social friendship between two users, and instead look at participation in the same discussion group, with mixed results. They do not find a statistical correlation between the intensity of interest sharing and the collaboration levels. Our present results are both more explicit (we deal with pairs of users rather than groups) and more conclusive. Furthermore we are able to evaluate our interest-based predictions against external sugges-tions based on independent data, quantifying the applicative value of our findings.
3.
DATA SETS
Flickr makes available most of its public data by means of API methods (flickr.com/api). The data used for the present study were obtained by using the public Flickr API to perform a dis-tributed crawl of the content uploaded to Flickr between January 2004 and January 2006. The system was crawled during the first half of 2007. The crawling task was distributed by dividing the above interval of time into work units consisting of smaller time windows, and crawling each time window separately. Each crawler was programmed to issue search queries for every known tag, lim-ited to its temporal window of competence, as well as to issue search queries for photos uploaded in the same interval. As new tags were discovered, they were added to a global table shared by all the crawlers. Separate crawls were performed to explore the Flickr social network (in Flickr jargon, the “contacts” of a given user are her nearest neighbors in the social network, as represented in the system), as well as group membership information.
Overall, the data set we analyzed comprises241, 031 users for
whom we have tagging information, and118, 144 users for whom
we also have group membership information. Our analysis will
focus on two networks. The first one, G0, comprises the Flickr
users for whom we have tag, group and contact information. It
consists of118, 144 nodes (users) and 2, 263, 182 edges (contacts
between users). The second network,G1, is obtained by extending
G0 to include all the neighbors of its nodes, neighbors for whom
we may not have tagging, group membership, or complete contact
information.G1comprises983, 778 nodes and 16, 673, 476 edges
and will be used to check the robustness of analyses involving the distance among users in the Flickr social network.
Similarly, we constructed our Last.fm data set using public API methods (last.fm/api), in particular for collecting neighbor and friend relations. In Last.fm jargon, friends are contacts in the social networks, while neighbors are users recommended by the system as potential contacts, based on their music playing histo-ries. Last.fm also allows users to annotate various items (songs, artists, or albums) with tags. However, the Last.fm API does not allow to retrieve the complete user annotation activity. Therefore, with permission, we developed a crawler that extracts all the triples (user, item, tag) and group membership information by visiting and parsing user profile web pages. The crawls took place over a pe-riod of a few months in the first half of 2009. The resulting data set
comprises of99, 405 users, of which 52, 452 are active, i.e., have at
least one annotation. The10, 936, 545 triples annotate 1, 393, 559
items with281, 818 tags. The users belong to 66, 429 groups.
No filters were applied to our data set collections.
4.
DATA ANALYSIS
In this section we present an analysis of the data. The very same analysis was carried out for both Flickr and Last.fm data sets. How-ever, due to space limitations, we report below mainly on the re-sults of the Flickr analysis. Unless otherwise specified our
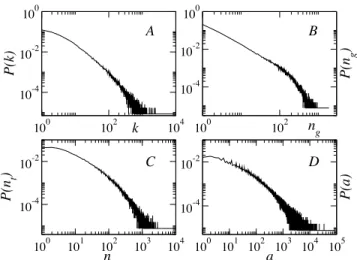
100 102 k 104 10-4 10-2 100 P (k ) 100 102 ng 10-4 10-2 100 P (ng ) 100 101 102 103 104 nt 10-4 10-2 P (n t ) 100 101 102 103 104 105 a 10-4 10-2 P (a) A B D C
Figure 1: Flickr distributions of (A) the numberk of neighbors
of a user, (B) the numberng of groups of which a user is a
member, (C) the numbernt of distinct tags per user, and (D)
the numbera of tag assignments per user.
Table 1: Averages and fluctuations of Flickr user activity
Measure of activityx Averagehxi hx2i/hxi
k 38.3 469
nt 85.3 511.4
ng 32.6 184.6
a 690.7 8471.3
G1. The analysis of Last.fm yielded analogous results, both
qual-itatively and quantqual-itatively. Therefore we believe our conclusions to be robust.
4.1
Heterogeneity and correlations
Let us first focus on the activity of users as measured by a number of indicators, and investigate the correlations between these indica-tors. The activity of a Flickr user has indeed various aspects, among which the most important are uploading photos, tagging them, par-ticipating in groups, commenting on other users’ photos, and other social networking activities. Fig. 1 displays the probability
distri-butions of the numberk of neighbors in the social network (the
degreek of a node), and the probability of finding a user with a
given numberntof distinct tags in her vocabulary. The breadth of
a user’s tag vocabulary can be regarded as a proxy for the breadth of her interests. We also show in Fig. 1 the distribution of the
num-ber of groupsng to which a user belongs, and of the total number
a of tags assignments submitted by a user (in this case, a tag used
twice by a user is counted twice). More precisely, iffu(t) is the
number of times that a tagt has been used by user u, then the
to-tal number of tag assignments of useru is au = Ptfu(t). All
these distributions are broad, showing that the activity patterns of users are highly heterogeneous. For reference, Table 1 reports the averages and variances of these quantities.
A few comments are in order. First, in our analysis we do not consider one obvious measure of activity, namely the number of photos uploaded by a user. One reason for this is that the number of photos posted by a user is known to be strongly correlated with the number of tags from the same user [13]. More importantly, Flickr is a “narrow folksonomy” in which users tend to tag mostly their own content [28]. Thus, when exploring the similarity of users and relating it to the underlying social network, shared usage of tags
100 101 102 103 104
k
100 102 104 106a(k)
n
t(k)
n
g(k)
Figure 2: Average number of distinct tags (nt), of groups (ng),
and of tag assignments (a) of users having k neighbors in the Flickr social network.
and co-membership in groups are natural and more direct indicators of shared interests. Another note concerns the comparison with the study by Mislove et al. [18], who reported a smaller average degree for the Flickr social network. This difference is due to the fact that in our study we focus on those users who use both tags and groups.
Since only21% of the users participate in groups [18], this means
that here we are focusing on the “active” users. As we will see below, the various activity metrics are correlated with one another, so users who are more active in terms of tags and groups will tend to have more contacts in the Flickr social network, hence the higher average degree we report here. Fig. 1, however, clearly shows that even within this “active” set of users, very broad distributions of activity patterns are observed and no “typical” value of the activity metrics can be defined.
It seems natural to ask whether the different types of activity measures are correlated with one another and with the structure of the social network: are users with more social links also more active in tagging their content, and do they participate in more groups? As shown in Fig. 2, the data show that this is indeed the case (see also Ref. [13]). Fig. 2 displays the average activity of
users withk neighbors in the social network, as measured by the
various metrics defined above. For instance,
nt(k) = 1 |u : ku= k| X u: ku=k nt(u) .
All types of activity have an increasing trend for increasing
val-ues ofk, and of course strong fluctuations are present at all values
ofk. The strong fluctuations visible for large k values are due to
the fewer highly-connected nodes over which the averages are per-formed. Notably, users with a large number of social contacts but using very few tags and belonging to very few groups can be ob-served. Despite these important heterogeneities in the behavior of
users with the same degreek, the data clearly indicate a strong
cor-relation between the different types of activity metrics. The
Pear-son correlation coefficients are: 0.349 between k and nt, 0.482
betweenk and ng, 0.268 betweenk and a, 0.429 between ntand
ng, 0.753 betweenntanda, 0.304 between nganda.
Another important question concerns the correlations between the activity metrics of users who are linked in the Flickr social net-work. This is a well-known problem in the social sciences, ecology, and epidemiology: a typical pattern, referred to as “assortative mix-ing,” describes the tendency of nodes of a network (here, the users)
to link to other nodes with similar properties. This appears intuitive in the context of a social network, where one expects individuals to connect preferentially with other individuals sharing the same in-terests. Likewise, it is possible to define a “disassortative mixing” pattern if the elements of the network tend to link to nodes that have different properties or attributes. Mixing patterns can be de-fined with respect to any property of the nodes [19]. In the present case, we characterize the mixing patterns concerning the various activity metrics.
In the case of large scale networks, the most commonly inves-tigated mixing pattern involves the degree (number of neighbors) of nodes. This type of mixing refers to the likelihood that users with a given number of neighbors connect with users with simi-lar degree. To this end, a commonly used measure is given by the
average nearest neighbors degree of a useru,
kunn= 1 ku X v∈V(u) kv,
where the sum runs over the setV(u) of nearest neighbors of u. To
characterize mixing patterns in the degree of nodes, a convenient
measure can be built on top ofku
nnby averaging over all nodesu
that have a given degreek [20, 27]:
knn(k) = 1 |u : ku= k| X u: ku=k kunn. (1)
In the case of Flickr, each user is endowed with several proper-ties characterizing its activity. It is thus interesting to characterize the mixing patterns with respect to all of those properties. To this end, we generalize the average nearest neighbors degree presented
above, and define for each useru the following quantities: (i) the
average number of tags of its nearest neighbors,
nu t,nn= 1 ku X v∈V(u) nt(v) ,
(ii) the average total number of tags used by its nearest neighbors,
au nn= 1 ku X v∈V(u) a(v) ,
and (iii) the average number of groups to which its nearest neigh-bors participate, nug,nn= 1 ku X v∈V(u) ng(v) .
To detect the mixing patterns, in complete analogy with the case
ofknn(k), we compute the average number of distinct tags of the
nearest neighbors for the class of users havingntdistinct tags:
nt,nn(n) = 1 |u : nt(u) = n| X u:nt(u)=n nu t,nn, (2)
the average total number of tags used by the nearest neighbors for
the class of users witha tag assignments:
ann(a) = 1 |u : a(u) = a| X u:a(u)=a aunn, (3)
and the average number of groups of the nearest neighbors for the
class of users who are members ofnggroups:
ng,nn(n) = 1 |u : ng(u) = n| X u:ng(u)=n nug,nn. (4) 100 102 k 104 102 103 k nn (k ) 100 102 n g 102 n g , nn (n g ) 100 101 102 103 104 nt 102 103 n t, nn (n t ) 100 101 102 103 104 105 a 103 104 a nn (a) A C D B
Figure 3: (A) Average degree of the nearest neighbors of nodes
of degreek, computed for G0 (black circles)G1 (red crosses)
Flickr networks. (B) Average number of groups for the
near-est neighbors of nodes belonging to ng groups. (C) Average
number of tags for the nearest neighbors of nodes withnttags.
(D) Average total number of tag assignments for the nearest
neighbors of nodes witha tag assignments. In all cases a clear
assortative trend is observed.
Fig. 3 displays the quantities of Eqs. 1–4 for the Flickr data set. In all cases, a clear assortative trend is visible: the average activity of the neighbors of a user increases with the user’s own activity, for all the activity measures we computed. Note that for the degree
mixing patterns, the assortative trend is even enhanced whenG1
is considered instead ofG0. Large fluctuations are observed for
large activity values, because of the small number of very active users. We remark that while Mislove et al. [18] had already found an assortative trend with respect to the degree of the social network, Fig. 3 highlights that the activities of socially connected users are correlated at all levels.
4.2
Lexical and topical alignment
In this section we analyze more in detail the similarity of user profiles in relation to their social distance. More precisely, the pre-vious section was devoted to the correlations between the intensity of user activities, as quantified by several metrics. We now focus on the similarity between user profiles as measured by the similar-ity of their respective tag vocabularies, and by the similarsimilar-ity of the set of groups they belong to.
As mentioned above, Flickr is a “narrow folksonomy” [28]: tag annotations are provided mostly by the content creator, i.e., the tags associated with a photo are typically provided by the user who posted that photo. Intuitively, the absence of shared content, to-gether with the very personal character of both the content and the tag metadata, make the Flickr tag vocabulary extremely incoherent across the user community. Conversely, social bookmaking sys-tems like Delicious allow multiple users to annotate the same re-source and one could argue that the browsing experience exposes users to the global tag vocabulary and fosters — at least in princi-ple — imitative or cooperative processes leading to the emergence of global conventions in the user community [14].
In light of the above observations, we do not expect to observe a globally shared tag vocabulary in the Flickr community. A simple test for the existence of such a globally shared vocabulary can be performed by selecting pairs of users at random and measuring the
Table 2: Tags most frequently used by three Flickr users
User A User B User C
green flower japan
red green tokyo
catchycolors kitchen architecture
flower red bw
blue blue setagaya
yellow white reject
catchcolors fave sunset
travel detail subway
london closeupfilter steel
pink metal geometry
orange yellow foundart
macro zoo canvas
of shared tags is onlyhnsti ≈ 1.6. The most common case (mode)
is in fact the absence of any shared tags; this occurs with probability
close to2/3 among randomly chosen pairs of users.
One can nevertheless expect that a number of mechanisms may lead to local alignment of the user profiles, in terms of shared tags and/or groups membership. The presence of a social link, in fact, indicates a priori some degree of shared context between the con-nected users, which are likely to have some interests in common, or to share some experiences, or who are simply exposed to each other’s content and annotations. As an example, Table 2 shows the 12 most frequently used tags for three Flickr users with compara-ble tagging activity. User A and user B have marked each other as friends, while user C has no connections to either A or B on the Flickr social network. All of these users have globally popular tags in their tag vocabulary. In this example, the neighbors A and B share an interest (expressed by the tag flower) and several of the most frequently used tags (marked in bold).
Regardless of the mechanism driving this potential local align-ment, in the following we want to measure this effect for the case of tag dictionaries and group memberships, and put it into relation with the distances between users along the social network. This ap-proach is similar to the exploration of topical locality in the Web, where the question is whether pages that are closer to each other in the link graph are more likely to be related to one another [15].
First, we must define robust measures of vocabulary similarity
and group affiliation similarity between two usersu and v. The
first and simplest measures are given by the number of shared tags
nstamong the tag vocabularies ofu and v, and by the number of
shared groupsnsgto which bothu and v belong. These measures,
however, are not normalized and can be affected by the specific activity patterns of the users: two very active users may have more tags in common than two less active users, just because active users tag more, on average. We therefore consider as well a distributional
notion of similarity between the tag vocabularies ofu and v.
Fol-lowing Ref. [1] we regard the vocabulary of a user as a feature vec-tor whose elements correspond to tags and whose entries are the tag frequencies for that specific user’s vocabulary. To compare the tag feature vectors of two users, we use the standard cosine
simi-larity [22]. Denoting byfu(t) the number of times that tag t has
been used by useru, the cosine similarity σtags(u, v) is defined as
σtags(u, v) = P tfu(t)fv(t) pP tfu(t)2 pP tfv(t)2 . (5)
This quantity is0 if u and v have no shared tags, and 1 if they have
used exactly the same tags, in the same relative proportions.
Be-cause of the normalization factors in the denominator,σtags(u, v)
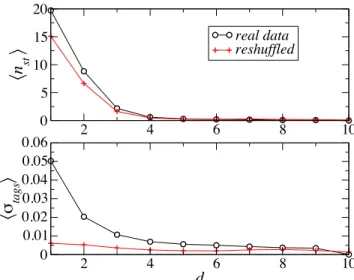
2 4 6 8 10 0 5 10 15 20
!n
st"
real datareshuffled2 4 6 8 10
d
0 0.01 0.02 0.03 0.04 0.05 0.06!#
tags"
Figure 4: Top: average number of shared tagshnsti for two
Flickr users as a function of their distanced along the social
network. Bottom: average cosine similarityhσtagsi between
the tag vocabularies of two Flickr users as a function ofd. In
both cases data for the same social network with reshuffled tag vocabularies are shown.
is not directly influenced by the global activity of a user.
Similarly, we can define the cosine similarityσgroupsfor groups
memberships. Since a user belongs at most once to a group, this reduces to σgroups(u, v) = P gδ g uδvg png(u)ng(v) (6) whereδg
u= 1 if u belongs to group g and 0 otherwise.
To compute averages of these similarities, we randomly chose
N = 2 × 10⁴users and explored their neighborhoods in a
breadth-first fashion. In order to exclude biases due to this sampling, we also performed an exhaustive investigation of the social network
neighborhoods up to distance2 from each user, obtaining the same
results. Moreover we considered the distances along the social
net-work usingG1 instead ofG0, and again found the same results,
showing the robustness of the observed behavior with respect to possible sampling biases due either to the crawl or to considering only users having both tagging activity and groups memberships.
Figures 4 and 5 give an indication of how the similarity
be-tween users depends on their distanced along the social network,
by showing the average number of shared tags, of shared groups, and the corresponding average cosine similarities, of two users as a
function ofd. While the average number of shared tags or groups
is quite large for neighbors (respectively close to20 and to 10), it
drops rapidly (exponentially) asd increases, and is close to 0 for
d ≥ 4.
Figures 4 and 5 provide a strong indication that a certain degree of alignment between neighbors in the social network is observed both at the lexical level and for group affiliations. As soon as the
distance between two users on the social distance is not1
(neigh-bors) or 2 (neighbors of neighbors) however, it becomes highly
probable that these users have neither tags nor groups in common. Therefore the alignment is a strongly local effect.
The analysis of the mixing patterns of the social network per-formed previously leads us to investigate in more detail this local alignment. This analysis has indeed shown the presence of a strong assortativity with respect to the intensity of the users’ activity. It
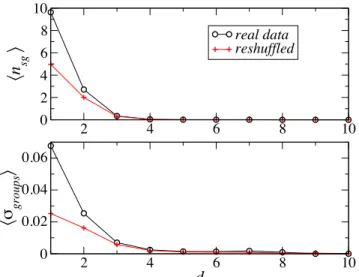
2 4 6 8 10 0 2 4 6 8 10
!n
sg"
2 4 6 8 10d
0 0.02 0.04 0.06!#
gr oups"
real data reshuffledFigure 5: Top: average number of shared groupshnsgi for two
Flickr users as a function of their distanced along the social
network. Bottom: average cosine similarity of the group
affili-ationhσgroupsi vs d. In both cases data for the same social
net-work with reshuffled group affiliations (preserving the number of groups for each user) are shown.
could therefore be the case that such assortativity, by a purely sta-tistical effect, yields an “apparent” local alignment between the tag vocabularies of users. For example, even in a hypothetical case of purely random tag assignments, it would be more probable to find tags in common between two large tag vocabularies than between a small one and a large one.
In order to discriminate between effects due to actual lexical and group membership similarity and those simply due to the assorta-tivity, it is important to devise a proper null model, i.e. to construct an artificial system that retains the same social structure as the one under study, but lacks any lexical or topical alignment other than the one that may result from statistical effects. This is done by keeping fixed the Flickr social network and its assortativity pattern for the intensity of activity, but destroying socially-related lexical or topical alignments by means of a random permutation of tags among themselves and groups among themselves. More precisely, we proceed in the following fashion: (i) we keep the social network unchanged; (ii) we build the global list of tags with their multi-plicity, i.e. each tag appears the total number of times it has been
used; (iii) for each user withnttagst1, t2. . . tnt, with respective
frequenciesf1, f2, . . . , fnt, we extractnt distinct tags at random
from the global list of tags and assign them tou with frequencies
f1, f2, . . . , fnt. This guarantees that the number of distinct tags
and the total number of tag assignments for each user is the same as in the original data, and that the distribution of frequencies of tags is left unchanged. Clearly, this null model preserves the assor-tativity patterns with respect to the amount of activity of users, as each user has exactly the same number of distinct tags and of tag assignments as in the real data. However, correlations between the tag vocabularies are lost, except the ones purely ascribed to statis-tical effects.
For group membership, we can proceed in a similar way: (i) we build a list of groups with a multiplicity equal to the number of
users of each group (i.e., a group appearsn times in the list if it has
n users); (ii) for each user u belonging to ng groups, we extract
at randomng(distinct) groups from the list and assign them tou.
As for the tags, this procedure preserves the number of groups for
1 10 100 1000
n
st 10-8 10-6 10-4 10-2 100P(n
st)
d=1 d=2 d=1, reshuffled d=2, reshuffled 0 0,2 0,4 0,6 0,8 1σ
tags 10-8 10-6 10-4 10-2 100P(
σ
tags)
Figure 6: Top: Probability distributions of the number of
shared tags of two users being at distanced on the social
net-work, ford = 1 and d = 2 (symbols), and for the same network
with reshuffled tags (lines). Bottom: same for the distributions of cosine similarities of the tag vocabularies.
each user, as well as the statistics of the number of users per group, while destroying correlations between users’ group memberships.
The goal of the null model is to determine the amount of lexical and topical alignment due to spurious activity correlations. Elim-inating such spurious correlations is analogous in purpose to the use of inverse document frequency (IDF) in information retrieval. IDF discounts the contribution of globally common terms in as-sessing the similarity between documents. Such terms are likely to be shared by pairs of documents solely because of their statistical prevalence. Unlike in information retrieval, it is not straightfor-ward to apply this type of discounting in social annotations. One would first need to determine whether to discount tags based on their prevalence among users or among resources. The null model destroys all spurious correlations regardless of their source.
Using the null model, we measured the alignment between users
at distanced on the social network in the same way as for the
orig-inal data. As Figs. 4 (top) and 5 (top) show, the average number of shared tags or of shared groups, as a function of the distance d, shows a similar trend to the original (non-reshuffled) data. For neighbors and next to nearest neighbors (d < 3), the average num-bers of shared tags or groups are lower in the null model than in the original data, but still significantly higher than for users at larger distances. The assortative mixing between the amount of activity of neighboring users is therefore enough to yield a strong lexical and topical alignment as simply measured by the number of shared
tags or groups. The case of cosine similarity is quite different. As shown in Fig. 4 (bottom), the average cosine similarity is very small in the null model, and does not depend strongly on the dis-tance in the social network. Therefore local lexical alignment is a real effect: friends are more likely to use similar tag patterns. With respect to the topical alignment, a certain — albeit weaker —
dependence ofhσgroupsi on d is visible in Fig. 5 (bottom).
We also analyzed the distributions ofnst,σtags,nsg, andσgroups
among users at fixed distanced, for both the original and the
reshuf-fled data. For brevity we show only the distributions ofnstand
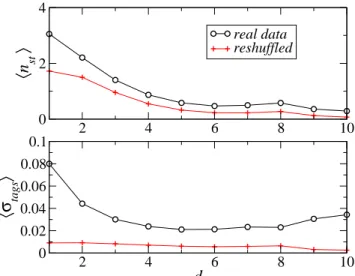
2 4 6 8 10 0 2 4
〈
n
st〉
real datareshuffled2 4 6 8 10
d
0 0.02 0.04 0.06 0.08 0.1〈σ
tags〉
Figure 7: Average number of shared tags (top) and average co-sine similarity between tag vocabularies (bottom) for pairs of Last.fm users as a function of their social distance. We also show data for the same social network with reshuffled tag vo-cabularies.
very similar for the original and the reshuffled data, while for the cosine similarity they are clearly different: a much stronger local alignment occurs in the original data.
As mentioned earlier, analogous results are found by analyzing our Last.fm data set. For illustration purposes we just show in Fig. 7 the dependencies of local tag alignment measures on social dis-tance. Again cosine similarity is the more robust measure.
Our investigation of the lexical and topical alignment patterns in Flickr and Last.fm reveals therefore the following picture. The var-ious measures of the topical and lexical overlap between users as a function of their distance along the social network clearly point
to-ward a partial local alignment, which persists up to distances2 − 3,
even if large values can occasionally still be observed at larger dis-tances. Interestingly, if the number of shared tags between users is the only retained measure, a reshuffling of tags and groups between users shows that a large part of the alignment is simply due to the assortative pattern concerning users’ amounts of activity. This re-sult highlights the importance of considering appropriate null mod-els to discriminate between purely statistical effects and real lexi-cal or topilexi-cal alignments. It also shows that correctly normalized similarity measures such as cosine similarity, which factor out the effects of vocabulary size, are more appropriate for such investiga-tions, since they are less affected by the assortativity patterns.
5.
PREDICTING SOCIAL LINKS
The analysis in the previous section strongly suggests that users with similar topical interests, as captured by shared tags in particu-lar, are more likely to be neighbors in the social network. Therefore a natural question is whether semantic similarity measures among users based solely on their annotation patterns can be employed as accurate predictors of friendship links. We tested this hypothesis on both our Flickr and Last.fm data sets, because each provides an-notation metadata needed to compute similarity as well as a social network to evaluate the accuracy of the predictions. For brevity we focus on reporting the results for the Last.fm data, which are more interesting for two reasons. First, contrary to Flickr, Last.fm is a “broad folksonomy” in which different users can easily anno-tate the same songs, artists, or albums. This allows us to compute
similarity based on shared content as well as shared vocabulary. Second, Last.fm provides neighbor recommendations. Neighbors are users with a similar music taste, based on listening patterns. The neighborhood relation is therefore independent of the explicit friendships established by the users, and provides an obvious gauge against which to evaluate any algorithm to predict social links. Ex-cept for the lack of such a comparison measure in Flickr (beyond the random choice baseline), and for not considering similarity measures based on shared items in Flickr, the prediction analysis yields consistent and encouraging results using both data sets.
5.1
Overview of semantic similarity measures
In prior work [12, 10, 11] we evaluated a number of social
sim-ilaritymeasures based on folksonomies, i.e., on annotations repre-sented as triples (user, item, tag) where Flickr photos and Last.fm songs are instances of items. All of these social similarity mea-sures have the desirable property of being symmetric in the sense that they can be directly applied to compute the similarity between two items, two tags, or two users from a folksonomy. Therefore we employ several of these measures here to predict social network links from the similarity among users. We summarize below a few main features of the proposed user similarity measures; for further details and examples see Refs. [10, 11].
We consider two aggregation schemes. In distributional aggre-gation, we project along one of the dimensions keeping track of
frequencies. For example, projecting onto items, a useru is
rep-resented as a tag vector whose componentfu(t) is the number of
items tagged byu with t. Analogously we can project onto tags
rep-resenting users as item vectors. Unfortunately distributional aggre-gation requires that all similarities be recomputed for any change in annotations, leading to quadratic runtime complexity.
In collaborative aggregation, first we pick a feature (tag or item) and for each value of this feature we represent each user as a list of values of the other feature (items or tags). Then we compute a dif-ferent similarity value between two users according to each of these lists. Finally we aggregate these similarities by voting (summing). For example, for each tag we can compute a similarity value based on item lists. These are then summed across tags to obtain the fi-nal similarity. Afi-nalogously we can compute similarities from tag lists and sum them across items. Collaborative aggregation has two advantages. First, it can be integrated with collaborative filtering techniques (hence the name) by a judicious definition of conditional
probabilitiesp(item|tag) or p(tag|item). This makes
collabora-tive similarity measures competicollabora-tive with distributional measures in terms of accuracy [10]. Second, similarities based on collab-orative aggregation can be updated incrementally, in linear time. When a triple is added or deleted, only similarities involving the item or tag in that triple need be updated. As a result, collabora-tive aggregation leads to scalable social similarity measures. Each aggregation scheme has two variants, depending on whether we project onto/aggregate across tags or items.
For each aggregation scheme/variant we consider six measures:
cosine, overlap, matching, Dice and Jaccard coefficients, and max-imum information path (MIP).Note that distributional cosine with
projection onto tag vectors is theσtags measure discussed in the
previous section. MIP is a generalization of Lin’s similarity [9] to the non-hierarchical triple representation [11]. For example, the distributional version of MIP with aggregation across items is de-fined as
σM IP
items(u1, u2) = 2 log(mint∈T1∩T2p[t])
log(mint∈T1p[t]) + log(mint∈T2p[t])
users annotating with tagt. For aggregation across tags the defi-nition is analogous except that we look at probabilities of shared items. For the collaborative version projecting onto items, say, we
would similarly defineσM IP
items(u1, u2; r) for each item r
replac-ingTiby the setTirof tags used byuito annotater, and
replac-ingp[t] by a suitably defined p[t|r]. Finally σM IP
items(u1, u2) =
P
rσ
M IP
items(u1, u2; r). Among the measures discussed in Ref. [10]
we did not consider mutual information due to its higher
computa-tional complexity. In addition to these6×2×2 = 24 measures, we
also consider for comparison purposes the affinity score provided by Last.fm for the 60 top neighbors of each user. As mentioned ear-lier, this score is based on similar music taste and computed from listening patterns.
5.2
Methodology
The evaluation consists in selecting a set of pairs of users, com-puting each similarity measure for each pair, and adding social links between users in decreasing order of their topical similarity: the pairs of users with highest similarity are those we predict to be most likely friends. For each predicted social link, we check the actual social network to see if the prediction is correct. As one decreases the similarity threshold more links are added, leading to more true positives but also more false positives. The best similar-ity measure is the one that achieves the best ratio of true positive to false positive rate across similarity values, as illustrated by ROC plots and quantified by the area under the ROC curve (AUC).
To sample the pairs of users from our data set, we start by sorting the users by one of three different criteria:
1. Most Active: By number of annotations; 2. Most Connected: By number of friends; 3. Random: By shuffling.
The setP of pairs is then constructed according to the following
algorithm: repeat:
pick next u by sorting criterion
R ← set of 60 neighbors of u
for each n from R:
if n is active:
P ← (u, n)
stop when |P | = M
Recall that users are considered active if they have at least one an-notation. This is a requirement in order to compute topical simi-larity. The choice to select pairs among neighbors stems from the goal of comparing the accuracy of topical similarity methods with Last.fm recommendations. Given the sparsity of the social and neighbor networks, comparative evaluation would be impossible without such a sampling. Note that this sampling strategy may bias the evaluation in favor of Last.fm’s neighbor recommendations, be-cause if two active neighbors are friends, they are guaranteed to be detected while two active friends who are not neighbors would be missed by our sampling even if they were detected by our similar-ity measures. Therefore our sampling algorithm is a conservative choice in that it does not unfairly help our similarity measures in
the evaluation.1 We experimented with sets of pairs of cardinality
M = 1, 000 and M = 2, 500. The results are similar; we report below on evaluations with 1,000 pairs.
1
At press time Last.fm has released a new API functionality, called
Tasteometer, to query the affinity score for arbitrary user pairs. This will allow us to sample users independently of neighborhood rela-tions in future evaluarela-tions.
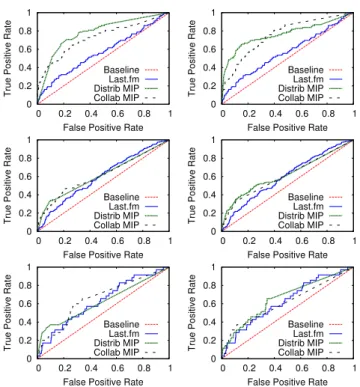
Figure 8: ROC curves comparing the social link predictions of distributional and collaborative MIP with the Last.fm recom-mendations. Triples can be aggregated across items (left) or tags (right). Users are sampled from the most active (top), the most connected (middle), or at random (bottom).
5.3
Results
The best results are obtained by sampling the most active users. This is not surprising, as the topical similarity measures have more evidence at their disposal from the users’ metadata. In Fig. 8 we show ROC plots for the MIP measures, which perform consis-tently well (among the top 3 measures) in all conditions. While Last.fm neighbor recommendations do perform better than the ran-dom baseline, topical similarity is much more accurate than mu-sic taste in predicting friends for the most active users. The high-est accuracy is achieved by aggregating across items, i.e. repre-senting users as vectors of tags. For the most connected users as well as randomly selected users, the topical similarity measures still perform significantly better than the random baseline, but only marginally better than Last.fm neighbor recommendations. Let us therefore focus on the most active users to evaluate the predictions of additional measures.
Since it is difficult to compare 25 ROC plots, let us summarize our results as follows. For each of the 24 topical similarity
mea-sures,σ, we compare the area under the ROC curve with that
ob-tained by the Last.fm neighbor recommendations. We measure the
relative improvementAU C(σ)/AU C(Last.f m) − 1. A positive
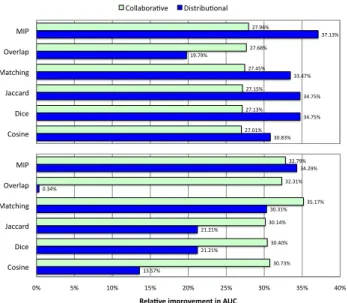
number indicates higher accuracy than Last.fm in the sense of a larger number of true positives for the same number of false posi-tives. Fig. 9 shows that all topical similarity measures outperform the Last.fm neighbor recommendations. The lonely exception is distributional item overlap, for which the improvement is not sig-nificant. For distributional measures, aggregation across items (fo-cusing on shared tags) yields better predictions. Overall, the best accuracy is achieved by distributional MIP based on shared tags (37% improvement). However, if scalability is important, predic-tions of comparable accuracy can be obtained by projecting over
!"#$!%& !'#()%& !'#()%& !!#'(%& *+#(+%& !(#*!%& ,(#"*%& ,(#*!%& ,(#*)%& ,(#')%& ,(#-$%& ,(#+-%& ./0123& 4153& 6755789& :7;5<12=& >?38@7A& :BC& ./@@7D/87E?3& 410;81DFE/27@& !"#$%&' (!#(!&' (!#(!&' ")#"!&' )#"*&' "*#(+&' ")#%"&' ")#*)&' ")#!*&' "$#!%&' "(#"!&' "(#%+&'
)&' $&' !)&' !$&' ()&' ($&' ")&' "$&' *)&'
,-./01' 2/31' 4533567' 8593:/0;' <=16>5?' 8@A' !"#$%&"'()*+,&")"-.'(-'/01'
Figure 9: Relative improvement in area under ROC curves over Last.fm neighbor recommendations, for the most active users. Triples are aggregated across items (top) or tags (bot-tom).
each tag, and then aggregating the similarities across tags. Col-laborative matching yields the best predictions in this case (35% improvement), followed closely by collaborative MIP (33%) and overlap (32%).
In summary, these results confirm that the social network con-structed from semantic similarity based on user annotations cap-tures actual friendship more accurately than Last.fm’s recommen-dations based on listening patterns. This suggests that the Last.fm neighbourhood selection could be improved by adopting tag-based similarity measures, especially for active users. The results are qualitatively similar for the other sampling methods, but the dif-ferences in accuracy are less significant, with the best predictions outperforming Last.fm by at most 3–4% in AUC for the most con-nected users and by 1–5% for random users.
6.
CONCLUSION AND FUTURE WORK
In this paper we exploited one peculiarity of Flickr and Last.fm, namely the availability of both tagging data and the explicit social links between users, to investigate the interplay of the social and semantic aspects of Web 2.0 applications.
We showed that strong correlations exist between user activity in the social context (user degree centrality and group participation) and the tagging activity of the same user, and that a strong assor-tative mixing exists in the social network; more active nodes tend to have as neighbors other active nodes. We also found that a lo-cal alignment of users’ tag vocabularies is clearly visible between nearby users in the social network, even for social tagging systems that lack a notion of globally shared tag vocabulary, such as Flickr. We investigated the dependence of the number of shared tags and the number of shared groups of two users, as a function of their shortest-path distance on the social network. We introduced a null model and we used it to show that part of the similarity between users who are close on the social network is due to the aforemen-tioned correlations between user activity and user degree centrality in the social network. That is, assortativity and heterogeneity alone can yield a comparatively higher overlap of tag usage and group membership for neighboring users. In this context, our work
high-lights the importance of backing up the data analysis with carefully designed null models, which are necessary — as is the case here — to disentangle the actual signal we are looking for from effects arising purely from correlations and mixing properties.
Armed with the null model methodology, we showed that it is possible to define measures of tag vocabulary and group member-ship overlap that are robust with respect to the above biases. We investigated the average similarity of two users, according to such measures, as a function of the distance in the social network, find-ing that a clear signal of local lexical and topical alignment can be detected in Flickr and Last.fm.
The observed local alignment between lexical (tag) features on the social network led us to investigate the question of whether top-ical similarity measures based on social annotations can be applied to the prediction (or recommendation) of friend relations in a social network. Last.fm provided us with an ideal opportunity to explore this question thanks to the simultaneous availability of social link recommendations based on music listening patterns, along with the annotation metadata and social network.
We were able to evaluate the predictive power of a large number of social topical similarity measures from the literature, spanning multiple aggregation/projection schemes. The results were very en-couraging; using any of the tested social similarity measures we were able to improve on the accuracy of the social link predictions provided by Last.fm, and the improvements were especially sig-nificant for users who are active taggers. Equally encouraging is the fact that accurate predictions are afforded even by incremental measures, pointing to scalable algorithms to compute social link recommendations or improve existing methods.
Among the various measures we evaluated, maximum informa-tion path has proven very accurate across aggregainforma-tion schemes, data sets, and sampling methodologies. When predicting social links between active taggers, MIP is the best measure among those based on distributional aggregation (regardless of whether we ag-gregate across items or tags), and either the best or a close second among the scalable measures based on collaborative aggregation, across items or tags respectively.
As expected, the Last.fm neighborhood relation seems to be in-dependent of the tagging activity of users; we obtain very close AUC values for both the most active and most connected sampling strategies. Therefore the number of annotations considered does not affect the estimation of user affinity based on listening patterns. Accordingly, the present results suggest that the Last.fm neighbor-hood recommendation could benefit considerably from social sim-ilarity measures — especially for active users.
Our results have important implications for the design of social media. As social networks and social tagging continue to become increasingly popular and integrated in the Web 2.0, our techniques can be directly applied to improve the synergies between social and semantic networks — specifically, to help users find friends with similar topical interests as well as facilitate the formation of topical communities.
We plan to further validate our findings via user studies. We will pursue this direction by integrating a “suggest friend” functionality into GiveALink.org, a social bookmarking system developed by our group at Indiana University for research purposes.
On the more theoretical side, future work will consider the present analysis performed longitudinally in time, to move from assessing correlations to assessing causality. We will investigate whether the activation of a social link induces a local alignment of tags and group membership, or conversely a similarity in interests triggers the creation of a social link. Both processes probably play an im-portant role in different situations, and adding a temporal
dimen-sion to the analysis presented here will provide new insight for modeling the structure and evolution of user-driven systems.
Acknowledgments
The authors acknowledge stimulating discussion with A. Baldas-sarri, A. Capocci, V. Loreto, and V. D. P. Servedio. We are grateful to Flickr and Last.fm for making their data available. This work has been partly supported by the TAGora project (FP6-IST5-34721) funded by the FET program of the European Commission and by the project Social Integration of Semantic Annotation Networks for
Web Applicationsfunded by National Science Foundation award IIS-0811994. R. Schifanella was supported by the World Wide Style project (WWS) of the University of Turin.
7.
REFERENCES
[1] C. Cattuto, D. Benz, A. Hotho, and G. Stumme. Semantic grounding of tag relatedness in social bookmarking systems. In Proceedings of the 7th International Semantic Web
Conference (ISWC08), volume 5318 of LNCS, pages 615–631. Springer-Verlag, 2008.
[2] S. Golder and B. A. Huberman. The structure of collaborative tagging systems. Journal of Information
Science, 32(2):198–208, April 2006.
[3] T. Hammond, T. Hannay, B. Lund, and J. Scott. Social Bookmarking Tools (I): A General Review. D-Lib Magazine, 11(4), April 2005.
[4] R. Kumar, J. Novak, and A. Tomkins. Structure and evolution of online social networks. In KDD ’06:
Proceedings of the 12th ACM SIGKDD international conference on Knowledge discovery and data mining, pages 611–617, New York, NY, USA, 2006. ACM Press. [5] K. Lerman and L. Jones. Social browsing on flickr. In
Proceedings of International Conference on Weblogs and Social Media (ICWSM), March 2007.
http://arxiv.org/abs/cs.HC/0612047.
[6] J. Leskovec, L. Backstrom, R. Kumar, and A. Tomkins. Microscopic evolution of social networks. In KDD ’08:
Proceeding of the 14th ACM SIGKDD international conference on Knowledge discovery and data mining, pages 462–470, New York, NY, USA, 2008. ACM.
[7] X. Li, L. Guo, and Y. E. Zhao. Tag-based social interest discovery. In Proceeding of the 17th Intl. Conf. on World
Wide Web (WWW), pages 675–684, New York, NY, USA, 2008. ACM.
[8] D. Liben-Nowell and J. Kleinberg. The link prediction problem for social networks. In Proc. 12th Intl. Conf. on
Information and Knowledge Management (CIKM), pages 556–559, New York, NY, USA, 2003. ACM.
[9] D. Lin. An information-theoretic definition of similarity. In J. W. Shavlik, editor, Proceedings of the Fifteenth
International Conference on Machine Learning (ICML), pages 296–304. Morgan Kaufmann, 1998.
[10] B. Markines, C. Cattuto, F. Menczer, D. Benz, A. Hotho, and G. Stumme. Evaluating similarity measures for emergent semantics of social tagging. In Proc. 18th Intl. World Wide
Web Conference (WWW), 2009.
[11] B. Markines and F. Menczer. A scalable, collaborative similarity measure for social annotation systems. In Proc.
20th ACM Conf. on Hypertext and Hypermedia (HT), 2009. [12] B. Markines, H. Roinestad, and F. Menczer. Efficient
assembly of social semantic networks. In Proc. 19th ACM
Conf. on Hypertext and Hypermedia (HT), pages 149–156, New York, NY, USA, 2008. ACM.
[13] C. Marlow, M. Naaman, D. Boyd, and M. Davis. Ht06, tagging paper, taxonomy, flickr, academic article, to read. In
Proc. 17th ACM Conference on Hypertext and hypermedia
(HT), pages 31–40, New York, NY, USA, 2006. ACM Press.
[14] A. Mathes. Folksonomies – Cooperative Classification and Communication Through Shared Metadata, December 2004. http://www.adammathes.com/academic/computer-mediated-communication/folksonomies.html.
[15] F. Menczer. Lexical and semantic clustering by Web links.
Journal of the American Society for Information Science and Technology, 55(14):1261–1269, 2004.
[16] P. Mika. Ontologies are us: A unified model of social networks and semantics. Web Semantics: Science, Services
and Agents on the World Wide Web, 5(1):5–15, 2007. [17] A. Mislove, H. S. Koppula, K. P. Gummadi, P. Druschel, and
B. Bhattacharjee. Growth of the flickr social network. In
Proceedings of the 1st ACM SIGCOMM Workshop on Social Networks (WOSN’08), August 2008.
[18] A. Mislove, M. Marcon, K. P. Gummadi, P. Druschel, and B. Bhattacharjee. Measurement and analysis of online social networks. In Proceedings of the 5th ACM/USENIX Internet
Measurement Conference (IMC’07), October 2007.
[19] M. E. J. Newman. Mixing patterns in networks. Phys. Rev. E, 67:026126, 2003.
[20] R. Pastor-Satorras, A. Vázquez, and A. Vespignani. Dynamical and correlation properties of the Internet. Phys.
Rev. Lett., 87:258701, 2001.
[21] C. Prieur, D. Cardon, J.-S. Beuscart, N. Pissard, and P. Pons. The strength of weak cooperation: A case study on flickr. Technical Report arXiv:0802.2317v1, CoRR, 2008. [22] G. Salton. Automatic text processing: the transformation,
analysis, and retrieval of information by computer. Addison-Wesley Longman Publishing Co., Inc., Boston, MA, USA, 1989.
[23] E. Santos-Neto, D. Condon, N. Andrade, A. Iamnitchi, and M. Ripeanu. Individual and social behavior in tagging systems. In C. Cattuto, G. Ruffo, and F. Menczer, editors,
Proceedings of the 20th ACM Conference on Hypertext and Hypermedia (HT), pages 183–192, New York, NY, USA, 2009. ACM.
[24] S. Staab, S. Santini, F. Nack, L. Steels, and A. Maedche. Emergent semantics. Intelligent Systems, IEEE [see also
IEEE Expert], 17(1):78–86, 2002.
[25] L. Steels. Semiotic dynamics for embodies agents. IEEE
Intelligent Systems, 21, 2006.
[26] R. van Zwol. Flickr: Who is looking? In WI ’07:
Proceedings of the IEEE/WIC/ACM International Conference on Web Intelligence, pages 184–190, Washington, DC, USA, 2007. IEEE Computer Society. [27] A. Vázquez, R. Pastor-Satorras, and A. Vespignani.
Large-scale topological and dynamical properties of the Internet. Phys. Rev. E, 65:066130, 2002.
[28] T. V. Wal. Explaining and showing broad and narrow folksonomies, 2005.
http://www.personalinfocloud.com/2005/02/ /explaining_and_.html.