HAL Id: hal-01806136
https://hal.archives-ouvertes.fr/hal-01806136
Submitted on 5 May 2021
HAL is a multi-disciplinary open access
archive for the deposit and dissemination of
sci-entific research documents, whether they are
pub-lished or not. The documents may come from
teaching and research institutions in France or
abroad, or from public or private research centers.
L’archive ouverte pluridisciplinaire HAL, est
destinée au dépôt et à la diffusion de documents
scientifiques de niveau recherche, publiés ou non,
émanant des établissements d’enseignement et de
recherche français ou étrangers, des laboratoires
publics ou privés.
cores using noble gases
Anais Orsi, Kenji Kawamura, John Fegyveresi, Melissa Headly, Richard Alley,
Jeffrey Severinghaus
To cite this version:
Anais Orsi, Kenji Kawamura, John Fegyveresi, Melissa Headly, Richard Alley, et al.. Differentiating
bubble-free layers from melt layers in ice cores using noble gases. Journal of Glaciology, International
Glaciological Society, 2015, 61 (227), pp.585 - 594. �10.3189/2015JoG14J237�. �hal-01806136�
Differentiating bubble-free layers from melt layers in ice cores
using noble gases
Anais J. ORSI,
1;2Kenji KAWAMURA,
3;4;5John M. FEGYVERESI,
6Melissa A. HEADLY,
1Richard B. ALLEY,
6Jeffrey P. SEVERINGHAUS
11Scripps Institution of Oceanography, University of California, San Diego, La Jolla, CA, USA 2Laboratoire des Sciences du Climat et de l’Environnement, CEA Saclay, Gif-sur-Yvette, France
3National Institute of Polar Research, Tachikawa, Tokyo, Japan
4Department of Polar Science, The Graduate University for Advanced Studies (SOKENDAI), Tachikawa, Tokyo, Japan 5Institute of Biogeosciences, Japan Agency for Marine–Earth Science and Technology, Yokosuka, Japan.
6Department of Geosciences, The Pennsylvania State University, University Park, PA, USA Correspondence: Anais J. Orsi <[email protected]>
ABSTRACT. Melt layers are clear indicators of extreme summer warmth on polar ice caps. The visual identification of refrozen meltwater as clear bubble-free layers cannot be used to study some past warm periods, because, in deeper ice, bubbles are lost to clathrate formation. We present here a reliable method to detect melt events, based on the analysis of Kr/Ar and Xe/Ar ratios in ice cores, and apply it to the detection of melt in clathrate ice from the Eemian at NEEM, Greenland. Additionally, melt layers in ice cores can compromise the integrity of the gas record by dissolving soluble gases, or by altering gas transport in the firn, which affects the gas chronology. We find that the easily visible 1 mm thick bubble-free layers in the WAIS Divide ice core do not contain sufficient melt to alter the gas composition in the core, and do not cause artifacts or discontinuities in the gas chronology. The presence of these layers during winter, and the absence of anomalies in soluble gases, suggests that these layers can be formed by processes other than refreezing of meltwater. Consequently, the absence of bubbles in thin crusts is not in itself proof of a melt event.
KEYWORDS: ice and climate, ice core, meltwater chemistry, polar firn, surface melt
INTRODUCTION
Melt layers in ice sheets form during exceptionally warm conditions. Records of melt layers in ice cores can therefore give insight into changes in summertime peak temperatures, recording the frequency of extremely warm summers (Herron and others, 1981; Langway and Shoji, 1990; Alley and Anandakrishnan, 1995; Kameda and others, 1995; Das and Alley, 2008).
Melt also significantly decreases the albedo of the snow surface, which triggers a positive feedback. As a result, it is useful to understand the history of surface melting in order to successfully model the radiative balance of an ice sheet (e.g. Tedesco and others, 2008, 2011; Box and others, 2012). In addition, the study of recent melt events is important for estimating the mass balance of the ice sheet, because refrozen meltwater is not lost from the ice sheet, and affects firn density and thus mass-balance estimates from repeated altimetry (e.g. Pfeffer and others, 1990, 1991; Harper and others, 2012; Forster and others, 2014; Morris and others, 2014). The observed correlation of melt layers between different ice-core sites shows that melt layers often arise from widespread meteorological events, and can reflect regional climate conditions (Kameda and others, 1995; Das and Alley, 2008). Satellite imaging of recent melt events that extended over much of Greenland (Tedesco and others, 2008; Nghiem and others, 2012; Hall and others, 2013; McGrath and others, 2013) supports this view.
When the surface or near-surface snow melts, the liquid water percolates down into the firn and spreads along thin, near-surface crusts, subsequently refreezing into a melt layer
when the air temperature lowers, or incoming radiation drops (Langway and Shoji, 1990; Pfeffer and Humphrey, 1998; Das and Alley, 2005; Wong and others, 2013). Melt layers appear in bubbly ice cores as near-horizontal, typically irregular or discontinuous bands of ice with few, oddly shaped or sized, air bubbles, typically 1–100 mm thick (Fig. 1; Langway and Shoji, 1990; Das and Alley, 2005). The visual identification of melt layers can be complicated by another type of bubble-free feature: thin crusts, usually a single grain in thickness (�1 mm), which are observed in all seasons (Fujii and Kusunoki, 1982; Alley and Anandakrishnan, 1995). The origin of these crusts is poorly understood, and they probably have multiple origins (Alley, 1988), including glazing by wind action (Albert and others, 2004), vapor transfer (Fujii and Kusunoki, 1982) or even some slight melting (Alley and Anandakrishnan, 1995). Prior interpretations of melt features generally have been restricted to thicker, nearly bubble-free layers, which include other indications of melt, such as large grains, anomalously large, elongated bubbles, and lenticular shape (Langway and Shoji, 1990; Alley and Anandakrishnan, 1995; Das and Alley, 2005).
As we explore further back in time using deeper ice, melt layers are harder to identify due to thinning of the layers with depth and air clathrate formation. Air clathrates form when the pressure is sufficient to change the air bubble within the ice into a solid phase, in which the air is surrounded by water molecules, forming a lattice (Miller, 1969).
At sufficiently great depth, typically below 1250 m (Fitzpatrick and others, 2014), the air bubbles have com-pletely changed to air clathrates, thus precluding visual
identification of melt layers. As a result, a chemical identification of melt layers is essential to study melt events during warm periods beyond the Holocene, for instance the last interglacial (NEEM community members, 2013).
Melt layers have a strong influence on the gas com-position of the ice core: soluble gases (e.g. carbon dioxide, methane, nitrous oxide, krypton and xenon) can dissolve in the liquid water before it freezes, and induce very high concentrations of these gases in the ice core (Ahn and others, 2008; NEEM community members, 2013). While CH4and N2O are clearly elevated in melt layers, these gases
may also be produced by microbes in ice, so they cannot serve as reliable indicators of refrozen meltwater (NEEM community members, 2013).
We present here a method to use noble gases as a reliable test of the presence of refrozen meltwater in ice-core samples, and describe two applications: testing for the presence of melt events during the Eemian at the NEEM (North Greenland Eemian Ice Drilling) ice-core site, and analyzing the composition of the pervasive bubble-free layers present in the West Antarctic Ice Sheet (WAIS) Divide ice-core site.
MELT-LAYER DETECTION USING KRYPTON AND XENON IN ICE CORES
Krypton and xenon are highly soluble in liquid water, and both are more soluble than argon. Therefore, Kr/Ar and Xe/ Ar ratios are higher in melted and refrozen ice than within air bubbles in ice that has not melted. We show that these noble gas ratios may be used as additional, independent indicators of melt layers in ice cores.
Theory
Fractionation due to melt
Xenon is approximately four times, and krypton two times as soluble as argon (Table 1; Wood and Caputi, 1966; Weiss, 1970; Weiss and Kyser, 1978). As a result, Kr/Ar and Xe/Ar ratios are higher in melted and refrozen ice than within air bubbles in ice that has not melted, and exhibit a specific relationship.
The solubility equilibrium is expressed in terms of the solubility coefficient �, expressed in mol L 1of liquid water:
½Xe=Ar�water¼ �Xe
�Ar
ð1Þ
We report the ratios (R) in delta notation, d ¼ ðR=Rstandard
1Þ1000, and use modern atmospheric air as our standard. In order to compare the meltwater ratio to the atmospheric ratio, we define SAr¼ �Ar=½Ar�atm, the solubility in liters of
air per atmosphere per liters of liquid, with ½Ar�atmbeing the concentration of argon in the atmosphere (mol L 1atm 1).
The solubility ratios of Xe and Kr with Ar are therefore ½Xe=Ar�water
½Xe=Ar�atm ¼
�Xe=�Ar
½Xe�atm=½Ar�atm ¼
SXe SAr �4:36 ð2Þ ½Kr=Ar�water ½Kr=Ar�atm ¼ �Kr=�Ar
½Ar�atm=½Kr�atm ¼
SKr SAr
�2:04 ð3Þ We can also express these as d(Xe/Armelt) = (4.36 – 1)1000 =
3360 ‰, and similarly, d(Kr/Armelt) = 1004‰.
Therefore, it appears that not only are samples containing refrozen melt enriched in Kr/Ar and Xe/Ar in comparison to non-melted ice, but a pure melt end-member will also show a unique relationship between d(Kr/Ar) and d(Xe/Ar), with a slope of �3.3.
The refreezing process contributes to the exclusion of atoms and molecules whose size is larger than that of the crystal spacing of the ice, which includes Ar, Kr and Xe (Top and others, 1988). Experiments done on the growth of frazil ice (Top and others, 1988) and on the freezing of lake water show that 1–50% of the noble gases are retained, likely depending on the freezing rate, and that there is no clear indication of fractionation of Kr/Ar or Xe/Ar during re-freezing (Malone and others, 2010).
Gravitational fractionation
In non-melted ice, measured Kr/Ar and Xe/Ar are primarily affected by gravitational fractionation (Craig and Wiens, 1996). Gravitational fractionation is a process in which heavier isotopes are preferentially concentrated with in-creasing depth in firn. According to Craig and others (1988), gravitational fractionation is described by the barometric equation modified for a gas pair:
dgrav¼ exp �mgZ R0T � � 1 � � 1000 � �mgZ R0T 1000 ð4Þ where dgrav is the gravitational fractionation of an isotope
pair, g is the local gravitational acceleration, Z is the thickness of the firn, �m is the mass difference between the two isotopes, R0 is the gas constant and T (K) is the
temperature of the firn column. The mass difference
Table 1. Parameter values. Solubility coefficients (�) are calculated
at 0°C (Weiss and Kyser, 1978; Hamme and Emerson, 2004). Gas transfer velocities (kc) are from Nicholson and others (2010) and
Cole and others (2010), with Schmidt numbers from Jähne and others (1987). p, �, S and kcare given for the bulk Kr and Xe rather
than for a specific isotope
40Ar 36Ar Kr Xe m (10 3kg mol 1) 40 36 84 132 p 9.34 � 10 3 1.14 � 10 6 3.1 � 10 7 �(µmol/Lw) 22.30 22.27 5.553 � 10 3 9.047 � 10 4 S (Lair/Lw/atm) 0.05349 0.05342 0.10912 0.2329 S=SAr 1 0.9988 2.04 4.36 kc(10 6m s 1) 3.68 3.70 3.13 2.73
Fig. 1. Melt layers from the NEEM (North Greenland) ice core at
44.3 m. This melt event is dated to AD1888. Photo courtesy of Kaitlin Keegan.
�m = 96 for d(Xe/Ar), and it is �m = 48 for d(Kr/Ar). As a
result, we expect a d(Xe/Ar) vs d(Kr/Ar) slope of 2 in gas samples from non-melted ice.
Gas loss
Kr/Ar and Xe/Ar ratios can also be affected by gas loss during air bubble close-off and during core storage. Gas loss affects molecules with a diameter smaller than 3.6 Å (3.6 � 10 10m), including Ar and O
2but not N2, Kr and Xe
(Bender and others, 1995; Severinghaus and Battle, 2006). As a result, gas loss will cause Kr/Ar and Xe/Ar to be slightly higher than expected. In order to remove the effects of gas loss, we can compute d(Xe/Kr), which is independent of Ar: dðXe=KrÞ ¼ dðXe=ArÞ 1000 þ1 dðKr=ArÞ 1000 þ1 1 ! 1000 ð5Þ
We expect that for meltwater, d(Xe/Kr) � 1177‰. A sample with refrozen melt will have elevated d(Xe/Kr).
Analysis of Kr/Ar and Xe/Ar in known melt layers
The ice-core samples analyzed in the first part of this study were from the Holocene, taken from the Dye 3 ice core. Dye 3 is a site in South Greenland (65° N, 43° W; 2480 m a.s.l.), with a mean annual temperature of –21°C and an annual accumulation rate of 0.49 m a 1
(Dahl-Jensen and Johnsen, 1986). The core contains numerous visible melt layers, identified as horizontal bands of ice with few air bubbles, a few mm to a few cm thick (Langway and Shoji, 1990). We analyzed samples containing melt layers at 144 m. We also sampled ice that did not contain visible melt layers at 143–145 m depth, and refer to it as non-melted ice. The ice-core Kr/Ar and Xe/Ar are measured following the technique outlined by Severinghaus and others (2003) and Headly and Severinghaus (2007). Ice samples are typically 50–60 g each, measured in duplicate or triplicate for a given depth. The standard used in these measurements is air collected from the Scripps pier in La Jolla, CA, USA. The method used to collect the air is described in Headly and Severinghaus (2007).
The d(Kr/Ar) and d(Xe/Ar) measured in Holocene ice from the Dye 3 ice core are shown in Table 2 and Figure 2. The data show different trends in melted versus non-melted ice. The d(Kr/Ar) and d(Xe/Ar) in melt layers are clearly enriched compared with those of non-melted ice. The melt-layer values range from 30‰ to 63‰ for d(Kr/Ar), and 69‰ to 168‰ for d(Xe/Ar). Non-melted ice samples from Dye 3, in contrast, have d(Kr/Ar) values of 13.0 � 2.0‰, and d(Xe/Ar) of 24.5 � 3.8‰. There are large variations of d(Kr/Ar) and d(Xe/Ar) for replicate samples of melt layers from the same depth, which shows that d(Kr/Ar) and d(Xe/Ar) are not quantitative indicators of melt intensity, or that the fraction of refrozen meltwater varies strongly over short distances (Table 2).
We also find that the slope of d(Xe/Ar) vs d(Kr/Ar) is 3.01, which is in agreement with that predicted from theory for gases at solubility equilibrium, and confirms that the possible expulsion of gases during refreezing does not alter the melt signature in the ice. The slope of d(Xe/Ar) vs d(Kr/Ar) for non-melt samples is 1.77, which is slightly lower than the expected slope (2) due to gravitational fractionation, possibly due to an incomplete degassing of Xe in the sample.
Quantification of the amount of melt
A typical ice-core sample contains both air from bubbles (called Arairin the following) and from dissolved gas (called
Armelt). In order to quantify the amount of refrozen water in a
sample, we model the respective contributions of (1) gravita-tional fractionation, (2) melt and (3) gas loss as follows (units are moles of gas):
nð36ArÞsample¼nð36ArÞairþnð36ArÞmelt nð36ArÞloss
nð40ArÞsample¼nð40ArÞairþnð40ArÞmelt nð40ArÞloss
nðKrÞsample ¼nðKrÞairþnðKrÞmelt nðXeÞsample ¼nðXeÞairþnðXeÞmelt
ð6Þ
The ‘air’ terms (e.g. nðArÞair) in Eqns (6) represent the abundance of each gas in the air bubble within the ice core. The abundance in the air bubbles reflects both the atmos-pheric abundance at the time the air was trapped (e.g. Aratm), as well as the effects of gravitational fractionation on
the gases in the firn. The concentration of argon in the air bubbles ½Ar�air is related to the atmospheric concentration ½Ar�atmas
½Ar�air¼ ½Ar�atmexp ðmArgZ=ðR0TÞÞ ð7Þ
If we denote Vbthe volume of the air bubbles, the number of
moles of argon in the air bubbles is nðArairÞ ¼Vb½Ar�air.
The ‘melt’ terms reflect the enrichment of these gases due to the presence of melt layers. Argon, krypton and xenon are partially expelled during freezing; thus, a portion of the refrozen melt will be gas-free, and will not contribute to anomalies in ice-core gas composition. We quantify the volume of refrozen water that retained the melt signature Vl
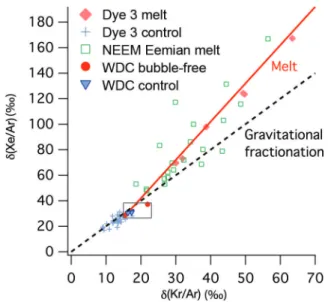
Fig. 2. Melt layer identification. When d(Kr/Ar) and d(Xe/Ar) are
high, they indicate the presence of melt, as can be seen in Dye 3 melt layer samples (solid diamonds), compared to non-melt samples (+). NEEM Eemian samples are shown in large squares. The analytical precision is better than 0.8‰ for d(Kr/Ar) and 2.9‰ for d(Xe/Ar), which is approximately the size of the markers. WAIS Divide bubble-free layers (filled circles) do not have anomalously high d(Kr/Ar) and d(Xe/Ar), which indicates that they do not contain a significant amount of melt. The box shows the range of values found in the WDC05A ice core. The dashed line indicates gravitational fractionation, and the solid lines indicate the fraction-ation due to melt.
and find that the quantity of dissolved gas follows
nðArmeltÞ ¼Vl�Ar¼VlSAr½Ar�atm ð8Þ
The36Ar
lossterm represents Ar loss due to gas loss from the
ice core. Gas loss typically causes d40Ar=36Ar in the air that remains in an air bubble to be positively enriched by 0.007‰ per 1‰ dðKr=ArÞ enrichment (Severinghaus and others, 2003). Therefore,40Ar is slightly less depleted by gas loss
than36Ar: nð40ArÞ
loss¼0:993ðnð36ArÞlossÞ. We denote � as
the fraction of gas lost, so we can write
½36Ar�loss¼ �½36Ar�air¼ �½36Ar�atmexpðm36gZ=ðR0TÞÞ ð9Þ
We use atmospheric air as our standard gas. If we denote V the total volume of gas in the sample, the number of moles of argon in the reference gas is nðArstandardÞ ¼V½Ar�atm. This
implies that the ratio of sample to standard is
Rð36ArÞ ¼ nð36ArÞsample=nð36ArÞstandard ¼Vbð1 �Þ½
36
Ar�atmexp mð 36gZ= Rð 0TÞÞ þVlS36½36Ar�atm V½36Ar�atm ¼Vb V ð1 �Þexp mð 36gZ= Rð 0TÞÞ þ Vl Vb S36 � �
We note � ¼ Vl=Vbthe ratio of the volume of liquid water to
the volume of gas in the bubbles. The equation becomes
Rð36ArÞ ¼Vb
V ðð1 �Þexpðm36gZ=ðR0TÞÞ þ �S36Þ ð10Þ
Following the same pattern for the other observed gases, we can rewrite the system of Eqn (6) in terms of our observations (d40Ar=36Ar, dKr=Ar and dXe=Ar) and the three parameters
Table 2. Measurements of the Dye 3 ice core. Samples with visible melt layers are shown in bold font (144.2–144.31 m and 144.47–
144.6 m). Replicates from the same depth are labeled a, b, c, etc. The air content (column 4) is expressed as the ratio of the sample with respect to the mean of all non-melt samples. The rightmost three columns show the calculated diffusive column height Z, the gas loss fraction � and the melt fraction �. The mean and standard deviation of all non-melt samples give an idea of the expected sample-to-sample variability. The pooled standard deviation �pooleddescribes the measurement error
Data Model
Depth Rep. Mass Air cont. d40Ar d(Kr/Ar) d(Xe/Ar) Z � �
m g ‰ ‰ ‰ m 143.195–143.315 a 47.6 1.047 0.725 9.35 16.87 37.07 0.001 0.000 143.195–143.315 b 53.8 1.021 0.695 8.99 18.61 35.72 0.000 0.010 143.195–143.315 c 50.3 1.029 0.717 10.19 21.84 36.78 0.000 0.024 143.195–143.315 d 40.8 0.997 0.954 9.15 19.48 49.12 0.000 0.000 143.315–143.42 a 50.3 1.003 0.909 11.82 27.96 44.69 0.000 0.035 143.315–143.42 b 51 0.985 0.915 13.20 19.20 46.25 0.002 0.000 143.315–143.42 c 49.3 1.024 0.924 12.00 24.26 47.39 0.000 0.008 143.315–143.42 d NaN NaN 0.916 12.34 23.81 46.70 0.001 0.003 143.415–143.52 a 51.2 1.040 0.990 12.03 23.29 50.91 0.000 0.000 143.415–143.52 b 49.1 1.063 1.013 12.74 25.31 51.97 0.000 0.002 143.415–143.52 c 51.2 1.002 0.984 10.93 17.68 50.66 0.000 0.000 143.63–143.73 a 57.6 0.972 1.019 14.22 25.36 51.69 0.002 0.000 143.63–143.73 b 51.5 0.980 1.023 15.49 25.54 51.42 0.003 0.000 143.63–143.73 c 52.9 0.853 0.935 13.30 29.03 48.06 0.000 0.036 143.78–143.88 a 51.5 0.980 0.905 11.95 22.38 46.17 0.001 0.000 143.78–143.88 b 48.1 1.018 0.949 13.86 31.21 48.56 0.000 0.047 143.88–143.99 a NaN NaN 0.997 13.29 23.81 50.82 0.001 0.000 143.88–143.99 b NaN NaN 0.978 12.48 23.86 50.06 0.001 0.000 143.88–143.99 c NaN NaN 0.980 13.46 22.41 49.80 0.002 0.000 144.03–144.13 a 54 1.025 1.026 14.33 23.19 52.04 0.002 0.000 144.03–144.13 b 53.4 0.997 1.014 14.03 27.25 51.64 0.002 0.008 144.03–144.13 c 50.3 1.012 1.020 13.57 24.43 52.00 0.001 0.000 144.2–144.31 a 55.7 0.837 0.947 30.05 69.54 46.23 0.007 0.234 144.2–144.31 b 57.3 0.717 0.930 49.32 124.25 43.71 0.010 0.537 144.2–144.31 c 56.7 0.804 0.972 38.73 97.88 47.51 0.006 0.397 144.2–144.31 d 57.3 0.758 0.958 49.74 123.47 44.90 0.011 0.524 144.31–144.37 a 46.5 0.985 1.049 17.43 28.05 52.13 0.005 0.000 144.31–144.37 b 53 0.992 1.018 16.39 30.54 51.12 0.004 0.016 144.37–144.47 a 53.3 1.019 0.958 13.08 25.22 48.80 0.001 0.005 144.37–144.47 b 55.7 1.040 0.983 13.72 27.87 50.24 0.001 0.018 144.37–144.47 c 53.4 1.069 0.950 12.80 24.88 48.46 0.001 0.005 144.47–144.6 a 56.7 0.909 0.986 31.91 73.14 47.94 0.007 0.245 144.47–144.6 b 51.1 0.929 1.022 63.45 167.26 48.16 0.011 0.778 144.54–144.6 a 56.9 0.992 0.988 14.82 27.71 49.89 0.003 0.008 144.54–144.6 b 59.2 0.993 1.007 14.21 27.52 51.21 0.002 0.009 Non-melt mean 1 0.951 12.96 24.46 48.38 0.0013 0.008 Non-melt std 0.317 0.093 2.01 3.75 4.62 0.0013 0.013 �pooled 0.054 0.74 2.87 0.83 0.0004 0.0058
(Z, �, �): ð40Ar=36ArÞsample
ð40Ar=36ArÞatm ¼ d40Ar 1000þ1 � � ¼ð1 0:993�Þ expðm40gZ=ðR0TÞÞ þ �S40 ð1 �Þexpðm36gZ=ðR0TÞÞ þ �S36 ðKr=36ArÞsample ðKr=36ArÞatm ¼ dðKr=ArÞ 1000 þ1 � � ¼ expðmKrgZ=ðR0TÞÞ þ �SKr ð1 �Þexpðm36gZ=ðR0TÞÞ þ �S36
ðXe=36ArÞsample ðXe=36ArÞatm ¼
dXe=Ar 1000 þ1 � � ¼ expðmXegZ=ðR0TÞÞ þ �SXe ð1 �Þexpðm36gZ=ðR0TÞÞ þ �S36 ð11Þ To solve the system of equations above, we calculate Z, � and � by iterated linearized inversion. The results from six different melt-layer samples from shallow ice from the Dye 3 ice core are shown in Table 2. The calculated firn depth Z and gas loss � are consistent in all replicates, but the wide range of values for �, the volume ratio of refrozen meltwater to bubble air, shows that the extent of melt is not a spatially uniform parameter in an ice-core sample.
MELT EVENTS DURING THE LAST INTERGLACIAL AT NEEM
The last interglacial, the Eemian (130–115 kaBP), was warmer than the current interglacial in many places including Greenland, owing to higher insolation forcing (Francis and others, 2006; Otto-Bliesner, 2006; Axford and others, 2011; Masson-Delmotte and others, 2011; Lunt and others, 2012). A recent study at the NEEM site in North Greenland (77.45° N, 51.06° W; 2450 m a.s.l.; –29°C) shows that the temperature may have been 8 � 4°C warmer than present at constant elevation (NEEM community members, 2013). The analysis of CH4 and N2O in NEEM
ice shows brief intervals of very high concentrations: up to 2000 ppb in CH4for a background of �750 ppb, and up to
400 ppb in N2O for a background of 250 ppb. However,
these values are higher than can be explained by solubility alone, and point towards a significant contribution of in situ production of CH4and N2O by microbes present in the ice
(NEEM community members, 2013).
We measured d40Ar, d(Kr/Ar) and d(Xe/Ar) in NEEM samples from the Eemian, between 2398 and 2403 m, and found d(Kr/Ar) values between 17.73‰ and 56.47‰, and d(Xe/Ar) values between 22.60‰ and 166.94‰ (Fig. 3). In order to save precious ice, we used 30 g, 3.5 cm samples, and diluted them 20 times with pure N2. The rest of the
analytical method is the same as for Dye 3 samples (Severinghaus and others, 2003). We calculated the melt fraction (�) of all samples, and found that 21 out of 39 samples had � > 0:1, corresponding to at least 1% of the mass of the sample being refrozen water (1 mL of air is typically found in a 10 g ice-core sample). These measure-ments confirm the presence of melt layers in the interval 127–118.3 ka BP.
Very few melt layers have been observed at the NEEM ice-coring site above the clathrate transition, although the extreme heatwave of 12–15 July 2012 produced melt at
NEEM, as well as on >98.6% of the Greenland ice sheet (Nghiem and others, 2012; McGrath and others, 2013). Contrary to the Dye 3 samples (65° N, 44° W; –21°C), which contained melt from a single event, the NEEM Eemian samples each cover about a decade. Yet the melt fractions are comparable, with three samples above � ¼ 0:5. This suggests that the magnitude and/or frequency of Eemian melt events was larger than in the Holocene at Dye 3, which is consistent with up to 8 � 4°C higher temperature, and high summer insolation (NEEM community members, 2013).
The presence of melt layers at NEEM during the Eemian confirms that the additional warmth had a strong summer component, which is consistent with the fact that the eccentricity was much higher during the last interglacial than during the Holocene, enhancing the impact of precession and seasonal contrasts at that time.
ANALYSIS OF BUBBLE-FREE LAYERS IN THE WAIS DIVIDE ICE CORE
The WAIS Divide ice core provides the highest-resolution gas record of the last 60 000 years (e.g. Marcott and others, 2014). The WAIS Divide site is located in Antarctica (79° S, 112° W; –29°C, 0.22 m ice a 1), where dust fluxes are
minimal, and in situ production of greenhouse gases is much smaller than in Greenland. It is also in a high-accumulation region, which allows for a small gas-age–ice-age difference (�500 years at the Last Glacial Maximum (Buizert and others, 2014)), and a small uncertainty in the gas chronology, including during Termination 1, unlike existing East Antarctic deep ice cores such as Dome C or Vostok.
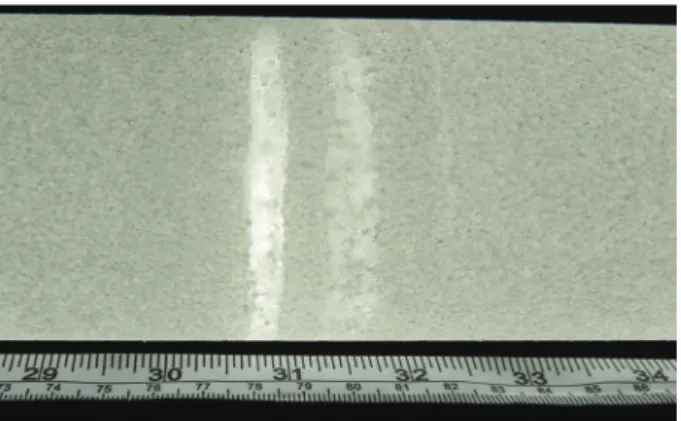
Upon physical inspection of the core, we noticed a very large number of bubble-free layers, �1–2 mm thick (Fig. 4), at a rate of �15 (m (ice)) 1, or 4 a 1. They are visible in
layers deposited during all seasons, with a higher occur-rence in the late summer, as measured using the position relative to the summer peak of the annual-layer counted timescale (WAIS Divide Project Members, 2013; Fegyveresi,
Fig. 3. Measurements of d40Ar, d(Kr/Ar) and d(Xe/Ar) in the Eemian section of the NEEM ice core. The dashed line on top shows the modeled melt fraction, inferred from the measurements. Elevated d(Kr/Ar) and d(Xe/Ar) are clear evidence of the presence of melt in the ice core.
2014). They can only be detected in the first 600 m of the core: the bubbles disappear in the deeper part of the core, due to the formation of air hydrates under high hydrostatic pressure, making the ice clear, and the bubble-free layers visibly indistinguishable from the rest of the ice (Fitzpatrick and others, 2014).
Similar bubble-free layers have been documented in other ice cores (Fujii and Kusunoki, 1982; Alley, 1988; Alley and Anandakrishnan, 1995) and have been interpreted as the remnants of surface crusts, which can be several mm thick, but typically much thinner. These crusts can have multiple origins, and current understanding includes the possibility that some crusts may contain refrozen meltwater. It is important for the accuracy of the gas record to know whether these layers contain sufficient melt to compromise the soluble gas record, and whether they affected gas diffusion through the firn, thereby complicating the gas chronology.
Influence on gas composition
To test for the presence of significant melt, we analyzed two samples containing bubble-free layers, and three control samples, taken between 114 and 147 m in the WDC05A ice core, which was collected at the site the year before the main deep core (Ahn and others, 2012). All of these samples were taken from mature ice, well below the bubble-closure depth, which is at �78 m at WAIS Divide (Battle and others, 2011). Each sample was prepared using a bandsaw to cut across the core, extracting a slab �5 mm thick containing the 1 mm crust. Several slabs were pooled into one 600 g sample. Control samples consisted of the same number of slabs of bubbly ice, taken from neighboring ice (Table 3). The samples were melted under vacuum to release the trapped air. The air sample was then exposed to a Zr/Al
getter at 900°C to remove N2, O2and other reactive gases,
and the resulting gas was expanded into a MAT 252 mass spectrometer to measure d40Ar, d86=82Kr, d(Kr/Ar), d(Xe/Ar) and d(Ne/Ar) (Orsi, 2013).
The first bubble-free sample is slightly elevated in Kr and Xe: when compared to the standard deviation of all ice-core measurements taken together (noted �all), d(Kr/Ar) is 5.4�all
higher than the control samples, and d(Xe/Ar) is 4.5�all
higher than the control samples (Table 3). However, we have used very thin samples, which can be subject to the loss of argon through cut bubbles and permeation (Sever-inghaus and Battle, 2006). We calculated the respective contributions of gravitational fractionation, gas loss and melt for all samples (Table 3), and found more gas loss than other samples (� ¼ 0:007 � 0:0004), and a melt contribution that is not statistically significant (� ¼ 0:0026 � 0:0024).
We thus conclude that the 1 mm bubble-free layers in the WAIS Divide ice core are unlikely to contain any significant amount of melt, and do not alter the gas composition of the ice core. This observation is confirmed by the studies of CO2
in the same WDC05A core, which show no sensitivity to the presence of a bubble-free layer in a sample (Ahn and others, 2009). The absence of melt is also supported by the observation that the bubble-free layers occur in winter as well as in summer (Fegyveresi, 2014). A possible mech-anism for the formation of a bubble-free layer is the infilling of pores by condensation on a surface crust during times of subsurface temperature inversion (Fujii and Kusunoki, 1982). This is consistent with the prevalence of these layers in late summer, when the surface is cooler than the firn (Fegyveresi, 2014), and suggests that we may be able to use the frequency and thickness of bubble-free layers as a proxy for the occurrence of surface temperature inversions. The formation of these layers could also involve other mechan-isms and is the subject of another paper (Fegyveresi, 2014).
Influence on gas diffusion
Gases diffuse through the firn before getting locked in within a zone in which the air is separated from the atmosphere, at �66 m depth at WAIS Divide (Battle and others, 2011). The firn matrix determines the effective gas diffusivity, which impacts the width of the age distribution of bubble air, and the lock-in horizon, which determines the age difference between gases and ice, and ultimately the gas chronology. The presence of an impermeable layer can thus sharpen the gas age distribution by preventing diffusion, and create an abrupt change in the gas chronology.
Fig. 4. A pair of bubble-free layers in the WDC05A core. The layers
are 1 mm thick. Black in this image represents clear ice, and bubbles appear white. Photo by John Fegyveresi.
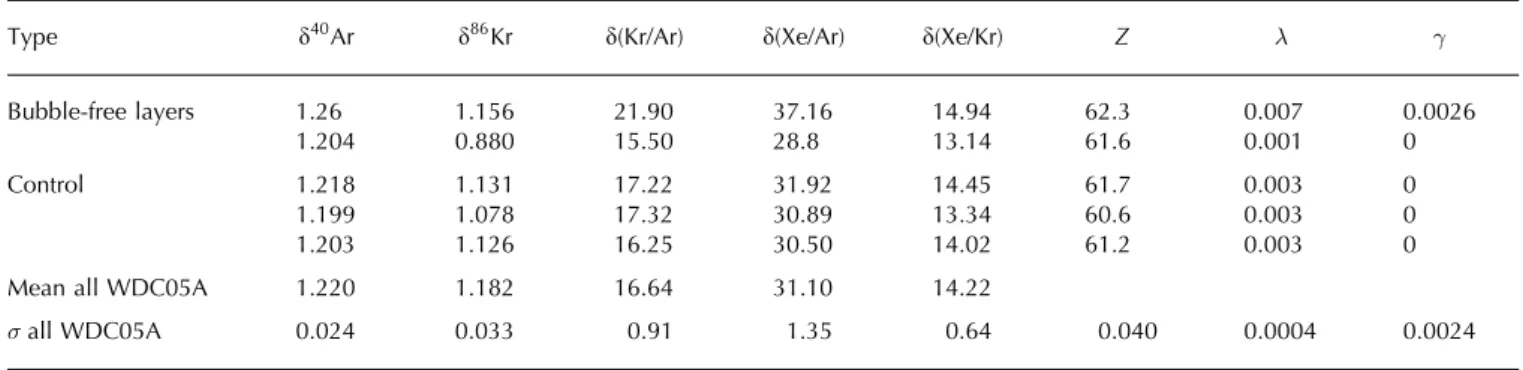
Table 3. Analysis of bubble-free layers in the WDC05A ice core. The d values are given in ‰ with respect to modern air. Z, � and � are the
outputs of the melt layer model. The bottom two rows show the mean and standard deviation of 73 WDC05A samples measured from 38 depths between 78 and 300 m. The uncertainty in the modeled Z, � and � is calculated by a Monte Carlo perturbation with variances corresponding to the bottom row of the table, and is also shown in the bottom row
Type d40Ar d86Kr d(Kr/Ar) d(Xe/Ar) d(Xe/Kr) Z � �
Bubble-free layers 1.26 1.156 21.90 37.16 14.94 62.3 0.007 0.0026
1.204 0.880 15.50 28.8 13.14 61.6 0.001 0
Control 1.218 1.131 17.22 31.92 14.45 61.7 0.003 0
1.199 1.078 17.32 30.89 13.34 60.6 0.003 0
1.203 1.126 16.25 30.50 14.02 61.2 0.003 0
Mean all WDC05A 1.220 1.182 16.64 31.10 14.22
When they are in the firn, bubble-free layers are likely to have lower permeability than the surrounding firn. We were actually unable to find ice lenses in 2 m snow pits dug in 2008, 2009 or 2010, but we found evidence for numerous hard ‘crusts’ (Fig. 5c). In addition, these crusts typically have a limited spatial extent, on the order of 3 m � 10 m, and they can be broken by what looks like thermal-contraction cracks, through which gases can flow (Fig. 5b).
Wind crusts are composed of well-sintered but clearly separate snow grains (e.g. Alley, 1988). Permeability measurements on samples with wind crusts at Greenland Summit confirm that they are permeable. For example, samples of firn containing crusts from �7 m depth in the firn have permeability ranging from 25 to 33.8 � 10 10m2,
which is well within the range of permeability commonly found in near-surface firn (e.g. Albert and Shultz, 2002).
In fact, even melt layers have been measured to have nonzero permeability. The permeability of ice layers resulting from melt has been measured from the NEEM core; these layers (Keegan and others, 2014), and also ice layers measured in seasonal snowpacks (Albert and Perron, 2000), all show that bulk samples containing naturally formed melt layers have a permeability above 3 � 10 10m2.
Although there are numerous fine-grained, sintered crusts in the WAIS Divide firn, there is no evidence of any discontinuity or impedance in gas diffusion (Battle and others, 2011). The lack of discontinuity in the CO2record, a
gas with changing atmospheric history, has also shown that there is no stratigraphic disturbance over a bubble-free layer (Ahn and others, 2009). This evidence illustrates the fact that gases are sensitive to bulk permeability at a scale larger than the diameter of a typical ice core, and that the presence of low-permeability layers of limited spatial extent does not have a measurable impact on gas diffusion in the open firn. We conclude from these observations that the presence of bubble-free layers does not compromise the integrity of the gas record at WAIS Divide.
CONCLUSION
Melt layers in ice cores have been identified visually by their absence of bubbles, by the lower air content and by elevated CH4 or N2O, but each of these methods has limitations:
elevated CH4or N2O can be due to the presence of microbes
in the ice (NEEM community members, 2013), air content is not necessarily lowered in a sample containing a melt layer (Table 3) and bubble-free layers are not easily visually recognizable in deep ice. In this paper, we have shown that the analysis of Kr/Ar and Xe/Ar is a robust method to identify melt layers, and can be used to detect warm-summer events during the Eemian at NEEM. The presence of a large amount of melt in NEEM Eemian ice confirms that Greenland was warmer than at present, and that the additional warmth had a strong summer component.
The WAIS Divide ice core contains many 1 mm thick bubble-free layers. These layers do not contain any signifi-cant amount of refrozen meltwater, and do not measurably impede gas flow in the firn. In this respect, they do not interfere with the gas record. The presence of these layers during winter, and the absence in them of anomalously high concentrations of soluble gases, suggests that they can be formed by processes other than melt, perhaps by the infilling of pores by condensation on a surface crust during periods of subsurface temperature inversion. These results point out
that the visual identification of the absence of bubbles in thin crusts is not in itself proof of a melt event.
ACKNOWLEDGEMENTS
This work was supported by US National Science Founda-tion (NSF) grants 0440701, 0538630, 0521642, 0944343 and 0806377 to J.P.S, 1142085 and 1043528 to R.B.A., and Japan Society for the Promotion of Science (JSPS) KAKENHI grants 22221002, 21671001 and 26241011 to K.K. Joan Fitzpatrick assisted with the imaging of bubble sections. We appreciate the support of the WAIS Divide Science Coordination Office at the Desert Research Institute, Reno NE, USA, and University of New Hampshire, USA, for the collection and distribution of the WAIS Divide ice core and related tasks (NSF grants 0230396, 0440817, 0944348 and 0944266). Kendrick Taylor led the field effort that collected the samples. The NSF Office of Polar Programs also funded the Ice Drilling Program Office (IDPO) and Ice Drilling Design and Operations (IDDO) group for coring activities; the National Ice Core Laboratory for curation of the core; Raytheon Polar Services for logistics support in Antarctica; and the 109th New York Air National Guard for airlift in Antarctica. NEEM is directed and organized by the Center of Ice and Climate at the Niels Bohr Institute and US NSF Office of Polar Programs. It is supported by funding agencies and institutions in Belgium (FNRS-CFB and FWO), Canada (GSC), China (CAS), Denmark (FIST), France (IPEV and INSU/CNRS), Germany (AWI), Iceland (RannIs), Japan (NIPR), Korea (KOPRI), the Netherlands (NWO/ALW), Sweden (VR), Switzerland (SNF), United Kingdom (NERC) and the United States (US NSF Office of Polar Programs).
Fig. 5. Hard surfaces (‘crusts’) seen at WAIS Divide (a). These crusts
are hard enough that the weight of a person does not puncture through. They can be laced by cracks, likely formed by thermal contraction (b). The thickness of these crusts can be up to 5 mm (c). They are common, but their horizontal extent is limited.
REFERENCES
Ahn J, Headly M, Wahlen M, Brook EJ, Mayewski PA and Taylor KC (2008) CO2 diffusion in polar ice: observations
from naturally formed CO2spikes in the Siple Dome (Antarctica)
ice core. J. Glaciol., 54(187), 685–695 (doi: 10.3189/ 002214308786570764)
Ahn J, Brook EJ and Howell K (2009) A high-precision method for measurement of paleoatmospheric CO2 in small polar ice
samples. J. Glaciol., 55(191), 499–506 (doi: 10.3189/ 002214309788816731)
Ahn J and 7 others (2012) Atmospheric CO2 over the last 1000
years: a high-resolution record from the West Antarctic Ice Sheet (WAIS) Divide ice core. Global Biogeochem. Cycles, 26(2), GB2027 (doi: 10.1029/2011GB004247)
Albert MR and Perron F (2000) Ice layer and surface crust permeability in a seasonal snowpack. Hydrol. Process.,
14(18), 3207–3214 (doi: 10.1002/1099-1085(20001230)
14:183.0.CO;2-C)
Albert MR and Shultz E (2002) Snow and firn properties and air–snow transport processes at Summit, Greenland. Atmos. Environ., 36, 2789–2797 (doi: 10.1016/S1352-2310(02)00119-X)
Albert M, Shuman C, Courville Z, Bauer R, Fahnestock M and Scambos T (2004) Extreme firn metamorphism: impact of decades of vapor transport on near-surface firn at a low-accumulation glazed site on the East Antarctic plateau. Ann. Glaciol., 39(1), 73–78 (doi: 10.3189/172756404781814041) Alley RB (1988) Concerning the deposition and diagenesis of strata
in polar firn. J. Glaciol., 34(118), 283–290
Alley RB and Anandakrishnan S (1995) Variations in melt-layer frequency in the GISP2 ice core: implications for Holocene summer temperatures in central Greenland. Ann. Glaciol., 21, 67–70
Axford Y, Briner JP, Francis DR, Miller GH, Walker IR and Wolfe AP (2011) Chironomids record terrestrial temperature changes throughout Arctic interglacials of the past 200,000 yr. Geol. Soc. Am. Bull., 123(7–8), 1275–1287 (doi: 10.1130/B30329.1) Battle MO and 8 others (2011) Controls on the movement and
composition of firn air at the West Antarctic Ice Sheet Divide. Atmos. Chem. Phys., 11(21), 11 007–11 021 (doi: 10.5194/acp-11-11007-2011)
Bender ML, Sowers T and Lipenkov V (1995) On the concentrations of O2, N2, and Ar in trapped gases from ice cores.J. Geophys.
Res., 100(D9), 18 651–18 660 (doi: 10.1029/94JD02212) Box JE, Fettweis X, Stroeve JC, Tedesco M, Hall DK and Steffen K
(2012) Greenland ice sheet albedo feedback: thermodynamics and atmospheric drivers. Cryosphere, 6(4), 821–839 (doi: 10.5194/tc-6-821-2012)
Buizert C and 9 others (2014) The WAIS-Divide deep ice core WD2014 chronology – Part 2: Methane synchronization (68–31 ka BP) and the gas age–ice age difference. Climate Past Discuss.,
10(4), 3537–3584
Cole, JJ, Bade DL, Bastviken D, Pace ML and Van de Bogert M (2010) Multiple approaches to estimating air–water gas ex-change in small lakes. Limnol. Oceanogr., 8, 285–293 (doi: 10.4319/lom.2010.8.285)
Craig H and Wiens RC (1996) Gravitational enrichment of84Kr/36Ar
ratios in polar ice caps: a measure of firn thickness and accumulation temperature. Science, 271(5256), 1708–1710 (doi: 10.1126/science.271.5256.1708)
Craig H, Horibe Y and Sowers T (1988) Gravitational separation of gases and isotopes in polar ice caps. Science, 242(4886), 1675–1678
Dahl-Jensen D and Johnsen SJ (1986) Palaeotemperatures still exist in the Greenland ice sheet. Nature, 320(6059), 250–252 (doi: 10.1038/320250a0)
Das S and Alley RB (2005) Characterization and formation of melt layers in polar snow: observations and experiments from West Antarctica. J. Glaciol., 51(173), 307–313 (doi: 10.3189/ 172756505781829395)
Das S and Alley RB (2008) Rise in frequency of surface melting at Siple Dome through the Holocene: evidence for increasing marine influence on the climate of West Antarctica. J. Geophys. Res., 113(D2), D02112 (doi: 10.1029/ 2007JD008790)
Fegyveresi JM (2014) Physical properties of the West Antarctic Ice Sheet (WAIS) Divide deep ice core: development, evolution and interpretation. (PhD thesis, The Pennsylvania State University)
Fitzpatrick JJ and 9 others (2014) Physical properties of the WAIS Divide ice core. J. Glaciol., 60(224), 1181–1198 (doi: 10.3189/ 2014JoG14J100)
Forster RR and 12 others (2014) Extensive liquid meltwater storage in firn within the Greenland ice sheet. Nature Geosci., 7(2), 95–98 (doi: 10.1038/ngeo2043)
Francis DR, Wolfe AP, Walker IR and Miller GF (2006) Interglacial and Holocene temperature reconstructions based on midge remains in sediments of two lakes from Baffin Island, Nunavut, Arctic Canada. Palaeogeogr. Palaeoclimatol. Palaeoecol., 236, 107–124 (doi: 10.1016/j.palaeo.2006.01.005)
Fujii Y and Kusunoki K (1982) The role of sublimation and condensation in the formation of ice sheet surface at Mizuho Station, Antarctica. J. Geophys. Res., 87(C6), 4293–4300 (doi: 10.1029/JC087iC06p04293)
Hall DK, Comiso JC, DiGirolamo NE, Shuman CA, Box JE and Koenig LS (2013) Variability in the surface temperature and melt extent of the Greenland ice sheet from MODIS. Geophys. Res. Lett., 40(10), 2114–2120 (doi: 10.1002/grl.50240)
Hamme RC and Emerson SR (2004) The solubility of neon, nitrogen and argon in distilled water and seawater. Deep Sea Res. I,
51(11), 1517–1528 (doi: 10.1016/j.dsr.2004.06.009)
Harper J, Humphrey N, Pfeffer WT, Brown J and Fettweis X (2012) Greenland ice-sheet contribution to sea-level rise buffered by meltwater storage in firn. Nature, 491(7423), 240–243 (doi: 10.1038/nature11566)
Headly MA and Severinghaus JP (2007) A method to measure Kr/N2
ratios in air bubbles trapped in ice cores, and its application in reconstructing past mean ocean temperature. J. Geophys. Res.,
112(D19), D19105 (doi: 10.1029/2006JD008317)
Herron, MM, Herron SL and Langway CC Jr (1981) Climatic signal of ice melt features in Southern Greenland. Nature, 293(5831), 389–391 (doi: 10.1038/293389a0)
Jähne B, Heinz G and Dietrich W (1987) Measurement of the dif-fusion coefficients of sparingly soluble gases in water. J. Geophys. Res., 92(C10), 10 767–10 776 (10.1029/JC092iC10p10767) Kameda T, Narita H, Shoji H, Nishio F, Fujii Y and Wanatabe O
(1995) Melt features in ice cores from Site J, southern Green-land: some implications for summer climate since AD 1550. Ann. Glaciol., 21, 51–58
Keegan K, Albert MR and Baker I (2014) The impact of ice layers on gas transport through firn at the North Greenland Eemian Ice Drilling (NEEM) site, Greenland. Cryosphere, 8(5), 1801–1806 (doi: 10.5194/tc-8-1801-2014)
Langway CC Jr and Shoji H (1990) Past temperature record from the analysis of melt features in the Dye 3, Greenland, Ice Core. Ann. Glaciol., 14, 343–344
Lunt DJ and 9 others (2012) A multi model assessment of last interglacial temperatures. Climate Past, 8, 3657–3691 (doi: 10.5194/cp-9-699-2013)
Malone JL, Castro M, Hall CM, Doran PT, Kenig F and McKay CP (2010) New insights into the origin and evolution of Lake Vida, McMurdo Dry Valleys, Antarctica – a noble gas study in ice and brines.Earth Planet. Sci. Lett., 289(1), 112–122 (doi: 10.1016/j. epsl.2009.10.034)
Marcott SA and 9 others (2014) Centennial-scale changes in the global carbon cycle during the last deglaciation. Nature,
514(7524), 616–619 (doi: 10.1038/nature13799)
Masson-Delmotte V and 18 others (2011). A comparison of the present and last interglacial periods in six Antarctic ice cores. Climate Past, 7(2), 397–423 (doi: 10.5194/cp-7-397-2011)
McGrath D, Colgan W, Bayou N, Muto A and Steffen K (2013) Recent warming at Summit, Greenland: global context and implications. Geophys. Res. Lett., 40(10), 2091–2096 (doi: 10.1002/grl.50456) Miller SL (1969) Clathrate hydrates of air in Antarctic ice. Science,
165(3892), 489–490 (doi: 10.1126/science.165.3892.489)
Morris RM, Mair DWF, Nienow PW, Bell C, Burgess DO and Wright AP (2014) Field-calibrated model of melt, refreezing, and runoff for polar ice caps: application to Devon Ice Cap. J. Geophys. Res.: Earth Surf. (doi: 10.1002/2014JF003100) NEEM community members (2013) Eemian interglacial
recon-structed from a Greenland folded ice core. Nature, 493(7433), 489–494 (doi: 10.1038/nature11789)
Nghiem SV and 8 others (2012) The extreme melt across the Greenland ice sheet in 2012. Geophys. Res. Lett., 39(20), L20502 (doi: 10.1029/2012GL053611)
Nicholson D, Emerson S, Caillon N, Jouzel J and Hamme RC (2010) Constraining ventilation during deepwater formation using deep ocean measurements of the dissolved gas ratios40Ar/36Ar, N
2/
Ar, and Kr/Ar. J. Geophys. Res.: Oceans, 115(C11), C11015 (doi: 10.1029/2010JC006152)
Orsi AJ (2013) Temperature reconstruction at the West Antarctic Ice Sheet Divide, for the last millennium, from the combination of borehole temperature and inert gas isotope measurements. (PhD thesis, University of California, San Diego)
Otto-Bliesner, BL (2006) Simulating arctic climate warmth and icefield retreat in the last interglaciation. Science, 311(5768), 1751–1753 (doi: 10.1126/science.1120808)
Pfeffer WT and Humphrey NF (1998) Formation of ice layers by infiltration and refreezing of meltwater. Ann. Glaciol., 26, 83–91 Pfeffer, WT, Illangasekare TH and Meier MF (1990) Analysis and modeling of meltwater refreezing in dry snow. J. Glaciol,
36(123), 238–246
Pfeffer, WT, Meier MF and Illangasekare TH (1991) Retention of Greenland runoff by refreezing: implications for projected future sea level change. J. Geophys. Res.: Oceans (1978–2012),
96(C12), 22 117–22 124 (doi: 10.1029/91JC02502)
Severinghaus JP and Battle MO (2006) Fractionation of gases in polar ice during bubble close-off: new constraints from firn air Ne, Kr and Xe observations. Earth Planet. Sci. Lett., 244(1–2), 474–500 (doi: 10.1016/j.epsl.2006.01.032)
Severinghaus JP, Grachev A, Luz B and Caillon, AN (2003) A method for precise measurement of argon 40/36 and krypton/argon ratios in trapped air in polar ice with applications to past firn thickness and abrupt climate change in Greenland and at Siple Dome, Antarctica. Geochim. Cosmochim. Acta, 67, 325–343 (doi: 10.1016/S0016-7037(02)00965-1)
Tedesco M, Serreze M and Fettweis X (2008) Diagnosing the extreme surface melt event over southwestern Greenland in 2007. Cryosphere, 2(2), 159–166 (doi: 10.5194/tc-2-159-2008) Tedesco M and 7 others (2011) The role of albedo and accumu-lation in the 2010 melting record in Greenland. Envir. Res. Lett.,
6(1), 014005 (doi: 10.1088/1748-9326/6/1/014005)
Top Z, Martin S and Becker P (1988) A laboratory study of dissolved noble gas anomaly due to ice formation. Geophys. Res. Lett.,
15(8), 796–799 (doi: 10.1029/GL015i008p00796)
WAIS Divide Project Members (2013) Onset of deglacial warming in West Antarctica driven by local orbital forcing. Nature,
500(7463), 440–444 (doi: 10.1016/0011-7471(70)90037-9)
Weiss RF (1970) The solubility of nitrogen, oxygen, and argon in water and seawater. Deep Sea Res., 17, 721–735 (doi: 10.1021/ je60076a014)
Weiss RF and TK Kyser (1978) Solubility of krypton in water and seawater. J. Chem Eng. Data, 23(1), 69–72
Wong GJ, Hawley RL, Lutz ER and Osterberg EC (2013) Trace-element and physical response to melt percolation in Summit (Greenland) snow. Ann. Glaciol., 54(63), 52–62 (doi: 10.3189/ 2013AoG63A602)
Wood D and Caputi R (1966) Solubilities of Kr and Xe in fresh and seawater. (Tech. Rep. USNRDL-TR-988) US Naval Radiological Defense Laboratory, San Francisco, CA
APPENDIX: LOWER DETECTION LIMIT
Thin melt layers are measured in a sample containing mostly bubbly ice. Here we quantify the minimum amount of melt that can be detected by this method. (The symbols used are explained in Table 4.) We estimate the uncertainty in the reconstructed (Z, �, �) by a Monte Carlo perturbation experiment: We build a set of 1000 virtual measurements (d40Ar, d(Kr/Ar), d(Xe/Ar)) by adding random numbers of zero mean, and �pooledvariance to an initial set of (d40Ar, d
(Kr/Ar), d(Xe/Ar)) corresponding to Z ¼ 45, � ¼ 0, � ¼ 0. We used the pooled standard deviation of repeat measure-ments of ice cores from the same depth as an estimate of the uncertainty in the measurements (Severinghaus and others, 2003): �pooledðd40ArÞ ¼ 0:054‰, �pooledðdðKr=ArÞÞ ¼ 0:74‰
and �pooledðdðXe=ArÞÞ ¼ 2:87‰. For each set of virtual
measurements, we calculate (Z, �, �), and estimate the uncertainty as the standard deviation of the 1000 values of (Z, �, �). We find �ðZÞ ¼ 0:83 m, �ð�Þ ¼ 0:0004 and
�ð�Þ ¼0:0058. We can establish that a sample contains melt at the 99% confidence level if � > 3�ð�Þ ¼ 0:017.
For a thin layer of melt that had time to come to full equilibrium before refreezing, and with no loss of gas during refreezing, � ¼ Vliquid=Vair. For a 50 g sample, there is �5 mL
of air, so we are able to detect Vliquid¼ �Vair¼0:017 � 5 =
0.085 mL of liquid water. For an ice core of 10 cm diameter, this corresponds to a 10µm thick ice lens.
Alternatively, it is possible that a thin film of water melted and refroze before reaching equilibrium. In this case, we can calculate the time-varying flux of gas between the air and the liquid water following
F ¼ kcAðCsat CÞ ðA1Þ
where F is the flux into the water, kc is the gas transfer
velocity, A is the surface area considered, Csat is the
concentration of gas at saturation, and C is the concentration
Table 4. List of symbols
Symbol Unit Meaning
½C� mol L 1 Concentration
m kg mol 1 Molecular mass
p Partial pressure
R ¼ ½C�=½C�atm Ratio of sample concentration to standard
concentration
� mol/Lw Solubility coefficient
S ¼ �=½C�atm Lair/Lw/atm Ratio of solubility to air concentration
kc m s 1 Gas transfer velocity
g m s 2 Gravitational acceleration (9.81)
R0 J K 1mol 1 Ideal gas constant (8.314)
T K Temperature
Patm Pa Atmospheric pressure
Vb L STP Volume of air in the bubbles
V L STP Volume of air in the sample
Vl L Volume of liquid water
� ¼Vl=Vb L/L/atm Ratio between liquid and bubble volumes
� Gas loss fraction in bubble air
Z m Firn thickness
t s Time
h m Liquid water thickness
A m2 Core area
of gas in the liquid. The time-varying concentration of gas in the water follows
Ah dC=dt ¼ kcAðCsat CÞ ðA2Þ
which has a solution of the form
CðtÞ ¼ Csatþ ðC0 CsatÞexpð kct=hÞ ðA3Þ
where C0 is the initial concentration, Csat is the
concen-tration at saturation and h is the thickness of the water layer. The gas transfer velocity is 3.7 � 1 � 10 6m s 1
f o r A r , a n d 3 . 1 � 1 �1 0 6m s 1 f o r K r a t 0 ° C
(Table 4; Jähne and others, 1987; Cole and others, 2010; Nicholson and others, 2010). The e-folding time to reach equilibrium for a 1 mm thick layer is
� ¼h=kc¼1 � 10 3=ð3:1 � 10 6Þ= 320 s = 5.3 min.
Start-ing from C0= 0, and for t small, we can approximate CðtÞ ¼ Csatð1 expð kct=hÞÞ � Csatkct=h ðA4Þ
We can adapt Eqn (11) by replacing S by Skct=h:
ðKr=36ArÞmeasured ðKr=36ArÞatm ¼
expðmKrgZ=ðR0TÞÞ þ �SKrkKrt=h
ð1 FÞ expðm36gZ=ðR0TÞÞ þ �S36kArt=h
ðA5Þ We can substitute � with �ðtÞ ¼ Vl=Vbkt=h. For a layer
of thickness h ¼ 1 mm, with kKr ¼3:1 � 10 6m s 1, we
will reach �ðtÞ ¼ 0:017 after t ¼ �Vb=Vlh=k = ð0:017 � 5Þ=
ð� �5 � 5 � 0:1Þ � 1 � 10 3
� �
=ð3:1 � 10 6Þ ¼3:5 s.
We conclude from this analysis that a thin film of liquid is very likely to produce a measurable signal, even if it only stays melted for a few seconds. We note that a thin film of liquid is more likely to efficiently expel all gases during refreezing, and it is possible that micro-melt coating snow grains or sitting in interstices would not be detected by d(Kr/ Ar) and d(Xe/Ar) measurements. However, such a layer would also not alter the gas composition of the ice core, and likely not be an indicator of widespread summer warmth.