Power Savings and Performance Analysis in Wireless
Networks
M. Boulmalf
1, T.Aouam
2, M. Ghogho
1, 4, S. A. R. Zaidi
4, and N. Yaagoubi
3 1: International University of Rabat, Morocco2: Al Akhawayn University, Morocco 3: University of Ottawa, Canada 4: University of Leeds, Leeds LS2 9JT,UK
Abstract—This paper investigates the effects of power saving strategies on the performance of wireless local area networks (WLANs). More specifically, a power management model is formulated as an integer linear program that the network planner can use in order to achieve power savings while maintaining an acceptable quality of service (QoS), measured by the signal to interference ratio (SIR) for interference limited WLAN. Furthermore, through a network simulation implemented in NS-2, it is shown that the adaptive power saving scheme can guarantee the same average throughput as the non-adaptive counterpart, while significantly reducing the total transmitted power. Considering a realistic scenario, we show that, using the proposed power management model, one can save about 55% of the transmitted power while the SIR is increased by 6 dB thus improving the QoS. Also, using a simple experiment with two access points it is shown that, in the case of users within the overlap of the two coverage areas, the throughput remains constant when the transmit power is changed from a low value to a high value although a minor degradation of the average delay is noticed. As a conclusion, the commonly assumed fact that increasing the transmit power results in better network performance is not necessarily true and can result as shown in this paper in energy waste.
Keywords-component; WLANs; QoS; SIR; Power Saving; I. INTRODUCTION
n recent years, wireless communication has rapidly emerged as a key enabler for providing users with network connectivity without significant infrastructure costs. The main purpose of WLAN networks is to provide high bandwidth to users in a limited geographical area. Ideally, users of wireless networks expect to have the same services and capabilities as in wired networks. However, to meet these objectives, the wireless communication community faces certain challenges and constraints. First of all, security is more challenging in WLAN than in wired network where the transmission medium can be physically secured by controlling the connected client. Networking cards in the end computers have generally poor antennas mainly because of space and cost. As a result, not only the supposed users can access the wireless packets but also any user willing to spend a small amount of money on a good quality antenna can pick up packets at a remarkable distance. A wireless network is more difficult to secure, since the transmission medium is open to anyone within the geographical range of a transmitter. It is true that data privacy can be accomplished over a radio medium using encryption but it is usually at the expense of increased cost and decreased performance [1].
Another important issue in wireless network is co-channel interference. It can be caused by simultaneous transmission
from two or more users sharing the same frequency band, this I commonly known as collision. Collisions occur when multiple stations, waiting for the channel to become idle, begin transmission at the same time. Interference is also caused by multipath fading, which is characterized by random amplitude and phase fluctuations at the receiver. Another type of interference involves the presence of unwanted interfering RF signals that disrupt normal wireless operations. This type of interference may come from another network in the vicinity which is transmitting with a higher power and thus causing the reliability degradation for the network [2]. This issue has received much attention by the wireless communication community.
The aim of this paper is to show that network planners can achieve the same or even better performance while significantly reducing the energy consumed by the network. The main performance measures that we are interested in are the user’s average signal to interference ratio (SIR) and the average throughput.
In the first part of this paper, the power management problem (PMP) is formulated as an integer linear program in order to optimize the power transmission in the network. In fact, the proposed PMP model consists of choosing the power allocation to the access points (APs) which minimizes the total interference while ensuring that every user’s SIR is higher than a pre-specified threshold β. A realistic scenario is considered and optimized using PMP as a proof of concept. The results show that we can save about 55% of the transmit power while the SIR is increased by 6 dB thus improving the QoS.
In the second part of the paper, a simulation study is conducted on a simple network with two access points and is implemented in an open source network simulator (NS-2). For each AP, three levels of the transmit power are considered, namely: min, half, and max. In the case of users within the overlap coverage area, it is found that when both APs transmit at the same power level min-min, half-half or max-max, they achieve approximately the same throughput in all the channels. Therefore, the common knowledge which states that increasing the transmit power results in better network performance is not necessarily true and can result as shown in this paper in energy waste.
The structure of the paper is as follow. Section 2 outlines existing results. Section 3 presents the PMP mathematical model and its application to a predefined WLAN network. Section 4 presents two selected scenarios and their simulations with ns-2; the results are analyzed. Finally section 5 draws the overall conclusions.
I
II. RELATED WORK
In past, extensive research work has been carried out in the field of wireless LANs. This research work includes transmit power control protocol, interference management, energy saving, and channel assignment. For instance, the papers addressing the interference issue focus only on channel assignment and propose some mathematical models to perform some kind of dynamic channel assignment. Others have introduced the concept of transmit power control for energy saving; less transmit power results in more energy saving. Also, transmit power control is mainly applied in the field of ad hoc network where we have one cell and no issue of multiple channels or within a fixed allocation channels algorithm. A list of some research papers and the corresponding main ideas is described as follows:
• In [3] authors, focused on the fact that given a network configuration, channel characteristics, and packet length, there is an optimal RF transmission power level which ensures minimum energy expenditure for the actually transmitted bits of information. As a result of the above, the authors gave a packet length dependent power control protocol for ad hoc networks using a two state Markov channel model. At the end, they presented and discussed the significant energy saving that was achieved using their power mechanism.
• Authors in [4] proposed three power control mechanisms to operate in IEEE 802.11 cellular networks. The main aim was to reduce the interferences within the same network cell. They have used fixed allocation channel algorithm in the case of multiple cells and have studied the behavior of the stations placed at different spatial positions with respect to their access point. The results exposed show that the employment of such power control mechanisms leads to an important reduction in the interference level.
• Reference [5] presents the approach of reducing power consumption by lowering the transmit power to the minimum level but still achieving correct reception of a packet even with path loss and fading in the channel. This paper describes an implementation of a transmit power control for 802.11b wireless ad hoc networks. The authors were able to build and deploy the actual implementation of transmit power control with the help of the new 802.11b cards, e.g. CISCO Aironet 350’s, with adjustable transmit power levels. This protocol has the advantages of being power-efficient, data-driven, transparent to the application, adaptive to mobility, and incrementally deployable.
• In articles [6,7], an algorithm which assigns channels dynamically in order to minimize channel interference generated by neighboring access points (APs) on a reference access point, thus yielding higher throughputs. The implementation and simulation are based on two versions (I: pick rand and II: pick first) and different number of APs (4, 9, 16, and 25). The main idea consists of using a mathematical model based on the channel overlapping to minimize the interference. The results showed an improvement by a factor
of 4 over default settings of having all APs use the same channel.
III. EFFECT OF TRANSMIT POWER ON SIR:PMPMODEL
We consider a WLAN network consisting of a set of access points J for which the frequencies have been adequately assigned, and a set of users I. It is assumed that each user is connected to a given AP
j
∈ J
. Let us further assume that each AP can transmit at different power levelsq
∈ Q
, with Q being the pre-specified set of all possible transmission power levels. In this paper, we will consider five power levels in mW, Q={100, 50, 25, 12.5, 6.25} or Q={20, 17, 14, 11, 8} in dBm, respectively.The power management problem (PMP) consists of choosing an optimal power allocation to APs in order to minimize the total interferences between APs, while ensuring that every user’s SIR is superior to a pre-selected threshold β. The binary decision variables introduced are:
X
jq= 1 or 0, it is set to 1 if power level q∈ Q
is assigned to access pointj
∈ J
.The power management problem can be formulated as follows, I. (PMP): II. min P k(djk) −(7−αjk) k≠ j j
(1)
III. Subject to: IV. P jdij −2≥β . P kdik −( 7−αjk) j≠ k +ηi
∀i ∈ I
(2) V.P
j=
qX
jq q∈Q∀j ∈ J
(3)1
=
∑
∈Q q jqX
∀j ∈ J
(4)where dij denotes the distance between AP j and user i, Pj is
the power assigned to AP j, ηi is the noise power at user i., and
α
jk is the degree of conflict between the two APs j and k.,which is defined below. The (PMP) presented above is a binary integer program for which the solution provides an optimal power allocation. The objective in (1) is to minimize the total interferences between access points. Constraint (2) enforces that for every user i that is connected to AP j, the SIR is greater than β. Equality (3) sets the appropriate power level for the APs, while (4) ensures that only one power level is assigned to each AP.
This power management scheme should also achieve significant power savings since typically 100 mW is allocated to each AP.
The degree of conflict between the two APs j and k is defined as [10],
αjk= 5*max 0,1− fj− fk 5
Notice that
α
jk∈ 0,1,2,3,4,5
{
}
; 0 refers to no conflict and 5refer to the greatest conflict. In fact, whenf
j= f
k there is high co-channel interference between the two access points reflected byα
jk= 5
and this leads to a high interferencepower received by AP j.
On the other hand when
f
j− f
k≥ 5
there is no co-channel interference between the two access points reflected byα
jk= 0
and in this case the power received by j is negligible,since the resulting path loss exponent is equal to seven. We solve the PMP to determine the power allocation to each access point. We assume that the frequencies are adequately
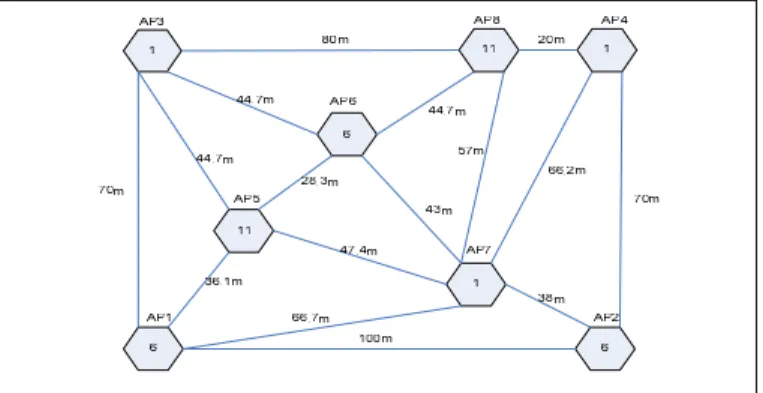
Figure 1. WLANwith 8 APs with a service area of 100 m x 70 m
assigned and the users are balanced within the APs. Table 1 shows a comparison between the results of two scenarios. In the first scenario we transmit the maximum power which is 100 mW. In the second one we apply the PMP algorithm. Figure 1 illustrates the distribution of 8 APs with a service area of 100m x 70m and 80 users uniformly distributed.
TABLE I. RESULTS FOR NETWORK IN FIGURE 1
Scenario 1 Scenario 2 Access Point # of users Transmitted power in mW # of users Transmitted Power in mW AP1 (0, 0) 2 100 3 6.25 AP2 (100, 0) 10 100 13 25 AP3 (70, 0) 13 100 13 100 AP4 (100, 70) 23 100 13 100 AP5 (20, 30) 3 100 5 6.25 AP 6 (40, 50) 4 100 9 12.5 AP7 (65, 15) 4 100 12 12.5 AP8 (80, 70) 21 100 12 100 Scenario 1 Scenario 2 Access Point # of users Transmitted power in mW # of users Transmitted Power in mW TOTAL 80 800 80 362.5
In the second scenario, the total transmit power by all APs is 388 mW, which represents a saving of about 55% with respect to 800 mW in scenario1. Furthermore, the average user SIR increased from 28 dB in scenario 1 to 34.36 dB, which reflects a great improvement in the average QoS in the network. In fact the SIR has increased by 6 dB. Users in scenario 2 are more evenly distributed over APs when compared to scenario 1; this should reduce congestion and would lead to a higher throughput. The distribution is not completely even because the constraint of QoS for each user has to be satisfied.
IV. EFFECT OF TRANSMITTED POWER ON THROUGHPUT:
SIMULATIONS USING NS-2
We have used NS-2, which stands for Network Simulator 2. This open source software is available for download and the code is contributed by many researchers implementing new protocols. NS2 is a discrete event simulator that enables network researchers to simulate different network topologies and protocols [8].
However, in order to be able to simulate the desired experiments, we need the support of the infrastructure mode, 802.11 channels, and interference at the same time. Therefore, after spending some time researching the available solutions; we were finally able to find NIST-addon. It is, to our best knowledge, the only solution that implements all three requirements. NIST stands for National Institute of Standards and technology. NIST has released a modified version of NS2, which is extended to include many new protocols with a focus on mobility. This work was done by The Advanced Network Technologies Division (ANTD), as part of NIST’s Information Technology Laboratory. The main goal behind this work is to develop modules to study seamless handover in heterogeneous networks. As a result, ANTD integrated the EURANE extensions for UMTS support, developed a new WiMAX module and upgraded the 802.11 code to support infrastructure mode, different operating channels and interference [9]. In order to be able to execute our experiments we needed to add the support for 802.11g, as well as some modifications to make the simulations more realistic for power control scenarios. First, Ns2 and NIST add-on unfortunately assume that all MN are the same in terms of having the same wireless interface properties. This means that they all use the same transmission power and have the same communication range. However, we know that if the transmission power changes, so does the communication range. To this end, we made some modifications to the code to change this behavior. On the other hand, we added the support of IEEE 802.11g to NIST addon by changing the
physical layer especially to the receiver’s spectrum mask and BER calculation. Table 2 summarizes the simulation setting:
TABLE II. PARAMETERS USED IN THE SIMULATIONS
Parameters values Parameters values
Slot time 9 us ShortRetryLimit
_
7
SIFS 10 us LongRetryLimit
_ 4
CWMin_ 15 Propagation Free Space
CWMax_ 1023 Application Rate 14 Mb
DataRate_ 54Mb Max Power 0.1 W (80.6
m) Transport
Protocol
UDP Half Power 0.5 W (57.1
m)
Packet size 1000 Min Power 0.025 W
(40.4 m)
In addition, for all scenarios we used the following notation: network 0 contains AP0, MN0 (the sender) and MN2 (the receiver) while network 1 contains AP1, MN1 (the sender) and MN3 (the receiver). Also, the power levels of each AP, as shown in the upcoming figures, represent the power of AP0 followed by that of AP1. For instance, MinMin means both APs transmit at the minimum power. MinHal means AP0 transmits at the minimum power while AP1 transmits at half of its power. Finally, when we mention 1-2, we mean by that network 0 is operating with channel 1 and network 1 is using channel 2. Due to the limited space, we will present only two scenarios in this section.
Figure 2. Scenario 1 Toplogy
Figure 2 depicts scneario1. In this scenario we have two cases: in the first case the networks are not overlapping, which means that the distance between the APs is large. In the second case, we decrease the distance between the APs so that we make a partial overlap between the two networks and only the APs are in the overlap region.
Figure 3. Throughput for Scenario 1
It is clear from Figure 3, that network 0 achieves the same throughput for all the channels when there is no overlap between the two networks. It also reaches the highest throughput for all the channels. However, in the case of the overlap, we see that the highest throughput is accomplished only for the case of the channels 1-4, 1-5, and 1-6.
Figure 4 shows scenario 2, in this scenario, both receivers in the overlap region when the two APs are using their minimum power. We have 2 users per access point: a sender and a receiver.
Figure 4. Scenario 2 Toplogy
Figure 5 shows that channels 1-6 and 1-5 have the best throughput while the throughput achieved in 1-4 is better than 1-3 which is by itself better than 1-2 and 1-1. It is also noticed that as AP1 increases its power from minimum to maximum while AP0 maintains its minimum power, network 0
Figure 5. Troughput for Scenario 2Scenario 2 Topology
experience a decrease in the throughput, from a value of 13 Mbps to 4 Mbps for all channels except for 1-6. For 1-6, the
throughput stays nearly the same for all power levels. In addition, when AP0 increases its power to half and AP1 decreases its power to half, we see an increase in the throughput of network 0 when compared with the previous case where AP1 has maximum power. Moreover, if AP1 increases its power level to maximum, network 0 experiences a decrease in throughput.
For the case of channel 1-1, network 0 has the best throughput when both APs transmit at minimum power level. Furthermore, we see from the graph that when both APs transmit at the same power level MinMin, HalHal or MaxMax they achieve approximately the same throughput in all the channels.
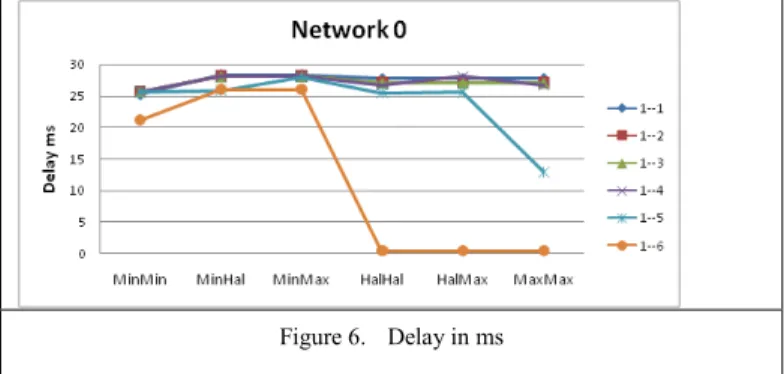
Figure 6. Delay in ms
Figure 6 shows that the delay in network 0 for channel 1-6 is the lowest, for all power levels. However, since the delay varies within a small range of values it roughly stays the same for all the channels and power levels.
We showed the results for network 0 since the exact opposite behavior happens in network 1. For instance, when AP0 increases its power to maximum and AP1 has a minimum value, network 1 encounters the worst case throughput. From the results of the first scenario, we can say that the distance between the access points plays a role in the interference generated, which lead to the different QoS. This is mainly due to the path loss that decreases the interference as the distance between the networks (more precisely the APs) increases. Concerning scenario 2, we see that as an access point of a given network increases its power to maximum level, this network can achieve better QoS. However, this is only true if the neighboring AP is using a lower power level. Normally, when a network is experiencing bad QoS, it does not have any choice to improve its QoS but increase its power. Unfortunately, this will have a bad impact on neighboring users because it will increase the interference. In some cases, we can end up with both networks increasing their powers thinking that they will achieve better QoS without taking interference into consideration. As a result, and as we saw from the figures above, we can conclude that if we have users (receivers) in the overlap region and both APs increase their powers at the same time, they will not improve their QoS. However, they will experience the same QoS as they did using minimum power. Thus, if they both increase their powers, they will only waste energy. In this case, it is better to transmit
minimum power or when possible use non overlapping channels like 1 and 6.
V. CONCLUSION
This paper showed that network planners can achieve the same performance or sometimes even a better one, while minimizing the energy consumed by the network. The main performance measured is the average user’s signal to interference ratio (SIR) and the average throughput. In the first part of the paper, a power management problem (PMP) is formulated as an integer linear program in order to optimize the power transmission in the network. In fact, the proposed PMP model consists of choosing an optimal power allocation to access points (APs) in order to minimize the total interferences between them, while ensuring that every user’s SIR is superior to a pre-specified threshold. A realistic scenario is optimized using PMP. Our results show that we can save about 55% of the transmitted power while the SIR is increased by 6 dB and hence improving the QoS.
In the second part of the paper, a simulation study is conducted on a simple network with two access points and is implemented in an open source network simulator (NS-2). For each AP, three levels of transmitted power are considered, namely: min, half, and max. In the case of users within the overlapping coverage area, it was found that when both APs transmit at the same power level min-min, half-half or max-max, they achieve approximately the same throughput in all the channels. Therefore, the common knowledge which states that increasing transmitted power results in better network performance is not necessarily true and can result as shown in this paper in energy waste.
REFERENCES
[1] P.B. Brian, I. Widjaja, J.G. Kim, and P.T.Sakai, “IEEE 802.11 Wireless Local Area Networks”, IEEE Communications Magazine, 1997, pp. 116-126.
[2] J. Geier. “Minimize WLAN Interference”. [Online] may 20, 2008. [Cited:April,2009]http://itmanagement.earthweb.com/netsys/article.php /3747981/Minimize-WLAN-Interference.htm.
[3] J.P. Ebert, B. Stremmel, E. Wiederhold, and A. Wolisz, “An Energy-efficient Power Control Approach for WLANS”, Journal of Comunications and Networks, September 2000, pp. 197-206.
[4] L.A, Elena, J. Casademont, “Transmit Power Control Mechanisms in IEEE 802.11”, International Conference On Communications And Mobile Computing, ACM New York, NY USA, 2006, pp. 731-736. [5] A. l. Sheth, R. Han, “An Implementation of Transmit Power Control in
802.11b Wireless Networks”, University of Colorado, Boulder, 2002. [6] R. Akl, A. Arepally, “Dynamic Channel Assignment in IEEE 802.11
Networks”, IEEE International Conference, Portable Information Devices, May 2007, pp. 1-5.
[7] V.Angelakis, A. Traganitis, and V. Siris, “Adjacent channel interference in a multi-radio wireless mesh node with 802.11a/g interfaces”, IEEE INFOCOM, 2007.
[8] The Network Simulator ns-2: Documentation. The Network Simulator - ns-2. [Online] [Cited: 07 27, 2009.] http://www.isi.edu/nsnam/ns/ns-documentation.html.
[9] National Institute of Standards and Technology. [Online] NIST, 7 10, 2000. [Cited: 07 28, 2009.] http://www.nist.gov/index.html.
[10] D. Julian, M. Chiang, D. O’Neill, and S. Boyd, ‘QoS and fairnes Constrained Convex Optimization of Resource Allocation for Wireless Cellular and Ad Hoc Neworks’, The IEEE INFOCOM. 2002