HAL Id: hal-00914998
https://hal.inria.fr/hal-00914998
Submitted on 6 Dec 2013
HAL is a multi-disciplinary open access
archive for the deposit and dissemination of
sci-entific research documents, whether they are
pub-lished or not. The documents may come from
teaching and research institutions in France or
abroad, or from public or private research centers.
L’archive ouverte pluridisciplinaire HAL, est
destinée au dépôt et à la diffusion de documents
scientifiques de niveau recherche, publiés ou non,
émanant des établissements d’enseignement et de
recherche français ou étrangers, des laboratoires
publics ou privés.
A 3D model with shape prior information for biological
structures reconstruction using Multiple-Angle Total
Internal Reflection Fluorescence Microscopy
Emmanuel Soubies, Laure Blanc-Féraud, Sébastien Schaub, Gilles Aubert
To cite this version:
Emmanuel Soubies, Laure Blanc-Féraud, Sébastien Schaub, Gilles Aubert. A 3D model with shape
prior information for biological structures reconstruction using Multiple-Angle Total Internal
Reflec-tion Fluorescence Microscopy. ISBI - InternaReflec-tional Symposium on Biomedical Imaging, Apr 2014,
Beijing, China. pp.608 - 611, �10.1109/ISBI.2014.6867944�. �hal-00914998�
A 3D MODEL WITH SHAPE PRIOR INFORMATION FOR BIOLOGICAL STRUCTURES
RECONSTRUCTION USING MULTIPLE-ANGLE TOTAL INTERNAL REFLECTION
FLUORESCENCE MICROSCOPY.
Emmanuel Soubies
1, Laure Blanc-F´eraud
1, S´ebastien Schaub
2and Gilles Aubert
31
Universit´e Nice Sophia Antipolis, I3S, CNRS, Sophia Antipolis, France.
2Universit´e Nice Sophia Antipolis, iBV, CNRS, INSERM, Nice, France.
3Universit´e Nice Sophia Antipolis, Laboratoire J.A. Dieudonn´e, CNRS, Nice, France.
ABSTRACT
We propose a new model for the reconstruction of biological struc-tures using Multiple-Angle Total Internal Reflection Fluorescence Microscopy (MA-TIRFM). This recent microscopy technique allows the visualization of sub-cellular structures around the plasma mem-brane which is of fundamental importance in the comprehension of exchanges mechanisms of the cell. We present a 3D reconstruction method based on a shape prior information on the observed struc-tures and robust to shot noise and background fluorescence. A nov-elty with respect to the state of the art is to propose a method allow-ing the recovery of multiple objects aligned along the axial axis. The optimization problem can be formulated as a minimization problem where both the number of objects in the model and their parame-ters have to be estimated. This difficult combinatorial optimization problem is tackled by using a Marked Point Process approach which allows modelling interactions between the objects in order to regu-larize the inverse problem. Finally, performances of the proposed method are evaluated on synthetic data and real data.
Index Terms— 3D reconstruction, Total Internal Reflection Fluorescence Microscopy, Vesicles reconstruction, Evanescent wave microscopy
1. INTRODUCTION
Current researches in biology require the visualisation of finer and finer structures in order to understand tumor organisation and de-velopment. Such three-dimensional structures can be observed by fluorescence microscopy techniques; however, the axial resolution of these instruments, because of the limitations of conventional op-tics, is restricted to a few hundred of nanometers (e.g. ∼ 500 nm for confocal microscope).
Total Internal Reflection Fluorescence Microscopy gives access to a single layer of ∼ 100 nm behind the glass coverslip (5× better, in terms of axial resolution, than confocal) and provides low back-ground fluorescence and hight signal-to-noise ratio images. While single TIRFM acquisition is a unique projection of the observed volume and can not provide 3D information, developing algorithms dedicated to Multiple-Angle TIRFM (MA-TIRFM) allows to re-construct 3D structures and overcome the axial resolution of single TIRFM by taking TIRFM acquisitions at different incident angles.
Our aim in this work is to propose a 3D reconstruction model with shape prior information which is robust to image degradations
Contact: [email protected], laure.blanc [email protected], [email protected], [email protected]
(i.e. shot noise and background fluorescence). Some previous works on the estimation of axial positions from MA-TIRFM have been developed. Truskey et al. [1] and ¨Olveczky et al. [2] were interested in estimating cell/substratum separation distance. Axial position of the membrane is estimated for each pixel using a one-dimensional geometry but ignoring membrane continuity information. Both pro-posed methods does not consider shot noise and background fluores-cence. Position and diameter of secretory granules have been studied by Rohrbach [3] and Loerke et al. [4]. They deal with isolated gran-ules and model them by spherical (Rohrbach) and cubic (Loerke) volumes. The proposed models ignore the Poisson noise (i.e shot noise) due to the photon collection process. More recently, Yang et al.[5] proposed a 3D reconstruction method of microtubules based on a statistical framework. Axial positions along the segmented curvilinear structures are computed using a Maximum A Posteriori estimator taking into account the Poisson noise. A MAP-Bayesian method is also used by Liang et al. [6] for 3D particle estimation. All of these methods make the strong assumption that at a given position(x, y) there is only one object along the axial axis. This is a simplifying assumption. In this study, we propose a new model that does not require this assumption. The difficulty of recovering multiple objects for a given radial position (x,y) is tackled by us-ing object modellus-ing in the Marked Point Process (MPP) framework.
The paper is organized as follows. In section 2 we formalize the reconstruction problem. Section 3 describes the proposed model and the Marked Point Process framework used to estimate object param-eters. Finally, some numerical results are presented in section 4.
2. PROBLEM STATEMENT
Total internal reflection of a light beam, at the interface between two mediums of refractive indices ni(incident) and nt(transmitted),
occurs when the incident angle α become greater than a critical angle αcdefined by sin(αc) = nt/ni. This phenomenon produces an
evanescent wave capable of exciting fluorophores that are near the dielectric surface. Theoretically, the axial profile of the evanescent wave decreases according to the law [7]:
I(z, α) = I0(α) exp „ − z d(α, λ) « (1)
where I0(α) is the intensity at the interface (i.e z = 0), d(α, λ) =
λ/(4πni)(sin2(α) − sin2(αc))−1/2is the penetration depth and λ
is the incident light wavelength. Excited fluorophores emit photons that are then collected by a CCD camera.
Let R(x, y, z) denote the 3D unknown fluorophore density and I2 ⊂ R2 the (continuous) 2D observed image space. TIRF image
formation is formulated as follows [7]:
∀(x, y) ∈ I2, αcrit< α < αmax, S(x, y, α) = Z ∞ 0 R(x, y, z) exp „ − z d(α, λ) « dz (2)
where S(x, y, α) is the recorded image for the incident angle α. The intensity I0 (in equation (1)) is known theoretically from Fresnel
formulas [7], so the observed data S can be normalized by I0 and
we can omit this term in model (2). Note that because of the thinness of the evanescent wave penetration depth, the point spread function (PSF) along the axial direction can be set to 1 that is why it does not appears in (2).
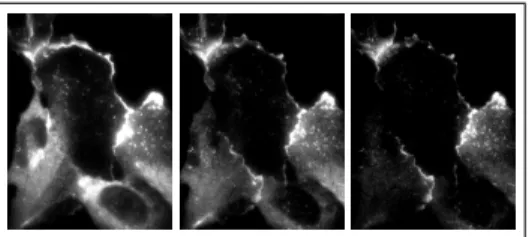
Figure 1 contains an example of MA-TIRFM from a sample of cortactin. It is readily seen from these images that when the pen-etration depth decreases (from left to right), some fluorophores are not excited anymore. These structures are the deeper ones and so we can get 3D information from this set of images. The problem is then to determine R in (2) from acquisitions Sαwith different incident
angles.
Fig. 1. Multiple-angle TIRFM (MA-TIRFM) acquisitions from a cortactin sample (protein involved in cell adhesion). Left : deeper penetration depth. Right : thinner penetration depth.
3. 3D RECONSTRUCTION METHOD
3.1. Introduction and Notations
Since problem (2) is an ill-posed inverse problem, direct inversion is not possible and a regularization is essential. The 3D unknown fluorophore density can be seen as a collection of parametrized ob-jects and this prior information is introduced in the solution. The problem is then to determine R as a configuration of parametrized objects which satisfies equation (2).
Object modelling: Let O(ρ, ω) ⊂ R3 denotes an object defined on a state space X = P × M by its location ρ ∈ P and its marks (i.e geometric attributes ω ∈ M )1. Since the number of objects is
unknown, we aim both at finding this number denoted NO∈ N and
the best sets of parameters {ρj, ωj} ∈ X , j ∈ {1, · · · , NO} with
respect to the observed data Sαl, l ∈ {1, · · · , L} where L is the
number of incident angles used. In the following, we denote by x a configuration containing NOobjects.
1See section 4 for an example where P and M are defined for spheres.
Fluorophore density: Given a configuration of objects x, the un-known fluorophore density can be defined as follows:
Rx(x, y, z) = NO
X
j=1
kj1O(ρj,ωj)(x, y, z) (3)
where kj ∈ K = [kmin, kmax] j ∈ {1, · · · , NO} are the objects
intensities which have also to be estimated2.
3.2. Optimisation Algorithm
The Marked Point Process approach [8, 9] allows to estimate a configuration of objects whose number, location and shape are un-known. The principle consists in the simulation of a Gibbs process defined by the density (against the Poisson process measure):
f (x) = 1
Z exp[−U (x)] (4) where Z is a normalisation factor which can not be computed and U the energy to minimize. In order to simulate this law, a Markov chain which has the stationary distribution f (equation 4) is con-structed. The Reversible Jump MCMC embedded in a simulated annealing framework allows to construct a such Markov Chain by using stochastic dynamics. More details on this approach are given in [10]. The energy U is written as the sum of a data term Udand a
prior term Upwhich are presented in the latter.
Data term Ud: We denote by bg a constant that models the
back-ground fluorescence produced by parasites light sources in the medium (e.g. autofluorescence, light reflection, fluorescence diffu-sion in the sample). We can easily estimate bgfrom an image region
without objects and so, in the following, bgis supposed to be known.
Shot noise have also to be considered in the model. It is inherent to the photon collection process and follows a Poisson distribution.
Let I2d ∈ N be the (discrete) image space (i.e. card(I2d) =
number of pixels in the data images). For all i ∈ I2dand for all
l ∈ {1, · · · , L}, we model the noisy observed discrete signal Sil=
S(i, αl) as follows:
Sil= P(βil) (5)
where P is the Poisson distribution and βilis defined by:
βil= Z Ai Z∞ 0 (Rx(x, y, z) + bg) e “ −z d(αl,λ) ” dxdydz (6)
Here, Ai ⊂ I2 is the region of I2 that corresponds to the pixel
i ∈ I2dand Rxis defined by (3).
From (5) we get, ∀i ∈ I2dand ∀l ∈ {1, · · · , L}, the conditional
probability: P (Sil|x) = β Sil il e−βil Sil! (7) Assuming that observations Silgiven the configuration x are
pairwise independent ∀i ∈ I2d, ∀l ∈ {1, · · · , L}, the joint density
function (i.e. the likelihood function of the observations S given a configuration x) can be written as:
P (S|x) = Y i∈Id 2 L Y l=1 P (Sil|x) (8) 2k
where S ∈ RnL (n = card(I2d)). This assumption can be
jus-tified by the fact that for a given configuration x, the data depend only to the noise, which is pairwise independent ∀i ∈ I2d, ∀l ∈
{1, · · · , L}.
Finally, the data term is defined from the likelihood function (8) by: Ud(x) = − log (P (S|x)) = X i∈Id 2 L X l=1 Sillog „ 1 βil « + βil (9)
Prior term Up: This term is essential in order to regularize the
inverse problem (2). It takes into account some prior information on the solution such as interactions between geometric objects. In this study we focused on vesicle features estimation. Since vesicle should not overlap, we define the following term:
Up1(x) = X u∈x X v∈x Θ(u, v) (10)
where Θ(u, v) is equal to 1 if the objects u and v overlap and 0 otherwise.
We add a second term Up2(x) = card(x) which penalizes the
number of objects in x. Finally the prior term is given by:
Up(x) = γ1Up1(x) + γ2Up2(x) (11)
where γ1and γ2are the weight assigned to each term.
Finally, we have the global energy U = Ud+ Upwhich is
min-imized using the MPP approach briefly presented in section 3.2.
4. EXPERIMENTAL RESULTS
In this section, we present some practical results on synthetic data and real data. Here, we are interested in estimating vesicle features, which are modelled by spherical volumes, ∀j ∈ {1, · · · , NO}:
O(ωj) = Bj=˘(x, y, z) ∈ R3s.t. (13)
¯
(12)
(x − cx)2+ (y − cy)2+ (z − cz)2 ≤ r2 (13)
where (cx, cy, cz) denotes the center coordinates of the ball B and r
the radius. These parameters belong to the state space X = P × M defined by:
P = I2× [0, zmax] M = [rmin, rmax] (14)
Here, zmax is a boundary of cz characterized by the deeper
pene-tration depth of MA-TIRFM and, rminand rmaxare user defined
bounds on the radius. A third prior term Up3 is defined to penalize
objects with cz < r. Note that the method proposed in section 3
can deal with more complex structures than spheres. Indeed, the re-quirements of the method with respect to the objects’ shape are to be able to compute the data term (i.e compute βil(6)) and to determine
whether two objects intersect. These requirements can be performed with various shapes even if it means discretizing the βilintegral and
using a naive method to compute the overlapping (i.e pixel by pixel).
4.1. Using Synthetic Data
The proposed method is evaluated on synthetic noisy data. In order to quantify the robustness of the method with respect to noise, tests under different noise levels have been done. Two different ways are used for varying the noise level in the acquisition simulation. The first one consists in modifying the background fluorescence level (by
varying the bgconstant). In the following, simulated bgwill be given
as a percentage of the maximum intensity of the simulated sample. Another way to modify the noise level can be performed by adding a parameter δ as follows:
Sil=
1
δP(δβil) (15) in order to change the variance of the Poisson distribution, which mimics the photon collection process.
Root mean square errors (RMSE) have been computed for each parameters: RM SEY = v u u t 1 NO NO X i=1 ( ˆYi− Yi)2 (16)
where ˆY is the estimated parameter and Y the exact value of this parameter.
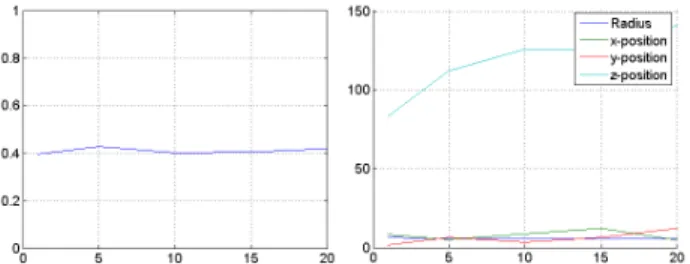
Figure 2 shows the RMSE for different background fluorescence levels (i.e. different values of bg). We obtain a hight accuracy
recon-struction with an RMSE less than 10 nm for parameters cx, cyand
r. A larger RMSE (between 80 and 125 nm, depending on the noise level) is found on the axial position vesicles estimation.
Fig. 2. RMSE with different background fluorescence levels and δ = 0.1. Left : RMSE of objects intensities. Right : RMSE of objects positions and radius.
As we can see on figure 3, the error on the axial position estima-tion is due to the deepest objects (> 300 nm), objects close to the glass interface are well estimated. Same remarks can be make when we change the Poisson noise (with different values of δ) but due to page limit, results are not presented here.
4.2. Using real Data
The method have also been tested on real data. In order to be able to quantify the quality of the reconstruction, we used a sample of beads of known diameters (170 nm). These beads have been fluorescently labelled and placed at the interface with the glass coverslip in an oil which has the same refractive index as water. The microscope has been developed based on a Nikon Ti-E with 100x/1.49O objective (Nikon). We used an Ixon897 (Andor) for detection and galvanome-ters mirror (Cambridge Technology) for the control of the illumina-tion angle. The entire system is driven with Labview (Naillumina-tional In-struments). Six different incident angles have been used from 63.33◦ to 79.23◦. Figure 4 shows the acquired images for incident angles 63.33◦and 79.23◦.
Estimated parameters are presented in table 1. Maximal error on the radius is found on the bead 2 with an error of 30 nm (the exact
Fig. 3. Reconstructions with different background fluorescence lev-els and δ = 0.1 (colors represent z positions of objects). From left to right : simulated sample, reconstruction for bg= 1%,
reconstruc-tion for bg = 10%, reconstruction for bg= 20%. Data images’ size
: 50 × 50. Reconstructed image size : 50 × 50 × 50. CPU time ' 20 min on a hp Z800 PC with an IntelTMprocessor (Xeon, 2.40GHz)
and a Linux OS. The algorithm is implemented in Matlab.
Fig. 4. Real image of beads. Left : α = 63.33◦. Right : α = 79.23◦. Data images’ size : 60 × 83.
radius of the beads is 85 nm). Note that during beads placement at the interface with the glass coverslip, it is not possible to ensure that only one bead is present, there may be a cluster of beads which could explain the estimated radius. Moreover, we can see that found parameters satisfies the property cz ' r meaning that beads are in
contact with the glass interface. Although we have not yet studied all microscope uncertainties, which make the reconstruction prob-lem a hard task on real data, these results are promising for feature estimation of predefined shape structures.
Table 1. Estimated parameters. Reconstructed image size : 60 × 83 × 50. CPU time ' 15 min on the same computer as described in the legend of the figure 3 .
Bead k cx(nm) cy(nm) cz(nm) r (nm)
1 0.4 1297.8 1493.1 101.4 101.3 2 0.2 3601.4 4802.3 114.1 114 3 0.3 4118.2 7129.5 91.9 91.6
5. CONCLUSIONS AND FUTURE WORK
We proposed a new model for the reconstruction of three-dimensional structures from a set of 2D images produced by TIRF microscopy. This model takes into account shot noise, background fluorescence and allows multiple objects to be aligned along the axial axis. A Marked Point Process approach is used to estimate objects’ pa-rameters with respect to data images. Then we show the robustness of the model with respect to shot noise and background fluorescence.
Future work will focus on microscope calibration in order to im-prove the reconstruction accuracy on real data. Theoretically, the axial profile of the evanescent wave decreases according to an expo-nential law (equation (1)). However, it is not the case in practice and experimental calibration of this profile has to be done [5, 11]. We will also investigate the possibility of this model to deal with more complex structures than spheres and the method will be tested in col-laboration with biologists for the observation of vesicle involved in cell adhesion mechanism.
6. ACKNOWLEDGMENT
The authors wish to thank E. Van Obberghen-Schilling, A. Radwan-ska and K. Chakrabandhu for providing real samples and interesting discussions regarding biological application of TIRFM.
7. REFERENCES
[1] GA Truskey, JS Burmeister, E Grapa, and WM Reichert, “To-tal internal reflection fluorescence microscopy (tirfm). II. topo-graphical mapping of relative cell/substratum separation dis-tances,” Journal of cell science, vol. 103, no. 2, pp. 491–499, 1992.
[2] Bence P ¨Olveczky, N Periasamy, and AS Verkman, “Map-ping fluorophore distributions in three dimensions by quanti-tative multiple angle-total internal reflection fluorescence mi-croscopy.,” Biophysical journal, vol. 73, no. 5, pp. 2836, 1997. [3] Alexander Rohrbach, “Observing secretory granules with a multiangle evanescent wave microscope.,” Biophysical jour-nal, vol. 78, no. 5, pp. 2641, 2000.
[4] Dinah Loerke, Walter St¨uhmer, Martin Oheim, et al., “Quan-tifying axial secretory-granule motion with variable-angle evanescent-field excitation.,” Journal of neuroscience meth-ods, vol. 119, no. 1, pp. 65, 2002.
[5] Qian Yang, Alexander Karpikov, Derek Toomre, and James Duncan, “3D reconstruction of microtubules from multiple-angle total internal reflection fluorescence microscopy using Bayesian framework,” IEEE transactions on Image Process-ing, pp. 2248–2259, 2011.
[6] Liang Liang, Hongying Shen, Yingke Xu, Pietro De Camilli, Derek K Toomre, and James S Duncan, “A Bayesian method for 3D estimation of subcellular particle features in multi-angle tirf microscopy,” in Biomedical Imaging (ISBI), 2012 9th IEEE International Symposium on. IEEE, 2012, pp. 984–987. [7] Daniel Axelrod, Edward H Hellen, and Robert M Fulbright,
“Total internal reflection fluorescence,” in Topics in fluores-cence spectrometry, pp. 289–343. Springer, 2002.
[8] MNM Van Lieshout, “Markov point processes,” Markov point processes and Their Applications, 2000.
[9] Xavier Descombes, Stochastic geometry for image analysis, Wiley/Iste, x. descombes edition, 2011.
[10] Peter J. Green, “Reversible jump markov chain monte carlo computation and bayesian model determination,” Biometrika, vol. 82, pp. 711–732, 1995.
[11] Alexa L Mattheyses and Daniel Axelrod, “Direct measurement of the evanescent field profile produced by objective-based to-tal internal reflection fluorescence,” Journal of biomedical op-tics, vol. 11, no. 1, 2006.