HAL Id: hal-01087366
https://hal.archives-ouvertes.fr/hal-01087366
Preprint submitted on 25 Nov 2014HAL is a multi-disciplinary open access archive for the deposit and dissemination of sci-entific research documents, whether they are pub-lished or not. The documents may come from teaching and research institutions in France or abroad, or from public or private research centers.
L’archive ouverte pluridisciplinaire HAL, est destinée au dépôt et à la diffusion de documents scientifiques de niveau recherche, publiés ou non, émanant des établissements d’enseignement et de recherche français ou étrangers, des laboratoires publics ou privés.
Intra-regional trade and income inequality: Where do
we stand?
Thi Hong Hanh Pham
To cite this version:
Thi Hong Hanh Pham. Intra-regional trade and income inequality: Where do we stand?. 2014. �hal-01087366�
EA 4272
Intra-regional trade and income
inequality: Where do we stand?
Thi Hong Hanh Pham*
2014/28
(*) LEMNA - Université de Nantes
Laboratoire d’Economie et de Management Nantes-Atlantique Université de Nantes
Chemin de la Censive du Tertre – BP 52231 44322 Nantes cedex 3 – France www.univ-nantes.fr/iemn-iae/recherche Tél. +33 (0)2 40 14 17 17 – Fax +33 (0)2 40 14 17 49
D
o
cu
m
en
t
d
e
T
ra
va
il
W
o
rk
in
g
P
ap
er
2
Intra-regional trade and income inequality: Where do we stand?
PHAM Thi Hong Hanh
LEMNA, Institute of Economics and Management, University of Nantes Chemin de la Censive du Tertre, BP 52231, 44322 Nantes Cedex 3, FRANCE
Phone: +33 (0)2 40 14 17 33 Fax: +33 (0)2 40 14 16 50
E-mail: thi-hong-hanh.pham@univ-nantes.fr
Abstract: This paper assesses the link between intra-regional trade and within income inequality. To do so,
we use a data sample of nineteen countries in the Asia-Pacific region - one of the most dynamic economic regions. Differing from the existing empirical literature, we employ the gravity model to explain income inequality in function of bilateral trade variables. We find that intra-regional exports can narrow within-country income inequalities, while the opposite tends to be true for intra-regional imports. Moreover, the creation effect of exports on income inequality seems to be dominated by the diversion effect of imports. Our finding also supports the hump-shaped relationship between per capita GDP and within-country income inequality described by the Kuznets curve.
Keywords: Income inequality; Intra-regional trade; Gravity; Asia-Pacific JEL: F14, O11, O15, O24
3 1. Introduction
Whether economic integration results in narrowing or widening the within-country income inequalities is still a controversial matter in the international economics’ literature. The first set of literature directly tests the existence of a relationship between foreign direct investment (FDI) and inequality. According to Stiglitz’s (2002), while FDI may bring benefits to the host economy, there is no clear evidence that FDI is associated with an increasing or decreasing inequality within countries. Recently, to analyse the relationship between inward FDI and wage inequality, Figini and Gorg (2011) use a panel of more than 100 countries, classified into two sub-categories, OECD and non-OECD countries, over the period 1980-2002. They find that FDI’s effect differs due to the development level of each country. For developing countries, wage inequality increases with inward FDI stock but this effect diminishes with further increases in FDI, while wage inequality decreases with inward FDI stock for developed countries.
The second set of literature tends to access the impact of trade openness on income disparities. Bourguignon and Morrisson (1990) suggest that trade openness’ impacts on inequality depend on the relative factor endowments of a country. In the same line, Spilimbergo et al. (1999) and Fischer (2001) find that openness increases inequality, and that trade effects undo the direct effects of endowments. Similarly, Barro (2000) and Milanovic (2005) argue that trade openness is associated with greater income equality in rich countries, while the opposite tends to be true for poor countries. According to Meschi and Vivarelli (2009), trade, in particular trade with rich countries, tends to aggravate wage inequalities across manufacturing sectors in developing countries. Considering the specific trade patterns of each country, Bensidoun et al. (2011) assess the effect of international trade upon income distribution, which is measured by the changes in Gini index. They find that a change in the factor content of trade significantly influences income distribution and that the sign and magnitude of this impact is conditional on the national income level. In detail, an increase in the labour content of trade raises income inequality in poor countries, but reduces income inequality in rich countries, while the opposite tends to be true for the capital content of trade.
However, the existing works seem to focus only on the possible impacts of aggregate FDI and trade, while the link running from bilateral economic integration to income distribution has been a relatively neglected area. Recently, Martinez-Zarzoso and Vollmer (2011) tend to resolve this issue but especially regard the impact of between-country income distribution similarities on bilateral trade. To do so, they use the national income distribution to calculate income similarity indices. These indices allow one to measure how much each country pair overlaps in terms of income distribution and population. Estimating an augmented gravity equation, Martinez-Zarzoso and Vollmer (2011) find that an increase of 10% in income-distribution similarities increases
4 exports by almost 4%. Yet, in this study, the authors have neglected the inverse question of whether bilateral economic integration (in both terms trade and investment) can narrow or widen within-country income inequalities. Our present paper, therefore, tends to fill this knowledge gap. Yet, studying the impact of bilateral FDI flows on income inequality is seriously infeasible due to the data availability. Thus, this paper only focuses on the bilateral trade’s impacts on income inequality. To do so, we develop an empirical analysis in the case of Asia-Pacific region, which has experienced a “noodle bowl” of bilateral and minilateral preferential trade agreements.
A specificity of the present paper is that we investigate the impact of intra-regional bilateral trade on within-country income inequality. We also attempt to tackle another question of whether an increase in intra-regional trade could reduce the gap in within income inequalities between Asia-Pacific countries. Moreover, to achieve the research goal, we employ an augmented gravity equation, which has been widely used in the international economics literature. We use the Gini index as the main indicator to measure within-country income inequalities for a panel of nineteen selected Asia-Pacific countries over the period 1998-20011. It is also worth noting that Gini is the most widely used indicator for comparisons of within-income distribution across countries and over time. For this reason, we choose the Gini as a benchmark indicator despite its well-known short-comings.
This paper is organized as follows. The next section reviews the theoretical background which motivates our empirical analysis. Section 3 outlines some stylized facts about recent trends of mushrooming preferential trade agreements as well as within-country income inequality in the Asia-Pacific region. Section 4 presents the empirical approach and describes the data. We report and analyse econometric results in Section 5. Concluding remarks are in Section 6.
2. Trade and income inequality: Literature review
The impact of international trade on income distribution has been widely studied in the international economics literature. However, the conclusions about this topic have been ambiguous. Firstly, many empirical studies are based on the pioneer theoretical works developed by Heckscher-Ohlin and Stolper-Samuelson (H-O-S), in which a country exports (imports) the goods if the production process of this goods employs the factor relatively more (less) abundant. Consequently, an increase of the abundant factor results in an inequality shrink in developing countries and an inequality fall in developed countries. These hypotheses are empirically verified in Li et al. (1998). Considering exports as an openness measure, the authors find that the relationship between exports and income distribution is negative. However, in the Chinese case study developed by Wei and Wu (2001), exports decrease rural-urban income inequality. Accordingly, the positive impact of exports on income distribution could be explained by the
5 naissance of new industrial agglomerates within Chinese rural areas. However, the H-O-S theorem is only partially supported in Reuveny and Li (2003), who suggest that trade decreases income inequality in both developing and developed countries. Employing two alternative openness indicators, Lundberg and Squire (2003) find quite different results about the link between openness and income distribution. The de jure openness indicator (measured by the Sachs-Warner index1) positively affects income inequality, whereas the de facto openness’ impact (measured by the sum of imports and exports as a percentage of GDP) is not significant. These findings are also supported by Dollar and Kraay (2004).
Secondly, differing from the empirical works listed above, Davis (1996) argues that the theoretical link between trade and income distribution in the H-O-S model may be reversed if one takes into consideration the country’s production factor abundance (capital and labour). The fact is that a rich country can be deemed as capital abundant relatively to its production and that its wages will be reduced by trade. Extending the study of Davis (1996), Cooper (2001) and Milanovic (2005) indicate the channels through which trade increases income inequality in the poorest countries and decreases it in middle-income and high-income countries. Unlikely, basing on theoretical predictions that the impact of trade openness on inequality depends on the relative factor endowment of a country, Spilimbergo et al. (1999) find a negative link between trade and income distribution in countries with a relatively high endowment of skilled workers, whereas a positive link in countries that are relatively capital-abundant. In the same light, Meschi and Vivarelli (2009) try to explain why trade can significantly influence income inequality in developing countries. To do so, they employ the FDI model of Feenstra and Hanson (1997), in which skill-intensive technologies shift from developed to developing countries through trade channels. An increase in skilled labour demand becomes a main channel through which trade can affect income inequality. Feenstra and Hanson find that exports from developing to developed countries appear to be significantly and positively correlated with income inequality. This finding is also previously concluded in transition economies. For instance, Aghion and Commander (1999) find that international trade growth leads to a fall in unskilled labour demand and a consequent increase in income inequality.
Moreover, the impacts of trade on within-country income inequality may differ and depend on the country’s income level. Barro (2000) and Milanovic (2005) find evidence that trade
1
This index is constructed by Sachs and Warner (1995), is a dummy variable for openness based on five individual dummies for specific trade-related policies. Relying on this index, a country is classified as closed if it displays at least one of the following characteristics: Average tariff rates of 40 percent or more; Non-tariff barriers covering 40 percent or more of trade; A black market exchange rate that is depreciated by 20 percent or more relative to the official exchange rate, on average, during the 1970s or 1980s; A state monopoly on major exports; A socialist economic system.
6 openness is associated with greater income inequality in poor countries, while the opposite tends to be true for rich countries. Lately, Meschi and Vivarelli (2009) suggest that that trade with rich countries tends to aggravate wage inequalities across manufacturing sectors in developing countries. In another empirical work, Bensidoun et al. (2011) tend to reassess the link between international trade and income inequality in a framework of factor endowments’ theorem. Accordingly, one way to assess the influence of international trade upon income distribution is to take into account the country’s specific trade patterns by measuring the changes in trade’s factor content. The author show that a change in the factor content of trade has a significant impact on income distribution and that the sign and magnitude of this impact is conditional on the national income level. Precisely, an increase in the labour content of trade raises income inequality in poor countries, but reduces income inequality in rich countries (the reverse is true for the capital content of trade).
We now turn our attention to the studies, which focus on the link between bilateral trade and income distribution. To the best of our knowledge, a few recent studies have considered the within-country income distribution as an important determinant of bilateral trade flows. Among others, Martínez-Zarzoso and Vollmer (2011) recently tend to test the two theoretical predictions of Markusen (2010): i) a positive dependence of trade on per capita income; and ii) higher inequality increase trade of more sophisticated goods. They find that per capita income is positively related to bilateral trade and that on average, an increase of 10% in income-distribution similarities increases exports by almost 4%. Moreover, this effect is stronger for more sophisticated goods in comparison with more homogenous ones. By contrast, the recent literature seems to ignore the reverse question of whether bilateral trade is associated with a deepening or lessening of income inequality within countries as well as between countries in the same geographic zone. So that, our present paper endeavours to fill this knowledge gap by providing in the next sections a case study of the Asia Pacific region.
3. On the dynamics of trade and inequality in Asia-Pacific region
The Asia-Pacific region consists of diverse economies ranging from very small to the world’s biggest countries, from continental economies to island states. This region has also experienced a very diverse level of economic development, with a very wide range in GDP per capita as well as in income distribution. Despite these differences, the Asia-Pacific countries share in common the desire for closer economic integration and improvement in intra-regional economic development. With respect to the research objectives, this section, first, looks at the actual development of trade in the Asia-Pacific region. This is followed by the divergence of within-country income inequalities in the region.
7 3.1. Trade integration
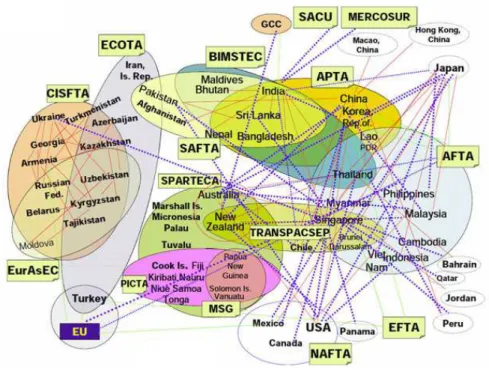
In the last decade, dynamic processes have emerged and led to the creation of an integrated space in the Asia-Pacific region. This region offers a relatively special image of mushrooming bilateral Free Trade Agreements (FTA) in the world. Particularly, the Asia-Pacific Economic Cooperation (APEC) forum’s “open regionalism” and the extension of trade concessions to non-members have been praised an APEC regionalism model since 1989, which corresponds to the global free trade. Figure 1 shows that the last decade has experienced a rising trend in the enforcement of bilateral FTA between the country members.
Figure 1: Noodle bowl of bilateral trade agreements in Asia-Pacific, 2009
Source: Adopted from UNESCAPE
According to Arbabzadeh and Dieter (2010), the reasons for this remarkable integration process are manifold. First, Asia-Pacific has marked a significant reduction in armed conflict. A number of regional conflicts (notably, the Korean and Vietnam Wars and the conflicts in Southeast Asia in the 1970s and 1980s) have been solved or are dealt with in a non-military manner. Second, the Asia-Pacific countries have learned that economic instability is a greater concern to them than classical security risks. Furthermore, the closer economic growth of Asian countries together with the deepening of transnational production networks, the growing share of intra-regional trade and substantial investment flows provide the necessary conditions in which a process of regional political cooperation is gradually being built. Following a rising trend in the signed bilateral FTA, the Asia-Pacific region has also evidenced a sharp increase in regional trade flows.
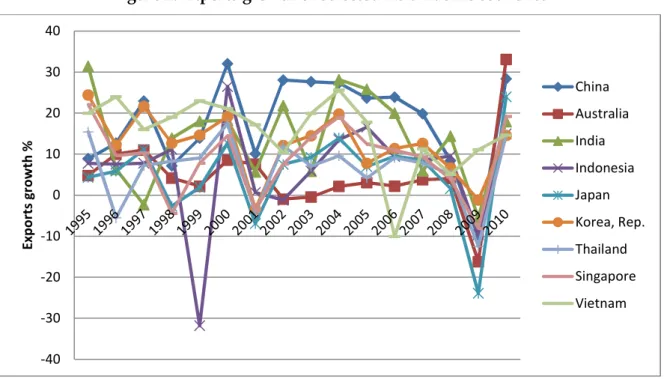
8 Figure 2 shows how quickly exports of the largest and most dynamic traders of the Asia-Pacific region reacted to the contraction of import demand. Figure 2 also illustrates that although openness has its proven benefits in terms of faster growth and development, increased trade dependence (notably increase in exports) can favourite the vulnerability to external shocks. For instance, the region had enjoyed the prolonged periods of high export, interrupted briefly by the 1997 Asian financial crisis, and then the 2000 dot-com crisis. Recently, the exports growth of many countries sharply slid into a negative value during the period 2008-2009 as economic conditions in the largest importing markets became worse (notably the US demand for imports).
Figure 2: Exports growth of selected Asia-Pacific countries
Source: Author’s computation from WDI database
Following an increase in trade dependence, the export orientation of Asia-Pacific region had changed during the period 1995 - 2007. Among others, the share of exports from emerging markets such as China, India and ASEAN2 countries was doubled, from 11.5% to 23.6%. This period also experienced a structural change in the export destinations. The share of three developed market destinations, including the EU, Japan and the US dropped from 46% to 38%. Similarly, there was a significant increase in export dependence in favour of three emerging markets listed above. These trends allow one to conclude that Asia-Pacific was on the path to decoupling itself from developed markets.
The Asia-Pacific regionalism has been also characterized by a large number of sub-regional trade agreements as follows:
ANZCERTA - Australia and New Zealand ANZSCEP - New Zealand and Singapore
2 The Association of Southeast Asian Nations -40 -30 -20 -10 0 10 20 30 40 E x p o rt s g ro w th % China Australia India Indonesia Japan Korea, Rep. Thailand Singapore Vietnam
9 APTA - Bangladesh, China, India, Republic of Korea and Sri Lanka (no data for Lao PDR) ASEAN- Cambodia, Indonesia, Malaysia, Philippines, Singapore, Thailand (no data for Brunei Darussalam, Lao PDR, Myanmar and Viet Nam)
BIMSTEC - Bangladesh, India, Sri Lanka, Thailand (no data for Bhutan, Myanmar, Nepal) SAFTA -Bangladesh, India, Maldives, Pakistan, Sri Lanka (no data for Bhutan and Nepal) Moreover, the Asia-Pacific region has also experienced the concentrated trade flux in some sub-regions, such as ANCERTA, ANZSCEP and ASEAN. For instance, imports and exports between ASEAN countries increased from 1.5% to 18.7% and from 1.8% to 20.5% respectively during 1998-2007. On the other hand, the largest increase in intra-subregional imports is between ASEAN and APTA zones with a doubled increase in export flows and a tripled increase in import flow. This trend can be explained by the fact that in North-East Asia, South-East Asia and Asian emerging countries, there is an increase in the share of intra-industry trade, signalling stronger regional integration and cohesiveness of production systems.
3.2. Trade integration versus within-country income inequality
Most countries in the Asia-Pacific region have relied on a strategy of trade integration and export-led growth for more than three decades. This strategy has been export-led by a number of regional or sub-regional FTAs that have the proven benefits in terms of faster growth and development. However, the effects of this openness strategy may be negative for the welfare of the participating countries as well as the stability of the multilateral trade regime. Regarding to the research objective, this sub-section provides some evidences on the possible interaction between trade integration and within income inequality in this region. However, because of the data availability, we only focus on the stylized facts of nineteen Asia-Pacific countries (see further Appendix A for country list).
<Table 1: Matrix of bilateral trade agreements>
Table 1 presents a matrix of bilateral trade agreements between the countries under consideration. Accordingly, the last decade has experienced the registration of a large number of BTAs in the Asia-Pacific region. This element has seemed to be a factor explaining the rising level of trade dependence between the studied countries.
<Figure 3: Intra-regional export and import growth>
As displayed in Figure 3, the intra-regional export and import flows had been dramatically rising over the period 1998-2007. For example, exports and imports between Vietnam and other selected Asia-Pacific countries increased by 515% and 472% respectively from 1998 to 2007. However, there is no clear evidence of the changes in trade structure (in terms of intra or extra-regional trade). As shown in Figure 4, each country has experienced a different trend in the share of intra-regional trade. For instance, Vietnam evidenced a growing trend in the share of both intra-regional exports
10 and imports, while India experienced an opposite trend. This phenomenon could be explained by the fact that bilateral trade between Asia-Pacific countries has only increased if these countries share a common trading bloc, such as ANCERTA, ANZSCEP and ASEAN.
<Figure 4: Share of intra-regional trade>
Now we look at the possible impact of intra-regional trade on income distribution. As mentioned in the previous section, many empirical works argue that trade openness may have a significant contribution to widening income inequalities in developing countries, while the opposite tends to be true for developed countries.
<Figure 5: Income inequality and intra-regional trade>
As displayed in Figure 5, the relationship between inequality measured by Gini coefficient and intra-regional trade is such heterogeneous and diverse through Asia - Pacific countries. Data from Australia, Japan and New Zealand show no evidence of a link between income inequality and regional trade, while the US data do approximately a U-shaped pattern. No clear-cut relationship between income distribution and intra-regional trade is also observed for the case of three emerging and high-income countries including Singapore, Korea and Malaysia. The connection between inequality and intra-regional trade in other emerging countriesseems to be more complex and heterogeneous. This connection is presented by a U-shaped pattern in some countries but by a U – inverted pattern in other ones.. Lastly, data from developing and low-income countries show no evidence that rising trend in intra-regional can widen or lessen low-income inequalities. In general, the question of whether the extension of intra-regional trade in Asia-Pacific region negatively or positively influences the degree of inequality cannot be institutively resolved. Therefore, the next sections will provide an econometric analysis to investigate such a complex relationship.
4. Model and data specifications
As mentioned above, the aim of this paper is to investigate the potential impacts of trade integration on within income inequality in a panel sample of nineteen selected Asia – Pacific countries over the period 1998-20011. We apply an augmented gravity model that has been widely used to analyse the determinants of international trade flows. In our augmented gravity equation, we consider the income inequality as endogenous variable explained by traditional gravity variables (notably the country size, distance and language), trade variables and so on. With respect to the basic structure of a conventional gravity equation, the augmented gravity equation is defined as follow:
11 where GINI is the Gini coefficient measuring within- country income inequality at the time t. In this paper, to compare the difference in GINI level between the countries of interest, we do the econometric tests for two separate gravity models:
The first one employs the ratio as a dependent variable (where GINIit is the Gini coefficient of the export/import countries i, and GINIjt is the Gini coefficient of the import/export countries j at the time t). Employing this ratio allows us to answer whether intra-regional trade can deepen or worsen the Gini level’s gap between trading country partners. For instance, a positive value of any explicative variable’s estimated coefficient implies that an increase in this variable’s value is associated with the widening gap in the Gini level between trading countries.
The second one utilizes the GINIit index of export country as a dependent variable.
Utilizing this indicator allows us to evaluate whether intra-regional trade allows the Asia-Pacific countries to reduce the Gini value and so within-country income inequality. For instance, a positive value of any covariate’s estimated coefficient means that an increase in this variable’s value leads to a higher Gini coefficient or an increase in within-income inequality.
We now turn to the definition of each explicative variable. EXijt is real exports from country i to
country j at time t; IMijt is real imports from country j to country i at time t. GRAit includes a set of traditional gravity variables as follows:
GDP per capita (labelled GDPper) of the export countries;
The quadratic term for GDP per capita (labelled GDPper2) is also introduced in all
regressions to take into account the possible presence of an invested-U relationship between economic growth and income inequality described by the Kuznets curve.
Population in volume (labelled POP);
The distance between the export and import countries (denoted DIS);
The common language between the export and import countries (denoted LAN); The common border between the export and import countries (denoted BOR);
CONit is a vector of control variables assumed to be correlated with inequality. According to the literature on wage inequality, we introduce four control variables:
Open to foreign investment is defined and measured as total stock of inward FDI over GDP. Including FDI inflows allows us to revisit the impacts of FDI on income inequality. This issue has also discussed in many theoretical works. For instance, presenting a model of technology transfers through the FDI channel, Wang and Blomstrom (1992) suggest that workers with more human capital will appropriate more of the beneficial effects of FDI than unskilled workers. Focusing on the firm specific nature of FDI, Zhao (1998) examines
12 the impact of FDI on wages and employment more directly. According to Zhao, inward FDI benefits the workers with greater bargaining power. In this paper, we use the stock value of inward FDI, which is defined as “the value of the share of their capital and reserves (including retained profits attributable to the parent enterprise, plus the net indebtedness of affiliates to the parent enterprises” (World Investment Report, 2009). Together with inward FDI variable, we also control for de facto trade openness that is measured by the ratio of total exports and imports to GDP (denoted OPEN).
The level of education (denoted EDU) is used to control for the supply side of the labour market. This control variable is measured by the total number of students enrolled in secondary education as a percentage of the total population. We would expect that, higher the enrolment ratio is, higher the supply of skilled labour is. An increase in the skilled labour supply, in turn, can reduce income inequality.
According to Acemoglu (2003a), labour market’s institutions can affect the overall level of inequality. To control for this impact, we include in the gravity model two variables, notably the minimum wages (labelled MG) and the centralization of wage bargaining (labelled WB).
Inflation rate (labelled INF) is to control for the macroeconomic instability of each country under consideration, which may positively influence inequality, by raising wages especially in the lowest part of distribution.
We now look at the selection of dummy variables DUMit:
FTA1it is a binary dummy which is unity if there is a FTA between trading partners; FTA2it is a binary dummy which is unity if the trading country partners share at least a common multilateral FTA;
PARTinit is a binary dummy which is unity if only one trading country is WTO member; ALLinit is a binary dummy which is unity if both trading partners are WTO members; CON1 through CON4 are binary dummies capturing the country fixed effects classified into 4 sub-categories: developed, emerging and high income; emerging; and developing countries.
BE1, BE2 and BE3 are binary dummies which are unity if trading flows are between two developed countries, between developed and developing countries, and between two developing countries respectively.
To this end, our empirical study is based on an unbalanced annual panel data covering various individual indicators for nineteen selected countries in the Asia-Pacific region over the period 1998-20011. All these indicators are transformed in the natural logarithm. The sources of data sample as well as the list of countries under consideration are presented in Appendix A.
13 5. Empirical results
We realize the econometric tests for two baseline gravity models. The first one considers the ratio
GINIit as the dependent variable, while the ratio
"
" becomes the dependent variable in the
second model. We first estimate each model by using the Ordinary Least Squares (OLS) estimator
with heteroskedasticity-consistent standard errors. The OLS results are reported in the second and third columns of Table 2.
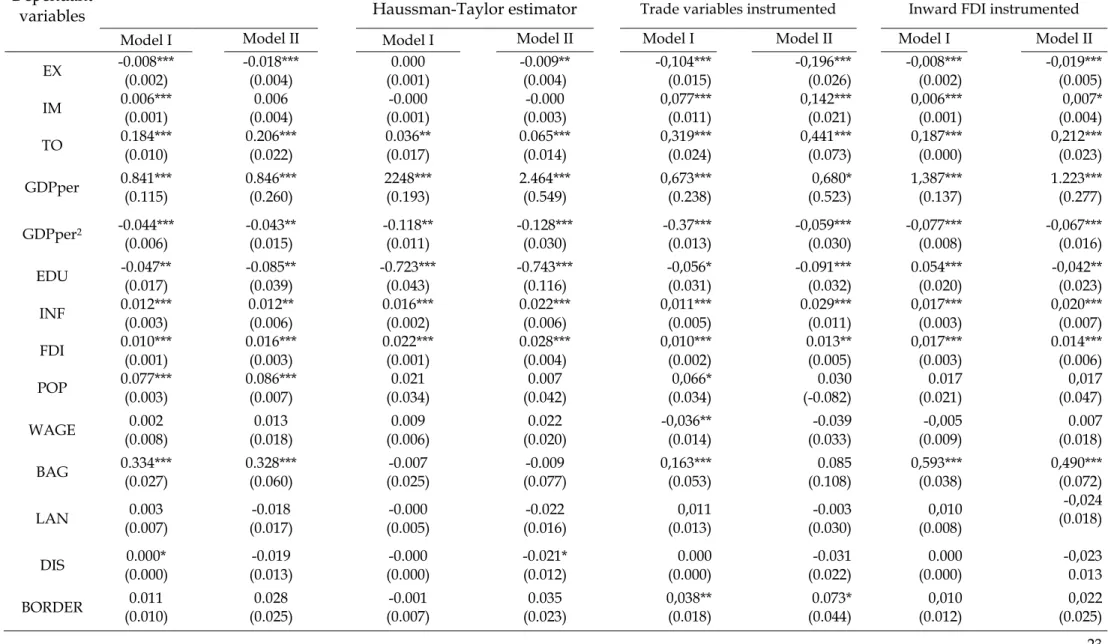
OLS estimator’s results
We start with a discussion on the estimated values of trade variables, which captures the impact of intra-regional trade on within income inequality. The EX variables enter in all regressions with a negative and significant coefficient at the 1% level. It means that as intra-regional exports increases, within income inequality decreases and also the gap in income inequality between countries decreases. Yet, the effect of intra-regional exports on Gini and relative-Gini is pretty weak. By contrast, the IM coefficient is positive but only significant in the first regression, suggesting that intra-regional imports can increase absolute within-country inequalities but has no impact on changing the inequality gap between trading partners. On the other hand, global trade integration, measured by the OPEN variable, results in deepening either absolute within-country income inequalities or the inequality gap between countries.
A further interesting result concerning the role of intra-regional trade stems from the coefficients of three other covariates BE1-2-3. The non-significance of BE3 coefficient implies that intra-regional trade between developing countries does not explain the change in their income inequalities. Otherwise, a significant and positive value of the variable BE1, only in the "" equation, means that trade flows between developed countries can increase the gap in income inequalities between these countries. We find a similar result for the case of bilateral trade flows between developing and developed countries. In this case, we can consider that developing countries have suffered the negative impacts of trading with developed countries. This finding is further reinforced by the positive value of two other dummies CON3 and CON4, implying that intra-regional trade flows may be associated with a rise in within income inequalities only in developing countries. Theoretically, developing countries’ imports from developed countries bring more sophisticated technology and create a gap between the importing firms, which able to upgrade their assets then increase the skilled labour demand, and the rest of firms. This mechanism has been explained by Feenstra and Hanson (1997) in the case of trade between Mexico and the USA. In an opposite situation, the exporting firms in developing countries are not required to improve the technological level of exporting goods, given that most of them are primary commodities. Thus, a
14 stable or even increasing demand for unskilled labour in exporting firms and a rising demand for skilled labour demand in importing firms may adversely affect income inequality. In general, when a developing country opens to trade, they become more exposed to technologies and innovations produced in more advanced countries. Hence, trading with richer countries, which should involve technological upgrading, leads to a general shift of labour demand towards more skilled workers, a consequent increase in wage differentials and a subsequent increase in inequality. In contrast with developing countries, emerging high-income countries (notably Singapore, Korea and Malaysia) seem to be benefit from intra-regional trade. This is evidenced by the statistically significant and negative value of CON2 coefficient. Briefly, while intra-regional export flows can reduce within-income inequality, the opposite tends to be true for intra-regional import flows. Furthermore, the positive and significant value of OPEN variable, which measures the openness level of a country to trade (either intra or extra-regional), enables us to identify the mechanisms of transmission between globalization and income distribution: more opened economics,
higher within-income inequality.
We now look at the impact of inward FDI flows. As mentioned above, due to the data limitation, FDI is only considered as a control variable and measured by the share of total inward FDI stock to GDP. It is worth noting that the FDI coefficients are positive and statistically significant in all regressions. It means that inward FDI flows are associated with widening within-income inequalities in the Asia-Pacific region. In fact, the new technology is transferred from developed countries to developing countries through the FDI channel. As the multinational firms have successfully implemented the new technology in the host country, only skilled labour will be required. Consequently, demand for skilled labour steeply increases, thus leading to an increase in wage of skilled labour and income inequalities between skilled and unskilled labour. This finding has been also supported in other earlier empirical studies. For instance, using a sample of 33 developing countries, Tsai (1995) studies the link between FDI and inequality and finds that FDI increased inequality in some Asian countries. Gopinath and Chen (2003) argue that FDI flows widen the skilled – unskilled wage gap for a sample of 11 developing countries. In a panel study of 80 countries, Basu and Guariglia (2006) confirm the theoretical proposition about the role of inward FDI in fostering income inequality. Similarly, Figini and Görg (2011), who analyse the relationship between foreign direct investment and wage inequality in a panel of more than 100 countries, conclude FDI inflows as a channel of new technology transfer, which in turn influences wage distribution. Although our empirical results on the role of FDI is satisfactory and consistent with that of previous studies, our present paper has not yet resolved another important question of
15 what kind of bilateral FDI flows3 may widen within income inequality. We leave this issue for further researches.
As mentioned above, we introduce in all gravity models two variables - the log GDP per capita and its quadratic term - in order to control for the possible existence of a Kuznets curve, extensively studied in the literature (e.g., Barro, 2000). The empirical results allow us to confirm the importance of controlling for a Kuznets-type effect. The significant impacts of per capita GDP variable and its squared value, which are positive and negative respectively, are consistent with the hump-shaped relationship between per capita GDP and income inequality described by the Kuznets curve. Regarding other country size variables, we find that the estimated coefficients of the population variables (POP) are positive and statistically significant at 5%, meaning that the population growth is probably a factor increasing income inequality. This paper also evidences the impacts of other macroeconomic variables on income inequality. First, as expected, the inflation
INF coefficients are significantly positive at least the 5% level. It means that an instable macroeconomic situation is associated with an increase in income inequality. Second, education plays an important role in narrowing income inequality. A high educational level EDU may intensify and even accelerate the diffusion of knowledge entering the developing countries through trade flows between them and developed countries.
Another important finding is that becoming a WTO member differently affects within-income inequality. If both trading countries are WTO members within within-income inequality tends to increase. By contrast, if only one partner is WTO member, we cannot conclude the WTO effect on Gini value. This finding, by and large, supports evidence of the diversion effect of WTO membership. The fact is that the WTO accession allows a country to benefit from the tariffs reduction and trade barrier elimination. However, WTO accession’s impact on within-income inequality are quite diverse across countries, ranging from negative to positive and from direct to indirect (e.g. Rose, 2004a/b; 2005). On the other hand, belonging to WTO also causes stronger foreign competition in the domestic market of a country. Foreign competition, in turn, can result in two possible strategies for the domestic producers. The first one is to lower prices and improve the quality of their domestic products. The second is to re-allocate their production activities abroad through the vertical FDI channel. The latter seems to be the better choice since it allows the domestic producers to: (i) avoid foreign competition, (ii) benefit from the foreign investment incentive in the FDI host countries, and (iii) re-export their products to the domestic market and benefit from the tariff reduction. This decisive strategy can decrease labour demand and wage
3 FDI flows (i) between developed countries, (ii) between developing countries and (iii) between developed and
16 level in the FDI home countries. In the FDI host country, foreign firms’ entry can widen the wage gap between domestic and foreign firms, which in turn encourage the within-income inequality.
Unlike the WTO impacts, the FTA1 (in the "" equation) and FTA2 coefficients enter in all regressions with a negative but statistically insignificant value. It means that sharing a BTA or a common trading block does not contribute to the change in income distribution. This finding allows us to ask the efficiency of Asia-Pacific integration policies in achieving free trade. As discussed above, the Asia-Pacific region has been considered as a good example not only of “open regionalism” but also of the trade concessions’ extension to non-members. Although de jure intra-regional integration is growing, deeper de facto integration is probably lagging. The Asia-Pacific region has seemed to experience a slow progress and a lack of significant trade concessions that have frustrated free-trade hopefuls in academia and the business world alike (UNESCAP, 2008). This phenomenon results from the diverse interests and differing approaches in the region toward free trade. Moreover, rather than focusing on and pursuing an intra-regional Asia-Pacific model, the region is characterized by several competing approaches to free trade, reflecting diverse domestic interests and complex strategic and tactical alliances. However, it should be noted that diversified characteristics of intra-regional trade regimes may be an outcome of an important gap in economic development levels between the Asia-Pacific countries. In such a context, pursuing a common and unique intra-regional Asia-Pacific model is not an easy task. Moreover, only FTA1 coefficient in the GINIit equation is significant and negative, additionally suggesting that the
bilateral trade agreements can decrease the Gini index but cannot change the income inequality gap between trading country partners.
Robustness checks
In the second step, we check for the robustness of OLS estimator’s results by performing two alternative econometric tests. The first one is the HTM estimator originally proposed by Hausman and Taylor (1981). According to Egger (2000; and 2002b), the HTM technique is considered as the most appropriate estimation of cross-country gravity model. The HTM estimator’s results (2nd and 4th columns, Table 2) show that applying the HTM technique to estimate all gravity equations does not alter the sign or the statistical significance of explanatory variables. Only the magnitudes of estimated coefficients are little affected. In other words, the HTM estimator’s results as effectively supportive of the robustness of the OLS estimator’s results.
However, the HTM method assumes that some of the explanatory variables are correlated with the individual-level random effects, but that none of the explanatory variables are correlated with the idiosyncratic error. According to Nickell (1981), this correlation can make the panel estimation equations suffer from the estimation bias. Among other methods, which can correct the country specific or time-specific effects and allows getting rid of any endogeneity in explanatory variables,
17 the Instrumental Variables estimator is a preferred estimator. However, determining the IV in each estimated gravity equation is not an easy task. In this paper, we will instrument the export/import and inward FDI variables, which are considered as endogenous ones, with a set of following external variables:
- Trade variables are instrumented with the trade concentration/diversification index, the most-favoured nation rate and the exchange rate;
- Inward FDI variable is instrumented with the KAOPEN index4 and the exchange rate. Above all, we test for the validity of each instrumental variable. In the lower part of Table 2, we report the weak instrument test suggested by Stock and Yogo (2002) and the Hansen/Sargan test of over-identifying restrictions. On one hand, in the weak instrument test the Cragg-Donald F-statistics are superior to the critical value of 10% maximal IV size proposed by Stock and Yogo (2002), meaning that the null hypothesis of weak instruments is rejected. On the other hand, the Sargan/Hansen test of over-identifying restrictions, which is reported in the last line, checks the validity of the instruments. According to the empirical results, we cannot reject the null hypothesis of Sargan/Hansen test meaning that the instruments are valid instruments, notably uncorrelated with the error term, and that the excluded instruments are correctly excluded from the estimated equation.
The IV results reported in the last columns of Table 2. The results are also similar to those of the OLS estimator in terms of sign and significance, but the magnitudes are different as would be expected. The explanatory variables enter with much smaller coefficient than using the OLS technique. It remains, however, highly significant. Otherwise, the IV estimation provides two complementary results to those of OLS and HTM estimators. First, when we treat the openness variables (including trade and inward FDI) as endogenous, the imports IM variables become positive and significant at least the 5% level. This result supports the hypothesis that imports are the channel of transferring the new technologies, which in turn deteriorate within-income distribution. Second, the treatment of the openness terms as endogenous also makes the BE3 coefficients negative and significant, while the BE1 and BE2 coefficients remain their sign and statistical significance. Thus, trade between developing countries seems more susceptible to endogeneity bias than trade between other countries. Interestingly, this result means that intra-regional trade between developing countries can improve within-income distribution in these countries.
4
The KAOPEN index is the Chinn and Ito (2006) index of capital account openness. The authors constructed this measure from four binary dummy variables that codify restrictions on cross-border financial transactions reported in the IMF’s Annual Reports on Exchange Arrangements and Exchange Restrictions.
18 6. Conclusion
This paper assesses the impact of intra-regional trade on within-country income inequality in the Asia-Pacific region. We use a data sample covering the bilateral trade flows between 19 selected Asian-Pacific countries over the period 1998-20011. Differing from the existing empirical studies, this paper is the first using the gravity model to investigate the link running from bilateral intra-regional trade to within-country income inequality. Using three alternative econometric techniques (OLS, HTM and IV) our empirical results, by and large, are satisfactory and robust.
The most important finding is that increasing intra-regional exports can narrow within-country income inequality. This finding supports the creation effect of intra-regional exports. However the opposite tends to be true for the impact of imports. This result matches the theoretical hypothesis on the imports’ role in conducting for new technology transfer, which in turn promotes domestic firms to employ more skilled workers and so widens wage inequality. The paper also reveals that intra-regional trade between developed and developing countries can worsen the income inequality gap between them. In other words, developing countries can suffer the negative impacts of trading with developed countries. By contrast, intra-regional trade between countries at the same level of economic development tends to exert the opposite effect. In general, these results allow us to conclude that encouraging intra-regional trade integration between countries at the same level of economic development may avoid the undesired diversion effects of trade on within-country income inequality. While intra-regional exports and imports differently influence income distribution, a positive and significant value of the trade openness indicator (measured by the ratio of total exports and imports to GDP) implies that more a country opens to trade, higher its income inequality is. In this sense, we can conclude that the creation effect of exports on inequality seems to be dominated by the diversion effect of imports. In sum, if trade is considered as the main channel of new technology transfer, technological differentials and the skill biased nature of new technologies, in turn, may be important factors in shaping the distributive effects of trade.
Our empirical study also provides further interesting results on the role of other macroeconomic variables. First, a rising trend in inward FDI, one of the most important channels to transfer the new technologies between countries, may widen within-country income inequality. Second, a hump-shaped relationship, described by the Kuznets curve, between GDP per capita and within-country income inequality is also confirmed in this study. Third, our empirical result supports the determinant role of education in decreasing within income inequality.
The last important result concerns the link running from intra-regional trade agreements to within-income inequality. As mentioned above, the Asia-Pacific region has experienced the most dynamic trade integration bloc explained by the registration of a large number of BTAs. Our
19 empirical analysis, yet, reveals that the registration of BTAs is growing, but deeper and more efficient implement of BTAs is lagging. Econometrically, we find no evidence of the efficiency of intra-regional BTAs in lessening within-country income inequality or in correcting the gap in income distribution between countries. This unexpected result can be explained by the recent regional developments and trends in trade policies. Instead of practising a unique intra-regional model, the Asia-Pacific trade integration policies are characterized by several competing approaches to free trade, reflecting diverse domestic interests and complex strategic and tactical alliances. As a result, these strategies lead to a numerous different sub-regional integration policies, which have seemed to boost only the sub-regional cooperation in trade and investment and to turn it into the principal driver of promoting economic growth without narrowing within-country income inequality in particular, and achieving the Millennium Development Goals in general.
References
Acemoglu, D., 2003a. “Cross-Country Inequality Trends”, Economic Journal, 113(2), pp.121-49. Aghion, P., and Commander, S., 1999. “On the dynamics of inequality in the transition”, Economics
of Transition, 7(2), pp. 275-98.
Arbabzadeh, N., and Dieter, H., 2010. “Trade integration in Asia: Is the region pursuing a convincing strategy for the 21st century?”, GARNET Working Paper No. 79/10
Barro, R. J., 2000. “Inequality and growth in a panel of countries”, Journal of Economic Growth, 5(1), pp. 5–32.
Basu, P., and A. Guariglia, 2007. “Foreign Direct Investment, Inequality and Growth”, Journal of
Macroeconomics, 29(4), pp. 824-39.
Bensidoun, I., Jean, S., and Sztulman, A., 2011. “International trade and income distribution: reconsidering the evidence”, Review of World Economics, 147(4), pp. 593-619.
Bourguignon, F., and Morrisson, C. (1990). “Income distribution, development and foreign trade: A crosssectional analysis”, European Economic Review, 34(6), pp. 1113–32.
Chinn, M.D., and Ito, H., 2006. ‘What matters for financial development? Capital controls, institutions and interactions’, Journal of Development Economics, 81, pp.163-92.
Cooper, R., 2001. “Growth and inequality: the role of foreign trade and investment”, WCFIA Working
Paper, No. 01-07.
Davis, D.R., 1996. “Trade liberalization and income distribution”, NBER Working Paper, No. 5693. Dollar, D., and Kraay, A., 2004. “Trade, growth and poverty”, The Economic Journal, 114(493), pp.
22-49.
Egger, P., 2000. “A note on the proper specification of the gravity equation”, Economics Letters, 66(1), pp. 25-31.
Egger, P., 2002b. “An Econometric View on the estimation of Gravity models and the calculation of Trade potentials”, The World Economy, 25(2), pp. 297-312.
Feenstra, R.C., and Hanson, G.H., 1997. “Foreign Direct Investment and relative wages: evidence from Mexico’s maquiladoras”, Journal of International Economics, 42(3-4), pp. 371-93.
20 Figini, P., and Görg, H., 2011. “Does Foreign Direct Investment Affect Wage Inequality? An
Empirical Investigation”, The World Economy, 34(9), pp. 1455-1475.
Fischer, R. D., 2001. «The evolution of inequality after trade liberalization”, Journal of Development
Economics, 66(2), pp. 555–79.
Gopinath, M., and W. ,Chen, 2003. “Foreign Direct Investment and Wages: a Cross-Country Analysis”, Journal of International Trade and Economic Development, 12(3), pp. 285-309.
Hausman, J.A., and Taylor, W.E., 1981. “Panel Data and Unobserved individual effects”,
Econometrica, 79, pp. 1377-98.
Li, H., Squire, L., Zou, H., 1998. “Explaining international and intertemporal variations in income inequality”, The Economic Journal, 108(446), pp.26-43.
Lundberg, M., and Squire, L., 2003. “The simultaneous evolution of growth and inequality”, The
Economic Journal, 113(487), pp. 326-44.
Markusen, J., 2010. Putting Per-Capita Income back into Trade Theory, University of Colorado, Boulder, Mimeo. http://spot.colorado.edu/~markusen/
Martínez-Zarzoso, I., and Vollmer, S., 2011. “Bilateral Trade Flows and Income-Distribution Similarity”, AEEFI Working Paper, No. 1006.
Meschi, E., and Vivarelli, M., 2009. “Trade and income inequality in developing countries”, World
Development, 37(2), pp. 287–302.
Milanovic, B., 1999. “Explaining the increase in inequality during the transition”, Economics of
transition, 7(2), pp. 299-341.
Milanovic, B., 2005. “Can we discern the effect of globalization on income distribution? Evidence form household survey”, The World Bank Economic Review, 19(1), pp. 21-44.
Nickell, S.J., 1981. "Biases in Dynamic Models with Fixed Effects", Econometrica, 49(6), pp.1417-26. Rose, A., 2004a. “Do we really know that the WTO really increases trade?”, American Economic
Review, 94, pp. 98–114.
Rose, A., 2004b. “Do WTO members have more liberal trade policy?”, Journal of International
Economics, 63, pp. 209–35.
Rose, A., 2005. “Does the WTO make trade more stable?”, Open Economies Review, 16, pp. 7–22. Sachs, J. D., and Warner, A., 1995. "Economic reform and the process of global integration"
Brookings Papers on Economic Activity, 1, pp.1-118.
Spilimbergo, A., Londono, J. L., and Székely, M., 1999. “Income distribution, factor endowments, and trade openness”, Journal of Development Economics, 59(1), pp. 77–101.
Stiglitz, J., 2002. Globalization and its discontents, Norton: New York.
Stock, J. H. and Yogo, M. (2002). ‘Testing for weak instruments in linear IV regression’, NBER Technical Working Paper No. 284. Cambridge, MA: NBER.
Tsai, P.L., 1995. “Foreign Direct Investment and Income Inequality: Further Evidence”, World
Development, 23(3), pp. 469-83.
Wang, J.Y., and Blomstrom, M., 1992. “Foreign Investment and Technology Transfer: A Simple Model”, European Economic Review, 36, pp.137-55.
Wei, S., and Wu, Y., 2001. “Globalization and inequality: evidence from within China”, NBER
Working Paper, No. 8611.
World Investment Report, 2009. “Transnational Corporations, Agricultural Production and Development”, United Nations Conference on Trade and Development.
21 Zhao, L., 1998. “The Impact of Foreign Direct Investment on Wages and Employment”, Oxford
Economic Papers, 50, pp.284-321.
Appendix A: Country list and Data sources
Country
Developed countries (4) Australia; Japan; New-Zealand; United States Emerging and Developing countries (15) Bangladesh; Cambodia; China; India;
Indonesia; Korea Rep.; Malaysia; Mongolia; Pakistan; Philippines; Russian Federation; Singapore; Sri Lanka; Thailand; Vietnam
Indicators Sources
GINI UNU-WIDER World Income inequality
Database 2.0c (WIID2); World Development Indicators; and OECD
Bilateral exports UNESCAP database, OECD database
Bilateral imports UNESCAP database, OECD database
GDP per capita PPP World Development Indicators
Population World Development Indicators
Distance / Common language/ Common Border CEPII database
FDI, Stock value of inflows (% of GDP) World Investment Report, UNCTAD # $%&'( ')%*# (+#,,#-- = ./ 01 23 01 2
45 World Development Indicators School enrollment, Secondary (%) World Development Indicators, 2011
Minimum wages Fraser Institute, Economic Freedom of the World (2008)
Centralization of wage bargaining World Economic Forum, Global Competitiveness Report and Fraser Institute, Economic Freedom of the World (2008)
22 Table 1: Matrix of bilateral trade agreements
AUS BGD KHM CHN IND IDN JPN KOR MYS MNG NZL PAK PHL RUS SGP LKA THA USA VNM
Australia AUS - U U U U 1983 2005 2005 Bangladesh BGD - Cambodia KHM - China CHN U - U 2008 2007+2009 2009 2003 India IND - 2010 U 2005 2001 2004 Indonesia IDN - 2008 Japan JPN U 2008 - 2003 2006 2008 2002 2007 2009
Korea, Rep. KOR U U 2010 2003 - U 2006
Malaysia MYS U 2006 U - P 2008 2004 Mongolia MNG - New Zealand NZL 1983 2008 U U P - 2001 2006 U Pakistan PAK 2007+2009 - U 2005 Philippines PHL 2008 2008 - U Russian Federation RUS - Singapore SGP 2003 2009 2005 2002 2006 2001 U - U 2004
Sri Lanka LKA 2001 2005 U -
Thailand THA 2005 2003 2004 2007 - U
United States USA 2005 U 2004 2006 U U 2004 - 2001
Vietnam VNM 2009 2004 -
Source: Author’s synthesis from many sources
23 Table 2: Empirical results
Dependant variables
OLS estimator
Haussman-Taylor estimator
IV estimator
Trade variables instrumented Inward FDI instrumented
Model I Model II Model I Model II Model I Model II Model I Model II
EX -0.008*** (0.002) -0.018*** (0.004) 0.000 (0.001) -0.009** (0.004) -0,104*** (0.015) -0,196*** (0.026) -0,008*** (0.002) -0,019*** (0.005) IM 0.006*** (0.001) 0.006 (0.004) -0.000 (0.001) -0.000 (0.003) 0,077*** (0.011) 0,142*** (0.021) 0,006*** (0.001) 0,007* (0.004) TO 0.184*** (0.010) 0.206*** (0.022) 0.036** (0.017) 0.065*** (0.014) 0,319*** (0.024) 0,441*** (0.073) 0,187*** (0.000) 0,212*** (0.023) GDPper 0.841*** (0.115) 0.846*** (0.260) 2248*** (0.193) 2.464*** (0.549) 0,673*** (0.238) 0,680* (0.523) 1,387*** (0.137) 1.223*** (0.277) GDPper2 -0.044*** (0.006) -0.043** (0.015) -0.118** (0.011) -0.128*** (0.030) -0.37*** (0.013) -0,059*** (0.030) -0,077*** (0.008) -0,067*** (0.016) EDU -0.047** (0.017) -0.085** (0.039) -0.723*** (0.043) -0.743*** (0.116) -0,056* (0.031) -0.091*** (0.032) 0.054*** (0.020) -0,042** (0.023) INF 0.012*** (0.003) 0.012** (0.006) 0.016*** (0.002) 0.022*** (0.006) 0,011*** (0.005) 0.029*** (0.011) 0,017*** (0.003) 0,020*** (0.007) FDI 0.010*** (0.001) 0.016*** (0.003) 0.022*** (0.001) 0.028*** (0.004) 0,010*** (0.002) 0.013** (0.005) 0,017*** (0.003) 0.014*** (0.006) POP 0.077*** (0.003) 0.086*** (0.007) 0.021 (0.034) 0.007 (0.042) 0,066* (0.034) 0.030 (-0.082) 0.017 (0.021) 0,017 (0.047) WAGE 0.002 (0.008) 0.013 (0.018) 0.009 (0.006) 0.022 (0.020) -0,036** (0.014) -0.039 (0.033) -0,005 (0.009) 0.007 (0.018) BAG 0.334*** (0.027) 0.328*** (0.060) -0.007 (0.025) -0.009 (0.077) 0,163*** (0.053) 0.085 (0.108) 0,593*** (0.038) 0,490*** (0.072) LAN 0.003 (0.007) -0.018 (0.017) -0.000 (0.005) -0.022 (0.016) 0,011 (0.013) -0.003 (0.030) 0,010 (0.008) -0,024 (0.018) DIS 0.000* (0.000) -0.019 (0.013) -0.000 (0.000) -0.021* (0.012) 0.000 (0.000) -0.031 (0.022) 0.000 (0.000) -0,023 0.013 BORDER 0.011 (0.010) 0.028 (0.025) -0.001 (0.007) 0.035 (0.023) 0,038** (0.018) 0.073* (0.044) 0,010 (0.012) 0,022 (0.025)
24 Dependant
variables
OLS estimator Haussman-Taylor estimator
IV estimator
Trade variables instrumented Inward FDI instrumented
Model I Model II Model I Model II Model I Model II Model I Model II
PARTin -0.055 (0.051) -0.008 (0.024) -0.005 (0.010) 0.073** (0.031) -0,029 (0.021) 0.030 (0.049) -0,017 (0.014) 0,031 (0.029) ALLin 0.051*** (0.011) 0.076*** (0.021) 0.025*** (0.010) 0.067** (0.031) 0,015*** (0.002) 0.070* (0.046) 0,024* (0.013) 0,047* (0.028) FTA1 -0.027** (0.011) -0.016 (0.031) -0.005 (0.007) 0.010 (0.028) -0,011 (0.019) -0.000 (0.052) -0,023* (0.012 -0.014 (0.031) FTA2 -0.000 (0.007) -0.009 (0.018) -0.006 (0.005) -0.021 (0.017) 0,018 (0.014) 0.029 (0.032) 0,002 (0.008) -0.013 (0.019) CON1 -0.024 (0.068) -0.086 (0.055) -0.097 (0.160) -0.092 (0.253) 0,139 (0.118) 0.169 (0.138) -0,079 (0.076) -0.107 (0.075) CON2 -0.190*** (0.066) -0.177*** (0.043) -0.055*** (0.016) -0.216* (0.110) -0,267*** (0.113) -0.233** (0.115) -0,270*** (0.077) -0,300*** (0.062) CON3 0.039*** (0.065) 0.053* (0.031) 0.014*** (0.008) 0.106*** (0.028) 0,213** (0.108) 0.135*** (0.061) 0,186** (0.071) 0.149*** (0.040) CON4 0.031*** (0.064) - 0.121** (0.057) - 0.276** (0.109) - 0,150** (0.072) - BE1 -0.002 (0.023) 0.263*** (0.035) -0.003 (0.016) - -0,006 (0.040) 0.427*** (0.063) -0,018 (0.026) 0,265*** (0.035) BE2 -0.029 (0.021) 0.123*** (0.020) -0.002 (0.014) 0.133*** (0.023) -0,049 (0.035) 0.198*** (0.036) -0,032 (0.023) 0,126*** 0.020 BE3 -0.029 (0.020) - -0.000 (0.014) -0.052 (0.032) -0.096*** (0.036) - -0,040* (0.022) - Constant -6.377*** (0.536) -6.530*** (0.331) -6.574*** (0.999) -8.128*** (2.326) -6.050*** (1.044) -8.366*** (2.306) -9.950*** (0.677) -8.908*** (1.326)
Cragg-Donald Wald F-statistic 9.480 10.727 300.050 195.125
F-statistic (8.50)a (8.50)a (19.93)a (19.93)a
P-value of Sargan test [1.000] [1.000] [1.000] [1.000]
Notes: Model I: Dependent variable is Giniit; Model II: Dependent variable is
"
" ; Values in parentheses are robust standard errors. ***, **, *: Significant at 1 percent, 5 percent, 10
25 Figure 3: Intra-regional export and import growth 1998 - 2007
Source: Created from UNESCAP database Figure 4: Shares of intra-regional trade
Source: Created from UNESCAP and WDI database AUS BGD KHM CHN IND IDN JPN KOR MYS MNG NZLPAK PHL RUS SGP LKA THA USA VNM -100% 0% 100% 200% 300% 400% 500% 600% 700% E x p o rt s g ro w th 1 9 9 8 -2 0 0 7 AUSBGD KHM CHN IND IDN JPN KOR MYSMNGNZL PAK PHL RUS SGPLKA THA USA VNM 0% 100% 200% 300% 400% 500% 600% 700% 0 5 10 15 20 Im p o rt s g ro w th 1 9 9 8 -2 0 0 7 0.0% 10.0% 20.0% 30.0% 40.0% 50.0% 60.0% 70.0% 80.0% A U S B G D K H M C H N IN D ID N JP N K O R M Y S M N G N Z L P A K P H L R U S S G P LK A T H A U S A V N M % o f T o tal e x p o rt s 1998 2007 0.0% 10.0% 20.0% 30.0% 40.0% 50.0% 60.0% 70.0% 80.0% A U S B G D K H M C H N IN D ID N JP N K O R M Y S M N G N Z L P A K P H L R U S S G P LK A T H A U S A V N M % o f T o tal i m p o rt s 1998 2007
26 Figure 5: Income inequality and intra-regional trade
Source: Created from UNESCAP and WIID2 database 0 10 20 30 40 50 -15.00 -10.00 -5.00 0.00 5.00 10.00 15.00 20.00 25.00 30.00 G in i co e ff ic ie n t
Intra-regional trade growth
Developed countries AUS JPN NZL USA 0 10 20 30 40 50 60 -80.00 -60.00 -40.00 -20.00 0.00 20.00 40.00 G in i co e ff ic ie n t
Intra-regional trade growth %
Emerging & high-income countries
KOR MYS SGP 0 10 20 30 40 50 -20.00 -10.00 0.00 10.00 20.00 30.00 40.00 50.00 G in i co e ff ic ie n t
Intra-regional trade growth %
Emerging countries
CHN IND IDN RUS THA
0 10 20 30 40 50 -20.00 -10.00 0.00 10.00 20.00 30.00 40.00 50.00 G in i co e ff ic ie n t
Intra-regional trade growth %
Developing countries