HAL Id: halshs-00467896
https://halshs.archives-ouvertes.fr/halshs-00467896
Preprint submitted on 29 Mar 2010HAL is a multi-disciplinary open access archive for the deposit and dissemination of sci-entific research documents, whether they are pub-lished or not. The documents may come from teaching and research institutions in France or abroad, or from public or private research centers.
L’archive ouverte pluridisciplinaire HAL, est destinée au dépôt et à la diffusion de documents scientifiques de niveau recherche, publiés ou non, émanant des établissements d’enseignement et de recherche français ou étrangers, des laboratoires publics ou privés.
Paris: a Desire Named Streetcar
Martin Koning, Rémy Prud’Homme, Pierre Kopp
To cite this version:
Martin Koning, Rémy Prud’Homme, Pierre Kopp. Paris: a Desire Named Streetcar. 2010. �halshs-00467896�
Version soumise à Transport Policy
1
Paris: a Desire named Tramway
Working Paper – January 2010
Rémy Prud’homme Emeritus Professor University Paris 12 (l’ŒIL) Avenue du Général de Gaulle,
94009 Créteil, France [email protected]
Martin Koning Phd Student
University Paris 1 (CES) Boulevard de l’Hôpital,
75013 Paris, France [email protected]
Pierre Kopp Professor University Paris 1 (CES)
Boulevard de l’Hôpital, 75013 Paris, France [email protected]
Abstract:
On the southern part of the Parisian Maréchaux’ boulevards, the old bus line Petite Ceinture has been replaced by a modern tramway (T3). Simultaneously, the road-space has been narrowed by about a third. A survey conducted on 1,000 users of the T3 shows that the tramway hardly generated any modal report from the private cars (PC) towards the public transit (PT). However, it did generate important intra-modal transfers: from bus and subways towards tramway concerning the PT, surely from Maréchaux’ boulevards towards the Parisian Ring-Road (boulevard périphérique, PRR) and/or adjacent streets for the PC. The various benefits and costs of these changes are evaluated in this research.
The welfare gains made by PT users are more than compensated by the time losses of the motorists, and in particular, by the additional cost of road congestion on the PRR. The same conclusion applies with regard to CO2 emissions: the reductions saved with the replacement of the busses and some (few) PC are less important than the increased pollution induced by the lengthening of the automobile trips and the increased congestion on the PRR. Even if one ignores the initial investment of 350 M€, the social impact of the T3 project, illustrated by its Clear Discount Value (CDV), is strongly negative. This is especially true for suburbanites. Concerning the lonely inhabitants (electors) of Paris, our analysis shows that they pocket the main part of the benefits while supporting a weak fraction of the costs.
Keywords: Tramway, Costs-Benefits Analysis, Road Congestion, CO2 Emissions JEL Classification: R41, D62, L92
Corresponding author: Martin Koning
2
Section 1.Introduction
In December 2006, the municipality of Paris inaugurated an 8 kms long tramway line on the
Maréchaux’ boulevards, i.e. in the south of the commune. The tramways are with the mode: having
one is perceived as a symbol of “modernity” and as a contribution to the fight against global warming. The desire for a tram was generalized among politicians. That one which occupies us was decided by M. Tiberi, the former mayor (classified on the right), and carried out by M. Delanoé, the current mayor (classified on the left)1.
As expected, the municipality presented the tramway as a great success. The media, somewhat surprisingly, sang unanimous praise to the project. The public opinion, including the majority of citizens who had neither seen nor taken the T3, was also conquered. As common sense suggests, the reality is however that the tramway project presents benefits and costs. It is legitimate to try to identify and evaluate them in order to produce a better-informed appraisal.
This is the purpose of the research presented here2. Section 2 presents the characteristics of the project and examines the induced changes in transportation patterns, which we will refer to as the structure of displacements. This enables us to quantify the monetary benefits and costs related to these changes (Section 3), as well as to the environmental impacts of the tramway (Section 4). Section 5 presents the purely financial data and calculates the CDV of the T3 project. Section 6 concludes3.
Section 2.The T3 project and its effects on the structure of displacements
This section will briefly present the T3 project in order to better understand the impacts it had on the structure of displacements in the area.
2.1. The scene and the components of the T3 project
The Parisian agglomeration includes 11 M inhabitants and is composed of approximately 1,200 communes. The municipality of Paris, the most central and the most important of these communes, contains 2 M inhabitants. It is girdled by two parallel roadways covering approximately 35 kms: the
Maréchaux’ boulevards which date from the beginning of the 20th century and are generally bordered by buildings; the Parisian Ring-Road (boulevard périphérique, PRR), one of the most frequented urban highway in Europe whose creation dates back to the sixties. These two roadways are about 300
1
This scarce unanimity should protect us from any “partisan” disclaim.
2 This research did not receive any financial support.
3 As transparency is an essential quality of any credible appraisal, we endeavoured to precisely indicate (with
sometimes the risk to weary the reader) the followed methodologies, the parameters used, and the calculations carried out.
3
meters apart. The Parisian agglomeration is an integrated whole, the exchanges between its various parts are intense, especially between central Paris and the remaining communes. According to the EGT (2002), Paris↔Paris displacements are less important than the suburbs↔Paris correspondents. The former constitutes 45% of the total PT displacements having Paris for origin or destination and 34% of the total PC displacements4.
The tramway was built on the Maréchaux’ boulevards, between Porte d’Ivry (13th district) and Pont du
Garigliano (15th district). This portion of 8 kms corresponds to about a quarter of the total length of the boulevards and constitutes what we will call the Ivry-Garigliano (IG) axis. Displacements on this axis are rather diverse in nature. The majority are parts of much longer trips whose origin and/or destination are outside the area. Some others count more as displacements of proximity. The IG axis, well covered by the PC and the trucks, was rather badly served by PT. It did not correspond to any underground line, even if combinations of radial ones made it possible to go from a point of the axis to another. It was mostly served by a bus line called the Petite Ceinture, which traversed the whole
Maréchaux’ boulevards and was the most attended bus line of Paris.
The T3 project had three components. The first was the removal of the Petite Ceinture bus line. The second was the construction of a modern tramway, which goes faster and is more comfortable. The new lines placement gives it exclusive priority with respect to other transportation modes. The third component was the reduction of approximately a third of the road-space formerly reserved for the PC and the trucks on the Maréchaux’ boulevards. To a certain extent, this reduction is the direct consequence of the municipal will to restrict the road-space (Prud’homme and Kopp, 2008). It is difficult to know the relative importance of municipality’s motivations for the T3 project. Therefore, we will first take it here as a whole and, then, discuss the impact of this choice (section 5).
2.2 Changes in the structure of displacements on the IG axis
The T3 project involved substantial changes in the structure of displacements on the IG axis. Two sources make it possible to measure them. The first one concerns the counting of vehicles on the
Maréchaux’ boulevards. The Observatory of the Displacements of the Parisian municipality measured
the daily traffic in 2003 and 2007 for 11 sections of the boulevards, which make up 4.5 kms. One can transform this data into vehicles*kilometers (vkms) and generalize it to the 7.9 kms of the IG axis. The year 2003 is selected as the year “before” the project because the T3 was still under construction during 2005 and 2006. Through the data, one can observe that the number of vkms passes from 152,800 to 89,500 between 2003 and 2007. This reduction of 63,300 vkms corresponds to a decrease of 41% of the PC use on the IG axis. It is possible to translate these figures into passengers*kilometers
4 This last figure does not take into account the displacements of the commercial vehicles (mainly
4
(pkms) by multiplying them by the occupancy rate of a vehicle (=1.3). One obtains approximately 198,000 pkms before the project and 116,000 after (= - 82,000 pkms).
The second source comes from an ad hoc survey, which we carried out on 1,000 users of the tramway between April and May 20075. To ensure a random selection of the users, the investigators went to a station, waited for a train to leave and questioned the first two users who arrived to catch the following one. The stations and the schedules were selected in a representative way of their use. Generally, the users said they were very satisfied with the tramway. The two most interesting answers for our analysis are related to the average length of their displacement in T3 (2.56 kms, a third of the length covered by the tramway) and to what these users did before its introduction.
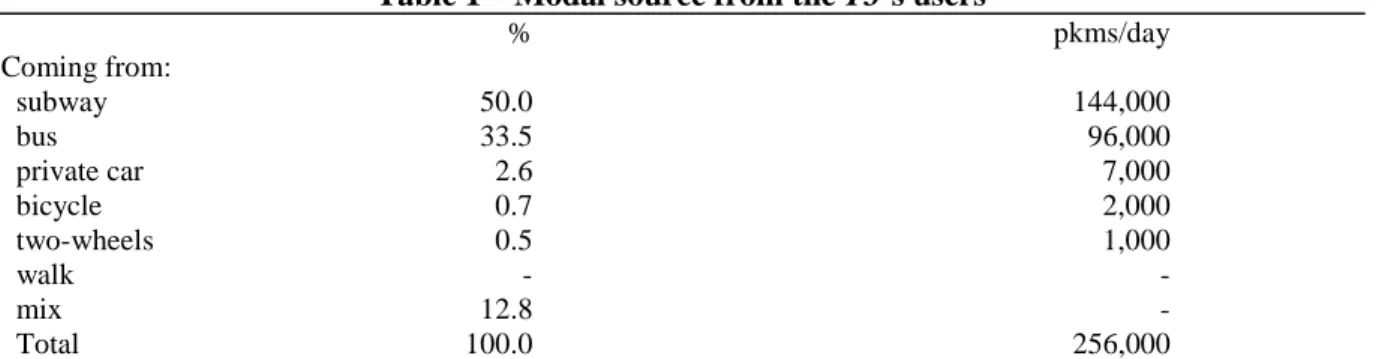
Table 1 – Modal source from the T3’s users
% pkms/day Coming from: subway 50.0 144,000 bus 33.5 96,000 private car 2.6 7,000 bicycle 0.7 2,000 two-wheels 0.5 1,000 walk - - mix 12.8 - Total 100.0 256,000
Source: Author’s survey. The « mix » answers include the users who realized their displacements with several
transportation means.
Table 1 presents the answers to the question: “before the tramway, how did you realize this commute?” It appears that the majority of users come from the bus (50%), which is not a surprising result. More astonishing perhaps is the prevalence of the former subway users (33.5%). It is finally seen that the T3 generated a very weak modal report (2.6%)6. The others changes are negligible. These figures make it possible to highlight the impact that the tramway had on modal transit.
A certain number of the commuters (denoted as M) realised their displacements on the IG axis with the subway. A little less than 40,000 of them gave up the subway for the T3, where they now realize 100,000 pkms per day. On one hand, these travellers must have improved their situation, or else they would not have changed. On the other hand, they relieved congestion in the subway. The 56,000 people who used the bus are in the tramway now, where they make 144,000 pkms. As we will demonstrate, their situation also improved. They equally join the 2,700 individuals (=7,000 pkms) who gave up PC for the T3, as well as some 1,000 people who formerly used the bicycle or the two-wheels. The 100,000 users of the T3 all benefited with the project.
5 A detailed presentation of this survey is available on www.pierrekopp.com
6 The number of motorized displacements having Paris as origin and/or destination is equal to 2.3 M per day
(EGT, 2002). The modal report induced by the T3 corresponds to a retreat minor than 1 per 1000 of the total Parisian displacements realized by car.
5
What about the people who used cars or trucks on the Maréchaux’ boulevards? It is known that they made 198,000 pkms there. A small number of these pkms, approximately 7,000, are now found in the
T3. A little more than the half is still carried out on the IG axis. Considering the 40% decline in usage
of the boulevards, their conditions must now be worst. Other pkms are eliminated by the evolution of circulation’s terms in Paris during the period, in particular by the rise of the fuel price and the road-restriction policy led by the municipality. The retreat of the traffic in Paris between 2003 and 2007 is estimated at 5% by the Observatory of the Displacements. It gives a measurement of the impact of this general evolution. In the absence of T3 project, the PC traffic on the Maréchaux’ boulevards would have decreased by 10,000 pkms. There are thus 65,000 pkms (=198,000–7,000–116,000–10,000) which miss the call.
Some of displacements corresponding to these 65.000 pkms were undoubtedly eliminated, generating a decline of the mobility. Others were undoubtly just detoured away from the Maréchaux’ boulevards. One obvious candidate for this detour is the PRR. Others are the streets more or less parallel with the
IG axis. In both cases, this change increases the congestion on alternative roads. The assumption will
be made that the level of congestion on these two alternatives is comparable7. For the needs of the analysis, we will consider that these missing pkms are carried out now on the PRR. Figure 1 helps to understand and estimate these changes.
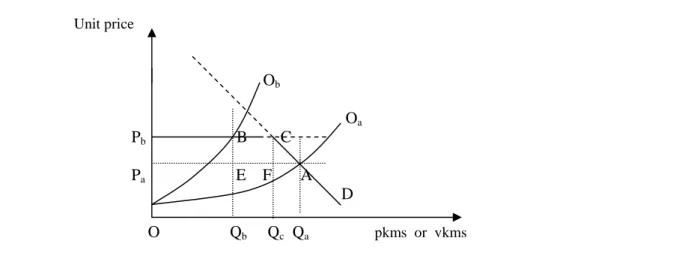
Figure 1 – Behaviour of the PC users on the Maréchaux’ boulevards
Unit price Ob Oa Pb B C Pa E F A D O Qb Qc Qa pkms or vkms
The bent line PbCA represents the demand curve for motorized displacements on the Maréchaux’ boulevards while the PbC line is the price of alternative displacements on the PRR. There is no reason for a user of the Maréchaux’ boulevards to pay more than the price of the alternative way on the PRR.
7
6
In addition, the Oa curve classically describes the phenomenon of road congestion on the Maréchaux’ boulevards. When the number of users increases, the road congestion increases too: the traffic speed decreases and the cost of a displacement, mainly composed by its time opporunity cost, becomes more expensive. The intersection of Oa and D defines the situation before the project, with a price Pa and a quantity Qa.
What are the consequences of the T3 project? By narrowing the road-space on the Maréchaux’ boulevards, it moves Oa to Ob. For the same level of use, there is thus more road congestion on the IG axis and PC users face a higher unit price. The intersection of Ob and PbCD defines a new equilibrium, with the price Pb and the quantity Qb. Hence, Qb travellers continue to use the
Maréchaux’ boulevards, BC (=EF=QcQb) travellers are now on the PRR (or somewhere else), and FA
(=QaQc) travellers reduced their mobility, at least on the IG axis.
2.3. The allowance of the missing pkms
To deduce the allowance of the 65,000 pkms eliminated from the Maréchaux’ boulevards, we can directly estimate F by means of the supposed elasticity (ε) of the demand curve. Indeed,
ε=(∆q/q)/(∆p/p), or equivalently ∆q=ε*q*∆p/p. If one refers to Figure 1: ∆q=FA, q=Qa, p=Pa and ∆p=PaPb.
We already know Qa (=152,300 vkms8 per day). By postulating a speed of 20 km/h on the
Maréchaux’ boulevards before the T3, it is possible to calculate Pa. For that purpose, one needs the
value of the time opportunity cost. For 2000, it was fixed at 9.3 €/hour (Instruction-cadre, 25th March 2004) for urban transport in Ile-de-France region. The same official text makes the recommendation to up-date this value according to the consumer’s expenditures affected by a 0.7 coefficient. For 2007, supposing an increase in consumption of 2% a year, one therefore obtains a time oppotunity cost equal to 10.2 €/hour. Knowing the fixed monetary cost of PC use (=0.12 €/vkm), we find Pa=0.783 €/vkm (=0.12+10.2*1.3/20).
We also need PaPb. It is logical to think that this over-cost is equal to the one generated by the detour towards the PRR9. We can calculate PaPb by means of several assumptions. First, the average length of trips on the Maréchaux’ boulevards is half of the total length of the tram, that is to say 4 kms. Second, the detour lengthens the displacement by two times 400 meters10. Third, this distance is
8
It is preferable to lead the analysis in terms of vkm and to return then to figures in pkm (by a multiplication of 1.3).
9 Or, if one prefers, the welfare loss resulting from the change of road pulled by the T3. This loss is quite real; if
not everyone would have used the PRR.
10
7
driven at an average speed of 20 km/h. It is then calculated that the over-cost corresponds to 0.6 minutes per km driven, i.e. PaPb=0.133 €/vkm (=(10.2/60)*1.3*0.6/20)11.
For the demand elasticity, one will start from Litman (2009) or Goodwin (1992) who propose values ranging between -0.6 and -0.8. These elasticities were calculated for whole trips. They are therefore not appropriated for the analysis of the displacements on the Maréchaux’ boulevards, which frequently constitute an under part of longer displacements (approximately two or three times). The demand on this section is consequently more inelastic. It is thus advisable to retain a demand elasticity (approximately two or three times) lower in absolute value. We made calculations for elasticities ranging between -0.4 and -0.2. The estimated retreat of mobility lies between 5,175 and 10,350 vkms per day (between 6,700 and 13,400 pkms). By considering a decrease in the mobility (FA) of 10,000 pkms, we deduce the number of reported displacements on the PRR (BC=55,000 pkms).
Table 2 finally synthesizes the changes in transportation patterns on the IG axis induced by the tramway.
Table 2 – Displacements on the IG axis, by transportation modes
Before (2003) After (2007) Difference Consequences
(pkms/day) (pkms/day) (pkms/day)
Public transportation (PT)
Subway M M-97,000 Decongestion
Bus & tramway 144,000 256,000 ∆ surplus
Total PT M+144,000 M+161,000 +7,000
Private cars (PC) and trucks
Maréchaux’ bvds 198,000 116,000 ∆ surplus
PRR P P+55,000 Congestion
Total PC P+198,000 P+171,000 -27,000
General total P+M+352,000 P+M+332,000 -20,000
Note: To find again the 198,000 pkms for 2003, one has to sum the 7,000 pkms that are now in the tramway, the
10,000 pkms eliminated by the transportation policy of the municipality and the 10,000 pkms corresponding to the retreat of mobility with the 116,000 pkms still realized on the Maréchaux’ boulevards and with the 55.000 pkms that have been reported on the PRR.
One sees that the T3 project involved (I) important intra-modal transfers (inside the PT’s means), (II) practically no modal report and (III) important road transfers for the cars. The increase in the supply of PT did not induce an increase in the frequentation of the PT. The whole mobility on the IG axis even recorded a reduction of a little less than 6%.
11 One can deduce from PaPb the traffic speed on the Maréchaux’ boulevards after the T3 project. In fact, since
8
Section 3.Surplus variations of travellers on the IG axis
We can now estimate the various benefits and costs associated with the changes in the structure of displacements on the IG axis. These impacts are diverse. The main part corresponds to the evaluation of time gains and/or losses.
3.1. Surplus variation of the PT’s users
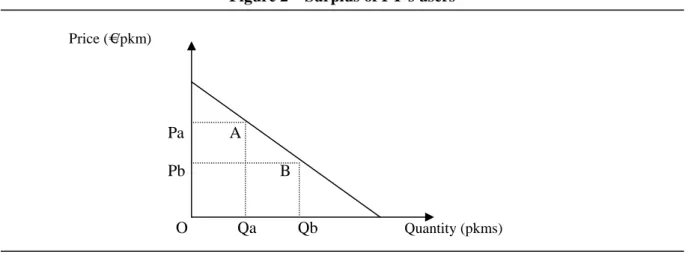
Let us start with the most obvious benefits: those of the T3’s users, or more exactly of the PT’s users. It is represented by Figure 2 where AB is the line of joint transport demand on the IG axis: the lower the price, the higher the demand. The situation before the tramway is indicated by the point A. It was seen that Qa was equal to 144,000 vkms. The unit price is Pa, which one does not need to know. The situation after the tramway is indicated by the point B with Qb equal to 256,000 vkms and a unit price Pb. To say that the T3 is better than the old bus is similar to recognize that Pb < Pa. Of how much? The improvement of the PT supply, i.e. the substitution of the bus by the tramway, has two advantages: it saves time and generates benefits in comfort.
Figure 2 – Surplus of PT’s users
Price (€/pkm)
Pa A Pb B
O Qa Qb Quantity (pkms)
One can easily calculate the variation of surplus generated by the time-savings. It is represented by the PaABPb surface. Speed increased from 16 km/h (by buses) to 20 km/h (by tramway)12 which corresponds to 0.633 minute saved per pkm. On the other hand, the latency has increased since it passed from 3.5 minutes with the bus to 4 minutes with the T3. For a trip of 2.56 kms, the corresponding waste of time equals 0.195 minute. On the whole however, the lenght of a displacement on the IG axis has decreased by 0.438 minute per pkm. As a consequence, the cost in time declines by 0.0745 €/pkm (=0.438*10.2/60=PaPb). With Qa= 144,000 and Qb=256,000, the PaABPb surface is equal to 14,900 € per day. By counting 300 days a year, we obtain 4.47 M€.
12 20 km/h was the official target but we cannot be sure that it has been reached. We will take it for granted, even
9
It is much more difficult to estimate the benefits due to the better comfort of the tramway. Doing so would necessitate complex and expensive contingent evaluations of the willingness to pay for increased comfort (or reduced discomfort). However, one cannot neglect these benefits. We will thus make the assumption that they are in the same order of magnitude as the time-savings13, while noting the very fragile character of these beliefs. For this reason, we retain our previously calculated benefit of 4.47 M€ a year.
3.2. Surplus variation of the motorists on the Maréchaux’ boulevards
The variation of the PC users is easy to calculate. It is equal to the sum of the wastes of time of the motorists who still remain on the Maréchaux’ boulevards and who can no longer drive as fast as before (surface PbBEPa on the Figure 1), added to those of PC users who make the turning by the PRR (surface BCFE) and to the welfare loss of the individuals who reduced their mobility because of the tram (surface CAF). It is thus equal to 7.02 M€ a year (=0.133*(171,000+10,000/2)*300). This cost is distributed between the motorists who remain on the Maréchaux’ boulevards with 4.63 M€, those who refer on the PRR with 2.18 M€, and with 0.21 M€ for those who have reduced their mobility.
However, this estimate does not take into account the fact that part (estimated at 20 %) of the vehicles are commercial ones whose the time opportunity cost is higher than that of PC. According to the
Instruction-cadre (25th March 2004) the time opportunity cost for the transportation of goods is fixed at 31.4 € per hour14. A simple calculation shows that it is then advisable to increase the figure calculated on the basis of the value of the time of the travellers by 27.3% (=((31.4*0.2)+(10.2*1.3*0.8))/(10.2*1.3)) . Therefore, the true cost is 8.91 M€ a year rather than 7.02 M €.
3.4 Congestion externality on the PRR
The PRR is a crowded road (Koning, 2010). Each additional vehicle slows down the traffic flow and thus affects all the vehicles. This cost is thus a marginal cost of congestion. As suggested in section 2, we have good reason to believe that a possible consequence of the T3 project was an increase in the traffic on the southern PRR (55.000 pkms=42.300 vkms).
13 Litman (2007) offers a review of studies related to the qualitative attributes of PT and to their valorizations.
He concludes that the welfare gains associated with qualitative improvements in the PT supply may reach the same order of magnitude than those associated with an increase in the traffic speed.
14
10
For the marginal cost of road congestion, the most used estimate comes from INFRAS (2000)15. It valuates this marginal cost at 2.70 €/vkm in the event of “dense” traffic and at 3.10 €/vkm in case of “true congestion”. The PRR is at least in situation of “dense” traffic. If one applies the corresponding value to the 42,300 additional vkms, he will find that the external cost of the tramway is equal to 114,210 €/day, i.e. 43.62 M€ a year. This estimate, financed by the International Union of the Railroads, is however probably a little exaggerated. It has the great disadvantage of being aggregated and of using single marginal cost16. We therefore prefer to apply the method used for the PRR in Prud’homme and Sun (2000) or Koning (2010).
For 2007, we lay out of approximately 25,000 data relating to flow, speed and concentration of the traffic on the IG portion of the PRR. A simple regression makes it possible to get an equation describing the traffic speed (s) as a function of the density (q):
s(q) = α + β * q = 85.3 + 0.264*q
(0.001) (0.140) R2 = 0.73 One is then able to deduce the private cost (I(q)) according to the density:
I(q) = 0.12 + 10,2*1.3/ v(q)
The marginal costs of road congestion are equal to the derivative of I(q) multiplied by the number of affected vehicles (i.e. the density) :
Cm(q) = 3.5*q/(85.3 + 0.264*q)2
These costs vary considerably according to the density (q) and thus, the associated speed. Being very weak and almost negligible when the traffic speed is higher than 50 km/h (0.1 €/vkm), it becomes more consequent for low speeds (18 €/vkm with a 7.5 km/h traffic speed).
The data used in Koning (2010) enable us to know the traffic distribution by speed class on the southern part of the PRR. By making the assumption that the reported vkms are distributed as those which normally attended the PRR, we can calculate the marginal costs of road congestion for each speed class ranging between 2.5 km/h and 75 km/h. It is enough to multiply these costs by the number of vkms additional to the different classes. While adding, one obtains the additional cost of congestion
15 It was often taken by the European Commission, and French organizations such as the French Institute of the
Environment (2004, p. 94).
16
11
caused by the vehicles which the T3 project rejects towards the PRR17. With a daily report of 55,000 pkms, this external effect of the tramway rises to 24.99 M€ a year. It is also necessary here to take into account the 20% of commercial vehicles. By using the 1.273 coefficient, one finally obtains an additional cost of congestion on the PRR equal to 31.82 M€.
Even minor than those calculated with values coming from INFRAS (2000), these additional costs appear thus very expensive for society. Since they represent the main consequence of the T3 project, in monetary terms at least, we will equally carry out the final calculation of the CDV (section 5) without taking into it account18.
3.5. The deceleration of the vehicles entering Paris
A certain number of the radials used by the motorists to enter Paris are perpendicular to the
Maréchaux’ boulevards, and thus to the line of tramway. These intersections are regulated by traffic
lights. With the difference of the buses Petite Ceinture which it replaces, the T3 enjoys the right of way at these traffic lights. This slows down a certain number of the vehicles entering or outgoing of Paris.
According to EGT (2002), the number of travellers Paris ↔ suburbs by car rose to 1.63 M per day in 2001. The tramway line makes up about the quarter of the circumference of Paris. Thus, one can estimate that about one quarter of these travellers (=407,000 per day) is affected. Let us estimate the average wait imposed by the tramway to be 20 seconds (=1/180 of hour). Given that the frequency of the T3 is of 3.5 minutes (210 seconds), we can postulate that the probability of being stopped is of approximately 1/10. We should also double this figure to take into account the fact that the tramway circulates in the two directions. The slow-down thus concerns 81,400 daily travellers. With the usual parameters, one finally calculates that the loss induced is of 1.83 M€ a year.
3.6. Clearing’s externality of the subway
The T3 created an intra-modal transfer of 96,000 pass*km from the subway towards the tramway. It may decrease the congestion in the subway, a phenomenon which implies a benefit of the project. Unfortunately, this benefit is very difficult to estimate. Despite the existence of hundreds of studies on the automobile congestion, there is practically nothing (nothing published at least) on the congestion in the PT. Works of Armelius (2006) and Litman (2007) are notable exceptions. However, one does not have a function representing the cost of congestion in PT according to its use. In addition, the ratio of the intra-modal transfer pulled by the T3 on the whole number of pkms in the Parisian subway
17 The details of calculation can be found in Appendix.
18 As well as the other consequences on PC’s users surplus of the road-space narrowing necessary to introduce
12
(0.4%) or on the whole places offered (0.1%) is not very significant since the report is concentrated on a small section of the network19.
We will nevertheless try to propose an estimate of this surplus gain. Litman (2007, p.11) advances an elasticity of the cost in time compared to the frequentation equal to 0.4. When the frequentation increases by 10%, the comfort (measured by the time opportunity cost) decreases by 4%. The reduction of 0.4 % of the subway’s frequentation generates thus an improvement in comfort equal to 0.16 % of the value of the time spent in the subway. Knowing that the time spent is approximately 280 Mh a year, the reduction of 0.4 % in the frequentation results in a comfort gain equal to 0.448 Mh, i.e. 4.57 M€ a year. As we said, this figure is to be taken with precaution. But it is not impossible. It belongs to the same order of magnitude as the time savings and also the benefits of comfort met by the
T3’s users.
Section 4.Environmental impacts of the T3 project
The T3 project has 5 impacts concerning the CO2 emissions. Two are positive. They come from the replacement of buses by the tramway and, very modestly, from the modal report. Two others are negative. They come from the lengthening of trips and the reduction in speed for the motorized vehicles. The last, which is generated by the retreat of the mobility, is unspecified. It is necessary to try to measure these effects. Before, it is helpful to consider the link between traffic speed and CO2 emissions.
4.1. Emissions-speed function
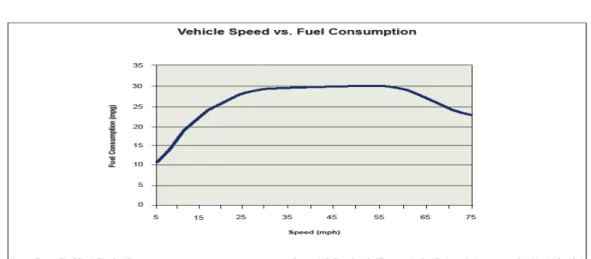
It is known that fuel consumption is a function of the velocity. It is infinite when speed is zero and decreases regularly when speed increases, up to 40-50 km/h. It stagnates then between 40-50 km/h and 90-100 km/h and increases again beyond this limit. The graph hereafter, which comes from the web-site of the Department of the Energy of the United-States, shows it clearly:
19
13
Figure 3 – Fuel consumption as a function of traffic speed
Source: www.fueleconomy.gov/feg/drive-Habits.shtml
Note: the fuel’s consumption is measured in miles per gallon (i.e. in kilometer per liter). This explains the
inversed form with respect to a graph expressed in liters per kilometer. We have searched (without any success) such a graph on the web-sites of French institutions such as ADEME, the Ministry of finance (energy) or Institut
Français du Pétrole.
It is easy to determine the function that connects fuel consumption and speed by considering the point where the curve cuts the y-axis20 and the point that corresponds to a speed of 30 miles/hour21. Once this function derived, one multiplies it by the CO2 emissions associated with a fuel consumption of one litter (=2.35 kg)22:
For s<50 km/h (expressed in kg/km): CO2(s) = 0.624 – 0.00925*s For s>50 km/h: CO2(s) = 0.16
This function is derived for PC. Actually, the traffic includes approximately 20% commercial vehicles which emit, on average, twice as much CO2 than PC. In that case, it will be then advisable to multiply the obtained estimate for emissions by a coefficient of 1.2.
4.2. Replacement of the buses
The frequency of the replaced buses was at the peak period of 17 buses per hour. By liberally counting 18 rush hours, there were 306 buses per day which traversed 2,417 bus*kilometers (=306*7.9, bkm). According to the Statistiques Annuelles (p.32) of the RATP23, the buses consume 0.567 litters of gas
20 s=5 miles/h=8.04 km/h ; fuel consumption=10 miles/gallon=0.23 litter/km 21
s=48.27 km/h ; fuel consumption = 30 miles/gallon=0.078 litter/km
22 We do not have found any similar equation for the French case. But Renaut communicated to us that, in urban
areas, passing from 10 km/h to 20 km/h induced an “economy” equal to 25%. Our estimate results in a 17% economy, amount not so far away.
23
14
per bkm. Thus, the removed buses consumed 1.370 litters of gas and emitted 3.22 (=1.370*2.35) tons of CO2 per day (=966 tons per year). The tramway, which operates with (nuclear) electricity, saved these emissions.
4.3 Modal report
A reduction in 7.000 pkms corresponds to 5.380 fewer vkms daily driven. By postulating a traffic speed of 20 km/h before the tramway, i.e. a CO2 emission of 0.439 kg/km, these vehicles emitted 2.36 tons of CO2 per day (=709 tons per year) on the Maréchaux’ boulevards. This is the amount of CO2 emissions saved by the T3 which attracted PC users.
4.4 Reduction in speed for the remaining vehicles on the Maréchaux’ boulevards
The number of PC which continue to use the Maréchaux’ boulevards on the IG axis fell by 36%, but still rose by 89,500 vkms per day. As demonstrated, this reduction comes from an increase in the cost necessary to use the Maréchaux’ boulevards. One previously estimated this cost to be 2.4 minutes for an average trip of 4 kms on the boulevards. With a speed of 20 km/h, this increase corresponds to a reduction of 16.7 km/h, that is to say a variation of approximately 17%24. The emissions-speed equation gives us the unit emissions associated with 20 km/h (=0.439 kg) and 17 km/h (=0.467 kg). The product of this difference by the number of vkms (=89,500) equals to a CO2 increase of 2.5 tons per day (=752 tons per year). Since the traffic in question includes commercial vehicles, we have to use the 1.2 coefficient. We thus obtain an estimate of 902 tons per year.
4.5 Reduction of the mobility
One could say that the people who experience a reduction in mobility on the IG axis do not consume any more gasoline. This daily economy attains 10,000 daily pkms, that is to say 7,692 vkms. By taking the same parameters as before, we find an annual CO2 benefit of 720 tons. Actually, the vkms eliminated on the IG axis are undoubtedly in many cases replaced by others displacements which might be as long as or even longer than the initial ones. Therefore, we will not thus count any profit nor loss for this reason.
4.6 Lengthening of the trips for the vehicles transferred towards the PRR
The vehicles transferred from the Maréchaux’ boulevards to the PRR travel at least 800 meters more than before. Some certainly travel much more. Therefore, they consume more fuel and emit more CO2. Assuming a 100% report (=42,300 vkms) and a range of 4 kms, we obtain an amount of 10,575 displacements of 0.8 km (=8,460 vkms). At 20 km/h, the corresponding unit emission is equal to 0.439 kg/km. With the usual parameters, one finds additional CO2 emissions of 1,337 tons per year.
24
15
4.7. Decrease in speed on the PRR
The principle environmental impact of the T3 project comes from the deceleration on the PRR due to the transferred vkms. These additional vehicles indeed slow down the whole flow on the infrastructure and thus increase the emissions of all the vehicles (all things being equal). This phenomenon is just the reverse side of the congestion’s externality studied previously.
This consequence can be calculated with rather good precision. It is indeed possible to cross the emission-speed equation with the speed-density relation. One obtains the quantity of CO2 emitted as a function of the density of the road:
CO2 = f(s) = λ+µ*v (with λ = 0.624 and µ = -0.00925) s = g(q) = α+β*q (with α = 85.3 and β = -0.264) This gives us:
CO2 = h(q) = λ + µ*α + µ* β *q
The marginal emission (CO2M), which in other words is the additional quantity of C02 caused by one vehicle added to a flow of density q, is the derivative of this function multiplied by q:
CO2M = h’(q)*q = µ*β*q = 0.0024*q
It is easy to calculate the marginal CO2 emission for each speed class and the associated density. Then, one just has to multiply this marginal emission by the number of additional vehicles in the speed class and to sum it25. With 42,300 veh*km displaced each day, the reduction of speed on the PRR reveals a surplus in emission by 8.4 tons of CO2 per day. It is also advisable to multiply this figure by the 1.2 coefficient in order to take into account the commercial vehicles. Finally, one obtains an increase in CO2 emissions by approximately 2,900 tons per year.
Table 3 – Impacts of the T3 project on CO2 emissions
(in tons of CO2 per year)
Before After Variation
Bus suppression 966 Zero -966
Modal report 709 Zero -709
Decrease in speed on the Maréchaux’ bvds 14,144 15,046 +902
Trips’ lengthening Zero 1,337 +1,337
Decrease in speed on the PRR +2,900
Total + 3,464
Source: authors’ calculations
25
16
Table 3 shows the various envirnomental impacts of the T3 project. All things being equal, the tramway contributes to an increase in CO2 emissions by more than 3,400 tons per year26. By retaining a conventional value of 25 € per ton, one obtains a cost less than 0.1 M€ per year with the bond of the greenhouse effect. This amount is rather negligible compared to the other profits and costs.
Section 5.Financial data and CDV of the T3 project
5.1. Exploitation and capital costs
Published information on the pure monetary costs associated with the T3 project is rather rare. One has only the ex ante costs envisioned in the official Enquête Public: 341.8 M€ for the initial investment and 43.9 M€ for the exploitation of the T3. The experiment suggests that the ex post costs are appreciably higher. However, let us suppose that the T3 was an exception and that the effective cost was equal to what had been anticipated. Being financed with budgetary funds, it is appropriate within the framework of the costs-benefits analysis to multiply this expenditure by the opportunity cost of the public funds (officially fixed at 1.3). There is thus an initial investment of 443.3 M€.
For the operational costs, we are only interested in the difference between the costs of the buses and that ones of the tramway. The operating costs of the buses are not published. The Statistiques
Annuelles of the RATP give the average costs of operation by trip, which is at 1.07 €. The removed
buses ensured 55,000 trips per day. This would suggest that the operating costs for the Petite Ceinture were approximately equal to 17.78 M€ per year. If this calculation were followed, the operational costs of the T3 would be 2.4 times higher (an over-cost of 26 M€). It is however necessary to be careful because these costs are certainly higher for the bus than that for the subway, so that average costs probably underestimate the operating costs of the buses. Therefore, it will be considered that the operating costs of the tramway are comparable with those of the buses27.
The users’ payments are hardly affected by the T3’s introduction. In fact, the large majority of the travellers paid already the same amount before. However, it was seen that the tramway attracted 3,850 new displacements. If they all paid the flat rate of 1.07 €/trip, that would increase the receipts of the RATP by 1.26 M€ per year. Actually, much of them undoubtedly profited a transport pass and took the tramway at a zero marginal price. Hence, one will liberally retain an additional receipt induced by the T3 equal to the two thirds of this 1.26 M€, that is to say 0.84 M€.
26 Even if one takes into account the CO2 savings associated to the retreat of mobility, the environmental balance
remains negative.
27
17
5.2. Economic appraisal of the T3 project
Table 4 presents the various components of our economic appraisal. They relate to the changes induced by the T3 project with reference to the ex ante situation (and to the former roadway system). Some of these estimates are more uncertain than others. Three in particular may be considered fragile: the comfort gains in the T3, the benefit of clearing the subway and the wastes of time of the vehicles entering/leaving Paris. In these cases, the available data does not allow to produce very solid figures. Even if one could have foregone using these estimates for this reason, it seemed that a bad estimate was better than no estimate at all.
From the socio-economic point of view, the T3 project appears to be deplorable. Not only did it require a significant investment. It also yearly costs more than it benefits to the society. We are not able to calculate any Internal Rate of Return (IRR) for the project since there does not exist any discount rate that could equalize the sum of the cash-flows. Let us repeat for non-specialists that this issue is not strictly a question of financial flows, but also of social and environmental resources. The CDV of the T3 project, calculated with the official rate of 4% over 30 years is established to –930 M€. It is a measurement of the resources’ wates induced by the T3 project.
Another way, perhaps more telling, to illustrate this consists in synthesizing these results by considering the annual cost of the investment and adding it to the benefits and costs of operation. The annual cost of the investment is equal to the opportunity cost of the capital and its amortization. With an opportunity cost of 4% and an amortization period of 30 years, one obtains an annual cost in capital equal to -59.24 M€. Added to the annual costs and benefits of -28.29 M €, one obtains a total cost of -87.53 M€.
Table 4 – Costs and benefits of the T3 project
Initial Yearly
(M€) (M€)
Initial investment -444.34
Operating costs pm
Variation operator’s surplus +0.84
Variation PT’s users surplus:
Time savings +4.47
Comfort gains +4.47
Decongestion of the subway +4.57
Variation PC’s users surplus
Time loses on the Maréchaux’ bvds -8.91
Time loses of the vehicles entering Paris -1.83
Externalities
Additional congestion on the PRR -31.82
Over-emmissions of CO2 -0.08
Totals -444.34 -28.29
18
One could argue that the costs, directly or indirectly, inflicted on PC users because of the road-space narrowing on the Maréchaux’ boulevards should not be taken into consideration during the CDV’s calculation28. To size this assumption, it is enough to be unaware of the costs relating to the wastes of time for PC users on the Maréchaux’ boulevards, as well as the increased congestion on the PRR29. The conclusions do not strongly differ. Even if a yearly benefit of 12.6 M€ can be found, this amount is unfortunately not enough to cover the initial investment of 444 M€. In fact, the CDV is still negative (-227 M€)30. Even if the tramway did not obstruct the automobile displacements, the project still would not be economically justified.
Section 6.Conclusion
This research does not claim to be the last word on the appraisal of the Parisian tramway. It nevertheless underlines the theoretical and factual gaps concerning the T3 while leaving open the possibility to improve our estimates. However, it appears sufficiently reasonable to draw some conclusions.
The tramway line, opened on the Maréchaux’ boulevards in December 2006, is an apparent success. It welcomes the users of the bus line that it replaced, as well as part of the subway users. These travellers profit from the project: they move more quickly than before, under better conditions of comfort, and the decongestion of the subway improves the situation of a larger number of people. These benefits represent, according to our estimates, approximately 15 M€ per year.
In the same time, the tramway was accompanied by an important reduction of the road-space on the
Maréchaux’ boulevards. This increased the road congestion on the Maréchaux’ boulevards and
reduced approximately by 40% the circulation. One estimated thus a 8.9 M€ loss to those who still use PC on the Maréchaux’ boulevards. Despite the improvements in the PT supply and this worsening of traffic conditions, it appears that the drivers have not given up their car for the tramway. In fact, only 2 or 3 percent of the actual T3’s users are former drivers31. Therefore, where did they go?
Some are discouraged and do not travel any more on the Maréchaux’ boulevards. The majority of them are now on roadways parallel to the Maréchaux’ boulevards and, probably, on the PRR. Here lies the devil. By doing so, they use longer routes and they waste time compared to the former situation. But the worst effect of the T3 project may come from the increased congestion on the PRR.
28
The road-space contraction was not necessarily imposed by the tramway and these losses therefore exaggerate the effects of the T3 project.
29 But not those of the travellers entering/outgoing from Paris. 30 In annual terms, the net loss becomes about 46.70 M€. 31
19
An additional vehicle on this infrastructure in fact slows down the whole traffic traffic and generates an important incremental cost of congestion. This could rise to an amount about 30 M€. Finally, the T3 project does not appear to deserve the chorus of praises that it received. It was expensive, its costs outweigh its benefits, in particular with regard to the fight against the greenhouse effect.
The trams are with the mode. But “the fashion, said Jean Cocteau, is what becomes obsolete”. In terms of political economy, the project is however probably interesting for the municipality of Paris. Its principle recipients are the T3’s users, who are mainly (57%) the Parisians, i.e. voters. The costs are for the motorists, who are mainly commuters and do not vote in Paris. The cost of capital was paid by the city of Paris only at a 15% level, and anyway, the municipal taxes are mainly paid by firms. As a result, the costs seem to be relatively painless for the voters. The environmental balance is in the negative, but this impact can be difficult to observe. It is in fact easier to notice that there are fewer cars on the Maréchaux’ boulevards than to notice the ones that are now on the PRR.
It is thus not very surprising that the T3 project had, and keeps, the favour of the Parisian elected officials. The idea to prolong the tramway on the remainder of the Maréchaux’ boulevards at an estimated cost of more than 600 M€ raises little opposition and has just been confirmed by the officials.
References
Armelius, H. and Hultzenkrantz, L. (2006) “The politico-economic link between public transport and road pricing: An ex-ante study of the Stockholm road-pricing trial”, Transport Policy, 13, pp. 162-172.
Direction Régionale de l’Equipement d’Ile-de-France (2002) Enquête Globale des Transports : Les
déplacements des franciliens en 2001-2002, 43 p.
Goodwin, P.B. (1992) “A review of New Demand Elasticities with Special Reference to Short and Long Run Effects on Price Changes”, Journal of Transport Economics and Policy, 26(2), pp. 155-169. Institut Français de l’Environnement (2004) Les Coûts environnementaux de l’automobile, 196 p. INFRAS-Zurich & IWWW-Karlsruhe (2000) External Costs of Transport: Accident, Environmental
and congestion Costs of Transport in Western Europe, 140p.
Koning, M. (2010) “The Social Cost of Road Congestion in Ile-de-France Region (and France): Empirical Evidences from the Paris Ring-Road”. Working Paper.
Litman, T. (2009) “Transportation Elasticities: How Prices and others Factors affect Travel
20
Litman, T. (2007) “Valuing Transit Service Quality Improvements”, Victoria Transport Policy Institute, 34p.
Ministère de l’Equipement, des Transports, de l’Aménagement du territoire, du Tourisme et de la Mer (2004) Instruction-cadre relative aux méthodes d’évaluation économique des grands projets
d’infrastructures de transport, up-dated on 27th May 2005.
Prud’homme, R and Sun, Y.M. (2000) « Le coût économique de la congestion du périphérique parisien : une approche désagrégée », Les Cahiers Scientifiques du Transport, 37, pp. 59-73.
Prud’homme, R. and Kopp, P. (2008) “Worse than a Congestion Charge: Paris Traffic Restrain Policy”, in Richardson, H. and Chang Hee, C.B. (eds.), Road Congestion Pricing Book, Edward Elgar, pp. 252-272.
Appendix
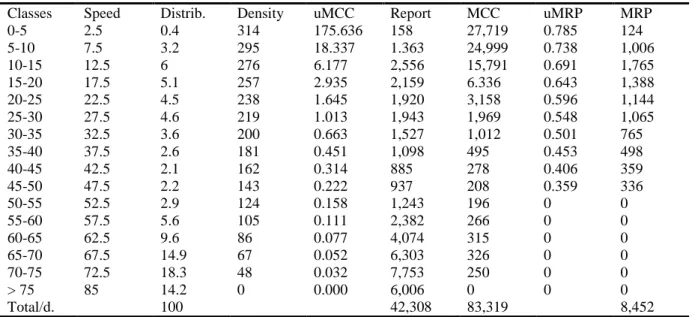
Table 5 – Additional road congestion and environmental costs on the PRR
Classes Speed Distrib. Density uMCC Report MCC uMRP MRP
0-5 2.5 0.4 314 175.636 158 27,719 0.785 124 5-10 7.5 3.2 295 18.337 1.363 24,999 0.738 1,006 10-15 12.5 6 276 6.177 2,556 15,791 0.691 1,765 15-20 17.5 5.1 257 2.935 2,159 6.336 0.643 1,388 20-25 22.5 4.5 238 1.645 1,920 3,158 0.596 1,144 25-30 27.5 4.6 219 1.013 1,943 1,969 0.548 1,065 30-35 32.5 3.6 200 0.663 1,527 1,012 0.501 765 35-40 37.5 2.6 181 0.451 1,098 495 0.453 498 40-45 42.5 2.1 162 0.314 885 278 0.406 359 45-50 47.5 2.2 143 0.222 937 208 0.359 336 50-55 52.5 2.9 124 0.158 1,243 196 0 0 55-60 57.5 5.6 105 0.111 2,382 266 0 0 60-65 62.5 9.6 86 0.077 4,074 315 0 0 65-70 67.5 14.9 67 0.052 6,303 326 0 0 70-75 72.5 18.3 48 0.032 7,753 250 0 0 > 75 85 14.2 0 0.000 6,006 0 0 0 Total/d. 100 42,308 83,319 8,452
Speed: average speed of the correspondent class (km/h)
Distrib.: distribution, in % and for each speed-class, of the observed vkms on the southern part of the PRR Density: (veh/km), calculated trough the speed-density relation q=(85.3 – v)/0.264
uMCc: unitary marginal cost of congestion (€/vkm), calculated with Cm(q)=3.5*q/(85.3 + 0.264*q)2 Report: in vkm, product of Distrib. with the total number of vkm daily reported on the PRR
MCC: marginal cost of congestion (€), product of Report with uMCC
uMRP: unitary marginal rejection of pollutant (kg/vkm), calculated with CO2M= 0.0024*q if speed < 50 km/h, CO2M=0 otherwise