HAL Id: hal-02545473
https://hal.archives-ouvertes.fr/hal-02545473
Submitted on 17 Apr 2020HAL is a multi-disciplinary open access archive for the deposit and dissemination of sci-entific research documents, whether they are pub-lished or not. The documents may come from teaching and research institutions in France or abroad, or from public or private research centers.
L’archive ouverte pluridisciplinaire HAL, est destinée au dépôt et à la diffusion de documents scientifiques de niveau recherche, publiés ou non, émanant des établissements d’enseignement et de recherche français ou étrangers, des laboratoires publics ou privés.
Guillaume Lenoir, Martin Picard, Jesper Møller, Marc Le Maire, Philippe
Champeil, Pierre Falson
To cite this version:
Guillaume Lenoir, Martin Picard, Jesper Møller, Marc Le Maire, Philippe Champeil, et al.. Involve-ment of the L6–7 Loop in SERCA1a Ca 2+ -ATPase Activation by Ca2+ (or Sr2+) and ATP. Journal of Biological Chemistry, American Society for Biochemistry and Molecular Biology, 2004, 279 (31), pp.32125-32133. �10.1074/jbc.M402934200�. �hal-02545473�
Involvement of the L6-7 loop in SERCA1a Ca
2+-ATPase activation by
Ca
2+(or Sr
2+) and ATP.
Guillaume Lenoir1, Martin Picard1, Jesper V. Møller2, Marc le Maire1, Philippe Champeil1
and Pierre Falson1,3.
1. Unité de Recherche Associée 2096 of the Centre National de la Recherche Scientifique and Section de Biophysique des Fonctions Membranaires, Département de Biologie Joliot Curie, CEA Saclay, 91191 Gif-sur-Yvette Cedex, and Laboratoire de Recherche Associé 17V and Institut Fédératif de Recherches 46, Université Paris Sud, France.
2. Department of Biophysics, University of Aarhus, DK-8000 Aarhus C, Denmark. 3. To whom correspondence should be addressed: +33 1 69089882 (tel), +33 1 69331351 (Fax), [email protected].
Running title: Role of L6-7 loop for SERCA1a Ca2+-ATPase function
Key words: SERCA1a ATPase, P-type ATPase, L6-7 loop, calcium, strontium, fluorescence.
Summary (250 words max)
Wild-type (WT) and Asp813Ala-Asp818Ala (ADA) double mutant of the L6-7 loop of SERCA1a ATPase were expressed in yeast, purified and reconstituted into lipids. In a solubilized state, ADA was poorly sensitive to calcium, contrarily to the reconstituted state which displayed a maximal calcium-dependent ATPase activity at high ATP concentration (1 mM) close to that of WT. However, monitoring Ca2+ binding of each reconstituted ATPase in the absence of ATP by
intrinsic or extrinsic fluorescence revealed a true affinity for calcium binding of 8 µM for ADA, 20-30-fold lower than that of estimated for WT (0.3 µM). At low ATP concentration (2 µM) and saturating Ca2+ concentrations ADA was nevertheless only poorly phosphorylated and displayed a
large reduction of calcium-dependent ATPase activity. Transient kinetics experiments revealed an overshoot in the ADA phosphorylation level, primarily arising from a large reduction of the Ca2+
-induced E2 to E1 transition rate. Furthermore, at high ATP concentration (1 mM), ADA had in fact a higher sensitivity to vanadate than WT, consistent with an increased concentration of the “E2” unphosphorylated form during turnover. ADA also proved to have a reduced affinity for ATP equilibrium binding in the absence of Ca2+. This study, the first performed with a purified mutant of
ATPase, reveals the central role of the L6-7 loop in coordinating events in the transmembrane and cytosolic domains. Particularly, it reveals the involvement of the L6-7 loop in the process that leads to acceleration of Ca2+ binding by ATP binding to dephosphorylated ATPase.
Introduction
Muscle relaxation is due to the removal of calcium from the cytosol and its accumulation into sarcoplasmic reticulum (SR) through an active transport consuming ATP (1,2). In fast twitch muscle this transport is achieved by the SERCA1a isoform of Ca2+-ATPase (3), with a
stœchiometry of two calcium ions transported per ATP molecule hydrolyzed (see reviews (4) and (5)). SR Ca2+-ATPase belongs to the family of P-type ATPases, which transport cations such as H+,
Na+, K+ or Ca2+ across the membrane and share a common mechanism that involves
autophosphorylation of the protein (see review (6)). Calcium transport is achieved through a reversible cycle during which the ATPase is thought to sequentially adopt two main conformations (7,8), E1 and E2, with a high and low affinity for calcium, respectively. Ca2+-ATPase in the E2
state is first activated to Ca2E1 by the binding of two cytosolic Ca2+ ions which triggers
phosphorylation of the protein from MgATP. The resulting phosphoenzyme, Ca2E1~P, is
“ADP-sensitive”, i.e. it is able to re-form ATP in the presence of ADP, but in the absence of ADP the bound calcium ions can no longer be released back to the cytosol and they are therefore described as being “occluded”. The Ca2E1~P phosphoenzyme then undergoes a main conformational change
to reach an “ADP-insensitive” E2P state in which the Ca2+ binding sites have a lumenal orientation
with a markedly reduced affinity for calcium, and from which calcium ions are released into the SR lumen. The E2P phosphoenzyme is finally hydrolysed back to the E2 state and the overall cycle corresponds therefore to completion of the following scheme: E2 à Ca2E1 à Ca2E1~P à E2P à
E2 (for a review see e.g. (9,10)).
Much effort has gone into determining the structural organization of SR Ca2+-ATPase, from
primary structure predictions (11), electron microscopy (12) and three-dimensional (3D)
crystallogenesis (13-15) (for a recent review see (16)). Finally, forty years after the discovery of SR Ca2+-ATPase, the structure has been solved at the atomic level, first in a Ca2E1 state (14) and then
in a thapsigargin-stabilized E2 state (15). The enzyme is organized in three cytosolic domains N, P and A, linked by a stalk to the membrane region, which projects with a short domain exposed to the lumen. The membrane domain contains two calcium-binding sites, distant from the
phosphorylation (P) and the nucleotide-binding (N) domains, with calcium liganding residues as previously revealed by site-directed mutagenesis (17,18). Comparison of the two 3D-structures shows that the cytosolic domains undergo very large movements, being separated from each other in Ca2E1 while they are in close contact in E2.
Previously, by combining limited proteolysis and site-directed mutagenesis, we have drawn attention to the cytosolic L6-7 loop (F809-S830), connecting transmembrane segments 6 and 7 (19-21). Cluster mutations D813A-D818A (ADA) or D813A-D815A-D818A (AAA) in this loop were found to reduce the Ca2+-dependent ATPase activity of the protein in its solubilized state (19) as
well as the protein’s apparent affinity for calcium, suggesting a role of the L6-7 loop in activation by calcium during the early steps of the cycle (20). Both the ADA mutations and the conservative related ones, D813N-D818N, were then found to reduce the amount of calcium bound to the protein at intermediate concentrations of Ca2+ (22). At this point, evidence was obtained from the
3D-structure of the Ca2+-ATPase that the L6-7 loop is located too far away from the two high affinity
calcium binding sites to participate directly in the binding of calcium to these sites. This was confirmed by the fact that wild type (WT) and mutant (ADA) ATPases were both able to occlude calcium in the presence of Cr.ATP (21). Moreover, a detailed site-directed mutagenesis study of several residues of the L6-7 loop highlighted its role in stabilizing the ATPase structure through an extended network of hydrogen bonds (23). A comparable study carried out with Na+,K+-ATPase
revealed that removal of the negatively charged residues in this loop only had a moderate effect on the affinity of the enzyme for potassium, and simultaneously revealed the higher sensitivity of these mutants to SDS (24). The reduction of the cation-binding ability of the Ca2+-ATPase L6-7 loop
corresponding to the L6-7 loop (G808-P827) which was found to interact with calcium and to bind lanthanum, in contrast with a related peptide in which an AAA cluster mutation had been
introduced (21). The L6-7 loop was thus suggested to provide an entrance port for calcium, with the negatively charged aspartic residues involved in a pre-binding site (21) and recent computer
simulations led to the same conclusion (25). However this proposal remains a matter of debate since Andersen and colleagues have recently reported that single D813L mutation in L6-7 and K758I in the 5th membrane span both result in a similar kinetic behaviour (26). From all these
experiments it appears that the L6-7 loop is functionally important, but in a way which still remains unclear and needs to be further clarified.
In the present work, we characterize WT and ADA ATPases by using classical approaches for these expressed proteins and also by monitoring ATPase conformational changes by intrinsic or extrinsic (FITC) fluorescence. The fluorescence approaches require a rather high level of protein purity, which could be obtained by using an improved yeast overexpression system (27) together with a recently developed procedure (28,29) to purify and reconstitute into lipids the expressed WT and mutated ATPases. The present results show that in a solubilized state, the ADA mutant
experiences a dramatic decrease of its calcium-dependent ATPase activity. On the contrary, reconstituted in a lipid environment, it displays an almost unaltered maximal calcium-dependent ATPase activity at saturating Ca2+ and high ATP, with an apparent affinity for Ca2+ altered only
moderately. In the absence of ATP, the true affinity of ADA for Ca2+ is however more seriously
reduced (20-30 fold) compared to WT. The apparent affinity for phosphorylation from Pi in the absence of Ca2+ is unaltered in the mutant, but the transition from the Ca2+-free to the Ca2+-bound
form of the ATPase is apparently slowed down quite significantly, as manifested by several criteria. In addition, we also obtain evidence for a slightly enhanced overall rate of dephosphorylation and a reduced true affinity for ATP binding to the ADA mutant in the absence of Ca2+. We conclude on
the basis of our data that the L6-7 loop is involved in an interplay between the ATP and Ca2+
binding sites, primarily to allow ATP to accelerate the E2 to E1Ca2 transition taking place before
Experimental procedures
Materials
The electrophoresis miniprotean 3, transblot module, GS-700 densitometer, Molecular Analyst software and Bio-beads were from Bio-Rad laboratories. Yeast culture products were from Difco Laboratories. N-dodecyl-b-D-maltoside (DDM) was from Anatrace Inc (Anagrade) and C12E8 was from Nikko Chemical Co (Tokyo). Low molecular weight markers and PD-10 columns
were from Amersham Biosciences. Other products were purchased from Sigma-Aldrich Corp. The STORM 860 Phosphorimager was from Molecular Dynamics. The rapid mixing QFM5 device was from Biologic, Chaix, France. The Multiskan Bichromatic spectrophotometer was from
Labsystems. The Sigmaplot software was from SSPS, Inc. The SimZyme software was a kind gift from Dr. Jens Peter Andersen (Aarhus, Denmark).
SR membrane preparation
SR vesicles were isolated from rabbit skeletal muscle according to de Meis & Hasselbach (30) and Champeil et al. (31). Before the preparation, the rabbits were subjected to a 48
h-starvation diet (32).
Expression of WT and ADA SERCA1a Ca2+-ATPase species in yeast
The methods used for construction of expression plasmids, cultures and preparation of membrane fractions were described previously (20,28). After induction by galactose of SERCA expression, yeast cells were broken and the light membrane fractions containing the expressed Ca2+-ATPase were collected by differential centrifugation and stored in a medium containing 10
mM Hepes-Tris pH 7.5, 0.3 M sucrose and 0.1 mM CaCl2.
Purification of C-terminal His-tagged Ca2+-ATPase
Expression and purification of WT and ADA ATPases were as described previously (28), with the following modifications during purification: (i) ADA Ca2+-ATPase was solubilized with
DDM at a detergent:protein ratio of 5:1 (w/w) instead of 3:1, (ii) after Ni2+-NTA affinity
chromatography the buffer of the pooled His-tagged Ca2+-ATPase was exchanged, using a PD-10
device, with buffer of the following composition: 25 mM Mops-Tris pH 7.0, 40 % glycerol, 1 mM CaCl2, 1 mM MgCl2, 0.5 mg/ml DDM, 1 mM DTT, 0.1 M KCl and 0.25 mg/ml of an egg yolk lipid
suspension. The lipid suspension was made up of a 10:1 ratio (w/w) of L-a-phosphatidylcholine (EYPC) and phosphatidic acid (EYPA), the resulting vesicles being homogenized to a size of 100-300 nm by passing the suspension through a filter device (Avestin, Hamilton) calibrated to 100 nm (33). The lipid concentration in the PD-10 pool was increased to 1 mg/ml by using the same EYPC-EYPA suspension, and DDM was then removed by adding 200 mg of Bio-beads per mg of
detergent and gently stirring for 3 hours. The size of the resulting reconstituted fragments was checked by freeze fracture electron microscopy (by courtesy of Jean-Marc Verbavatz, CEA
Saclay). Aliquots of the purified fraction were frozen in liquid nitrogen and stored at –80 °C. Purity was checked by SDS-PAGE after Coomassie blue staining, and quantitation of expressed Ca2+
-ATPase was performed with a GS-700 densitometer, using rabbit SR Ca2+-ATPase as standard.
ATPase activity measurements.
Spectrophotometric measurements of ATP hydrolysis by the Ca2+-ATPase was routinely
performed at 20 °C with an ATP-regenerating coupled enzyme assay originally described by Pullman and co-workers (34) and subsequently adapted (35,36). The reaction was performed in 2 ml of a medium containing 50 mM Tes-Tris, pH 7.0, 50 mM KNO3, 7 mM MgCl2, 1 mM
phosphoenolpyruvate, 0.1 mg/ml pyruvate kinase, 0.1 mg/ml lactate dehydrogenase, an initial concentration of about 0.3 mM NADH, 3-6 µg/ml of purified Ca2+-ATPase and 0.1 mM total
CaCl2. When needed, EGTA was added to yield the desired [Ca2+]free (37), using a Ca2+-EGTA
apparent dissociation constant of about 0.5 µM in the presence of 7 mM MgCl2 (0.4 µM in the
absence of Mg2+ at pH 7.0). The reaction was initiated by addition of either 2 µM or 1 mM
Na2ATP, as indicated. When indicated, a solubilizing concentration of 1 mg/ml of octaethylene
glycol monododecyl ether (C12E8) was added to the ATPase assay medium.
For studies of steady-state inhibition by vanadate, the ATPase activity was estimated from the amount of Pi liberated by a colorimetric assay. In that case, 2 µg/ml of sarcoplasmic reticulum membranes or 4 µg/ml purified and reconstituted WT or ADA ATPase were added to 140 µl of assay medium, containing 50 mM Mops-Tris at pH 7.0 (20 °C), 100 mM KCl, 5 mM Mg2+, 1 mM
MgATP, 2 µg/ml A23187, 1 mM phosphoenolpyruvate, 0.1 mg/ml pyruvate kinase and 100 µM total Ca2+. Various concentrations of orthovanadate were also added, up to 1 mM. ATP hydrolysis
was triggered by addition of the membranes and quenched by addition of 70 µl of 10 % SDS, supplemented with 0.05 % antifoam A. Inorganic phosphate was revealed with molybdate by adding 490 µl of a solution prepared by mixing one part of 4 % ammonium molybdate in 15 mM Zinc acetate at pH 5 with four parts of 10 % freshly prepared ascorbic acid, titrated to pH 5 with NaOH. The blue color developed over 90 minutes at room temperature (38,39) was read as duplicates in 96-well microtiter plates, at 690 nm on a Multiskan Bichromatic spectrophotometer. The concentration of phosphate released was calculated from standard curves (0-0.2 mM range) prepared in the absence or presence of vanadate. Note that vanadate inhibition experiments were performed with this phospho-molybdate colorimetric assay and not with the usual coupled enzyme assay in order to avoid artifacts due to the stimulation by vanadate of NADH oxidation, a
stimulation that occurs at submillimolar concentrations of vanadate independently of the presence of any hydrolytic activity (40-42) (see also Figure D in Supplemental Material).
Measurement of the ATPase “true” affinity for vanadate at equilibrium was achieved with 0.16 and 0.2 mg/ml of purified and reconstituted WT and ADA ATPases, respectively or 0.1 mg/ml SR membranes, preincubated with different vanadate concentrations for 60-80 minutes in the medium used for storage of the purified and reconstituted ATPases (25 mM Mops-Tris at pH 7.0, 40 % glycerol, 1 mM CaCl2, 1 mM MgCl2, 1 mM DTT and 100 mM KCl), supplemented with 4
mM Mg2+, 5 mM EGTA and 2 µg/ml A23187. Residual ATPase activity was then measured within
the first 30 seconds following a 20-fold dilution into a standard enzyme-coupled assay buffer (i.e. before vanadate release). This buffer contained 50 mM Mops-Tris at pH 7.0 (20 °C), 100 mM KCl, 5 mM Mg2+, 1 mM MgATP, 1 mM phosphoenolpyruvate, 0.1 mg/ml pyruvate kinase, 0.1 mg/ml
lactate dehydrogenase and 0.3 mM NADH, to which 300 µM total Ca2+ had been added to attain
100 µM [Ca2+]
free after addition of the preincubated membranes.
Fluorescence measurements.
Fluorescence measurements were performed with a Spex fluorolog instrument. Intrinsic fluorescence was measured with excitation and emission wavelengths of 290 nm and 330 nm and bandwidths of 2 and 20 nm, respectively. The intrinsic fluorescence of SR vesicles or purified and reconstituted WT or ADA Ca2+-ATPase added to the cuvette at about 5 µg/ml was measured at
20 °C in 2 ml of 150 mM Mops-Tris pH 7.0, in the absence of Mg2+ (which maximizes the
fluorescence signal; see Guillain et al. (43). In these experiments, the free Ca2+ concentration was
varied by adding appropriate concentrations of EGTA and Ca2+. Monitoring of intrinsic
fluorescence changes upon addition of inorganic phosphate was followed by suspending the membranes into a buffer containing 150 mM Mops-Tris (pH 7.0), 20 % Me2SO, 5 mM MgCl2 and
0.5 mM EGTA; those occuring upon addition of ATP were followed in a medium containing 150 mM Mops-Tris, pH 7.0 (20 °C), 5 mM Mg2+, 55 µM total Ca2+ and 2 mM EGTA.
ATPase labelling with fluorescein isothiocyanate (FITC) was performed by incubating SR or reconstituted WT or ADA ATPase (at about 10 µg/ml protein) with 2 µM of FITC, for 10 minutes at 20 °C and pH 8.0. Unbound FITC was eliminated using a PD-10 desalting column, pre-equilibrated with 150 mM Mops-Tris, pH 7.0 and 100 µM CaCl2. FITC-treated samples were then
diluted 4-fold in 100 mM KCl, 5 mM MgCl2 and 150 mM Mops-Tris, pH 7.0, and FITC
fluorescence measurements were carried out with excitation and emission wavelengths set at 490 and 530 nm, respectively (with 5 nm bandwidths).
Phosphorylation from ATP and Pi, and dephosphorylation experiments
Phosphorylation from [g-32P]ATP was measured at 20 °C unless otherwise indicated, by
adding 2 µM of 2 mCi/µmol [g-32P]ATP to WT or ADA mutated Ca2+-ATPase at about 2 µg/ml
(about 1 µg per assay) in buffer A (50 mM Mops-Tris, pH 7.0 (20 °C), 100 mM KCl, 5 mM Mg2+),
supplemented with various concentrations of CaCl2 (or of a Ca2+/EGTA buffer). Phosphorylation
measurements in the millisecond-range were performed at 20 °C with a rapid mixing and quenching apparatus. When indicated, ATPase phosphorylation was also measured in the same medium on ice, and dephosphorylation was subsequently triggered by adding 100 µM of non-radioactive ATP, followed by acid quenching (see below). Phosphorylation from [32P]Pi was
measured at 20 °C by adding 100 µM of 2 mCi/µmol [32P]Pi to about 10 µg/ml of WT or ADA
Ca2+-ATPase (about 1 µg per assay) suspended in 100 mM Mops-Tris (pH 7.0), 20 % Me2SO, 20
mM MgCl2, 100 µM Ca2+ and various concentrations of EGTA. In all cases, the reaction was
stopped by acid quenching with trichloracetic acid (TCA) and H3PO4, added at final concentrations
of 1 M and 67 mM, respectively. Samples were then left on ice for 20 minutes and centrifuged at 28,000xg for 25 minutes at 4 °C. Supernatants were discarded and pellets washed with 800 µl of 75 mM TCA and 5 mM H3PO4. After centrifugation, the pellets were resuspended by vortexing for
one minute in 50 µl of buffer containing 150 mM Tris-Cl pH 6.8, 2 % SDS, 10 mM EDTA, 16 % glycerol, 0.8 M b-mercaptoethanol and 0.04 % bromophenol blue. Aliquots of 20 µl were then loaded onto Sarkadi-type gels (44) for electrophoretic separation as detailed below. Alternatively, pellets were resuspended with 10 % lithium dodecyl sulphate, 5 mM NaH2PO4, 0.005 % SDS, 0.3
M b-mercaptoethanol, 20 % glycerol and 0.04 % bromophenol blue, and 20-µl aliquots were subjected to SDS-PAGE as described by Weber & Osborn (45).
Electrophoretic separation of proteins
For the analysis of Ni-NTA purification, proteins were separated on 8 % gels by Laemmli-type SDS-PAGE (46) and stained with Coomassie blue after one hour migration at 25 mA/gel.
Separation of phosphorylated proteins by SDS-PAGE was done by using Sarkadi-type gels as described previously (44,47,48), with the following modifications. The stacking gel contained 4 % polyacrylamide (29:1 acrylamide:bisacrylamide), 65 mM Tris-H3PO4 pH 5.5, 0.1 % SDS, 2 %
ammonium persulfate and 0.1 % N,N,N’,N’-tetramethylethylenediamine (TEMED). The separating gel was a continuous 7 % polyacrylamide gel containing 65 mM Tris-H3PO4 pH 6.5, 0.1 % SDS,
0.4 % ammonium persulfate and 0.05 % TEMED. Gels were run at 80-100 V and 10 mA/gel for about 3 h at 4 °C. The running buffer contained 0.1 % SDS and 170 mM Mops-Tris at pH 6.0, and was kept under stirring during electrophoresis. After electrophoresis, gels were stained and fixed for 10 minutes in 40 % methanol, 10 % acetic acid and 0.1 % Coomassie blue R250. Excess of dye was removed in 10 % acetic acid, 10 % methanol and 1 % glycerol. The gels were dried overnight between two sheets of cellophane paper. Radioactivity was revealed with a STORM 860
Phosphorimager and quantified by comparison with known amounts of [g-32P]ATP or [32P]Pi.
When indicated, samples were also run on acidic gels according to the method of Weber & Osborn (45).
Protein estimation
Proteins were estimated by using the bicinchoninic acid procedure (49) in the presence of 0.1 % SDS. The expressed Ca2+-ATPase was quantified after SDS-PAGE by immunodetection as
described previously (20). Data analysis
The SigmaPlot program (SPSS, Inc.) was used to fit to a Hill equation the data displayed in figures 2, 4, 6C, 7 and 8. The kinetic simulation software SimZyme (50,51) was used to simulate the amount of phosphoenzyme formed as a function of time.
Results
Purification and reconstitution of wild-type and Asp813Ala-Asp818Ala SERCA Ca2+
-ATPases expressed in yeast
Wild-type (WT) and Asp813Ala-Asp818Ala (ADA) mutated Ca2+-ATPases were expressed
and purified as described in “Experimental Procedures”, by using a protocol that we recently
proposed and which involves Ni-NTA affinity chromatography (28). The hexa-histidine C-terminus tag added to Ca2+-ATPase affected neither the expression nor the stability of the WT, as shown
before (28). Starting from yeast membranes containing 2 % of expressed Ca2+-ATPase (lane “Mb”
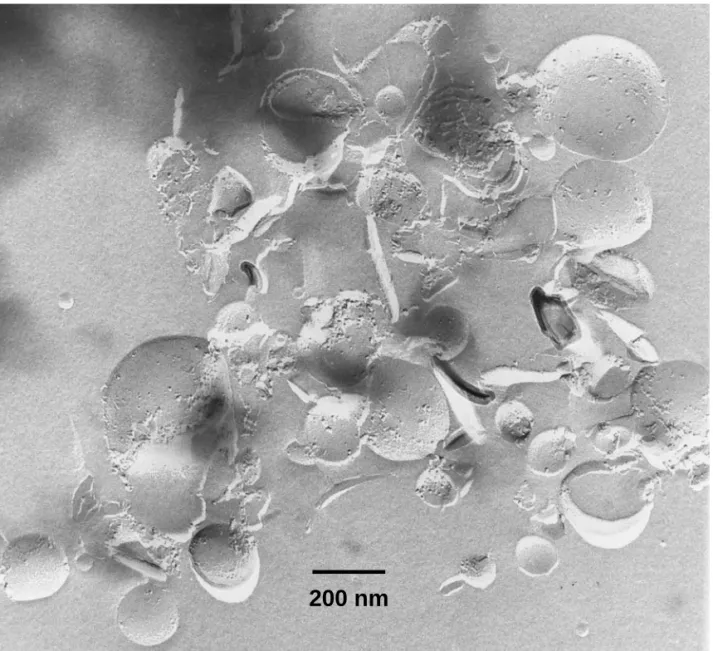
in Figure 1), WT and ADA ATPases were purified to about 50-60 % homogeneity (lanes “WT” and “ADA” in Figure 1). Our original procedure involved a second affinity chromatography step on a Reactive Red column, which was omitted here as the purity obtained after the first step was found sufficient for functional characterization of the purified enzymes. Reconstitution of the protein into lipids by detergent removal was necessary to optimize ATPase activity and stability; it allowed us to form lipid vesicles of 100 to 300 nm diameter which contained the reconstituted proteins, as shown by freeze fracture electron microscopy (Figure A in supplemental material, courtesy from Jean-Marc Verbavatz, CEA Saclay). Starting from 400 mg of light membrane proteins containing about 8 mg of expressed Ca2+-ATPase, we prepared approximately 0.6 mg of purified and
reconstituted WT or ADA ATPase. As far as we are aware, this is the first report of the purification of a mutated form of SERCA1a Ca2+-ATPase.
Ca2+-dependent ATPase activity of reconstituted or C
12E8-solubilized WT and
ADA-ATPases.
In our previous work, we had found necessary to add C12E8 to the ATPase assay medium for
measuring the activity of expressed Ca2+-ATPase, since the detergent reduces the background due
to contaminating ATPases or oxidases present in yeast membrane fractions (19,20). In the present work, the expressed SERCA was purified enough to be separated from most of the contaminants and C12E8 was no longer required. We were thus able to evaluate the activity of reconstituted WT
and ADA ATPases both in the presence and absence of detergent.
As can be seen from Figure 2A, in the presence of C12E8 and at 20 °C, the WT enzyme
(circles) displayed a maximal velocity of about 1.2 µmol ATP hydrolyzed/mg protein/min, with a
KM for Ca2+ of about 1 µM. This apparent affinity is in agreement with results obtained with Ca2+
-ATPase prepared from rabbit skeletal muscle (35), while the measured Vmax is 4-5 times lower than
that of rabbit SR Ca2+-ATPase. As previously discussed (28), this reduced V
max suggests that part of
the ATPase has experienced irreversible inactivation -presumably during purification- while the active fraction behaves in a normal way. Compared to WT ATPase, the ADA mutant (squares) was only weakly activated by increasing Ca2+ concentrations, as previously reported (20). As
b-D-dodecyl maltoside (DDM) was used throughout the purification procedure, we also tested the effect of that detergent on WT and ADA ATPase activities. As shown in the inset of Figure 2A, DDM was less deleterious for ADA activity than C12E8, although activation by Ca2+ remained rather
sluggish. For both preparations, activities measured at very low free Ca2+ concentrations were
similar, and probably arose from residual protein contaminants.
When ATPase measurements were now performed in the absence of detergent, as shown in Panel B of Figure 2, WT ATPase again behaved normally, i.e. its Vmax was essentially unchanged
and its KM for Ca2+ was slightly shifted towards higher affinity (about 0.3 µM), as previously found
for intact SR ATPase (35). Remarkably, the ADA mutant now displayed a full maximal velocity, with a KM for Ca2+ of 1-2 µM, only moderately higher than that of the WT. The limited effect of the
mutation on the KM for Ca2+ is in accordance with the results of Zhang et al. (22). Similar results
strontium (52,53), as displayed in the inset of Figure 2B. WT and ADA enzymes had KM values for
Sr2+ of 15 and 35 µM respectively, showing that the shift in cation affinity for ADA compared with
WT was the same for Ca2+ and Sr2+. To investigate whether the recovery in reconstituted ADA of a
fairly high affinity for Ca2+ or Sr2+ was dependent on trapping caused by the negatively charged
EYPA used for reconstitution, we repeated the same experiment with an enzyme reconstituted in the presence of EYPC only; but it turned out that the presence or absence of EYPA made no difference (Figure B in Supplemental Material). Hence, the poor sensitivity to Ca2+ of the
hydrolytic activity of the ADA mutant, shown in panel A and previously reported (20) mainly results from the fact that activity in this Panel was assayed under solubilizing conditions. Solubilization with C12E8, and to a lesser extent with DDM, markedly affects the functional
properties of the ADA mutant.
The striking effect of detergent led us to further explore the effect of C12E8 and DDM on
enzyme activity during the various stages of the solubilization process by measuring the hydrolytic activity of purified and reconstituted ADA and WT ATPase as a function of C12E8 or DDM
concentration. As can be seen in Panel A of Figure 3, an initial reduction of ATPase activity was observed for both WT and ADA ATPases in the presence of low, non-solubilizing concentrations of C12E8, as it is also the case for SR ATPase (54). Solubilizing concentrations of C12E8 (e.g. 0.3 - 1
mg/ml) allowed the WT enzyme to recover full activity, again as for SR ATPase (55). For ADA, however, activity recovery at intermediate concentrations of C12E8 was followed by steep
inactivation at higher detergent concentrations. Similar experiments were performed with DDM, as shown in Figure 3B, and revealed a less pronounced effect than that observed with C12E8; high
concentrations of DDM also reduced Ca2+-ATPase activity of the WT enzyme, as previously found
for SR ATPase (55). An unexpected common effect of both C12E8 and DDM on the ATPase
activity of the ADA mutant was that the above-mentioned inhibitory effect of sub-solubilizing concentrations of detergent, previously attributed to local delipidation of the protein (55,56), occurred at a significantly lower detergent concentration (0.05 mg/ml) than for WT (0.1 mg/ml), below the critical micellar concentration (cmc) of each detergent (indicated by an arrow in the Figure). This might suggest less firm interaction of lipids with the ADA mutant.
Ca2+- (and Sr2+-) dependence of conformational changes in unphosphorylated WT or
ADA ATPase, as monitored by intrinsic fluorescence.
Because of our initial proposal that the L6-7 loop plays an important role not only for ATPase activation by Ca2+, but also for high affinity Ca2+ binding (20), we were surprised by the
fact that the ATPase activity for ADA illustrated in Figure 2B only revealed a moderate shift in the apparent KM for Ca2+. We therefore aimed at measuring by an independent assay the true
equilibrium affinity for Ca2+ of the ADA mutant. Since changes in the intrinsic fluorescence of SR
Ca2+-ATPase have been shown to report on the conformational changes occurring upon calcium
binding to the enzyme (57), we took advantage of the relative purity of our reconstituted expressed ATPase to use intrinsic fluorescence to monitor Ca2+-dependent changes, as was also recently done
with WT purified SERCA1a Ca2+-ATPase expressed with the Sf9/baculovirus system (58). Such
measurements were performed at pH 7 in the absence of Mg2+ to maximize Ca2+-dependent
fluorescence changes (43). As shown in Panel A of Figure 4, starting from a situation where the total Ca2+ concentration in the fluorimeter cuvette was approximately 55 µM, the intrinsic
fluorescence intensity of the WT enzyme dropped when calcium dissociation from ATPase was triggered by the addition of excess EGTA. The relatively small amplitude of this drop, about 2 % versus 5-6 % for native SR (not shown), is consistent with the presence of protein contaminants in the partially purified preparations, as well as some inactive ATPase. When the free Ca2+
concentration in the medium was subsequently raised by sequential additions of Ca2+, the intrinsic
fluorescence level recovered up to its initial level (provided a high buffer concentration in these experiments was used in order to minimize pH-dependent changes in the fluorescence of
contaminant or inactivated proteins). From the plot displayed in Figure 4C, the affinity of WT Ca2+
-ATPase was estimated to be about 0.3 µM, a value close to that of native SR in the same conditions (0.4 µM), and consistent with that reported previously at pH 7 in the absence of Mg2+ (59).
As concerns the ADA mutant, its intrinsic fluorescence also dropped upon calcium dissociation, and finally regained a high intrinsic fluorescence upon addition of moderate
concentrations of Ca2+; however, raising the fluorescence to its maximal level required larger free
Ca2+ concentrations for ADA than for WT (Figure 4A). A similar shift in the affinity of ADA
compared with WT was also found when Sr2+ instead of Ca2+ was added to the Ca2+-free ATPases
(Figure 4B). By plotting changes in fluorescence intensity as a function of the free Ca2+
concentration (Figure 4C), the equilibrium dissociation constant (Kd) for Ca2+ of the ADA mutant
was estimated to about 8 µM, i.e. 20 to 30 times higher than that of the WT enzyme. Despite the absence of Mg2+ in the fluorescence assay (Figure 4C) and its presence in the hydrolytic activity
assay (Figure 2B), the Kd for Ca2+ binding to ADA (8 µM) deduced from the former assay is
significantly higher than the KM of 1-2 µM deduced from the latter, reflecting the difference
between equilibrium and turnover conditions (see below).
Ca2+-dependent or vanadate-dependent conformational changes in FITC-labelled
ATPases.
FITC covalently binds to lysine 515, a residue localized in the nucleotide binding domain of SERCA, and makes it possible to follow the conformational changes of the protein occurring in the cytosolic domain. Panel A of Figure 5 shows that FITC bound to WT ATPase responded to Ca2+
concentration changes in the expected manner, and that FITC bound to ADA ATPase again revealed a poorer affinity of ADA for Ca2+, compared with WT. Note that changes in fluorescence
of bound FITC, here examined in the presence of Mg2+ as in (60), suggest Kd values of about 1 and
10 µM for WT and ADA, respectively (not shown), values which are reasonably consistent with those obtained from the tryptophan fluorescence measurements (Figure 4) done in the absence of Mg2+.
In addition, Panel B in Figure 5 shows that FITC bound to WT ATPase also responded to addition of orthovanadate in the expected way (60). Thus, in the absence of Ca2+, vanadate
enhanced the fluorescence of bound FITC, while subsequent addition of a moderate calcium concentration (final free concentration of 100 µM) reduced the fluorescence of FITC back to initial level. FITC-modified ADA ATPase displayed the same behaviour as WT upon addition of EGTA and vanadate, indicating that both proteins undergo the same vanadate-dependent conformational changes in the cytosolic region. Contrarily to WT, however, subsequent addition of 100 µM free calcium was not sufficient to reverse the vanadate-induced conformational state, whereas addition of 1 mM was. Since WT and ADA ATPases bind vanadate with the same affinity at equilibrium as shown below, this is again consistent with a poorer affinity for Ca2+ of ADA ATPase, compared to
WT.
The ADA mutation therefore shifts the true Kd for Ca2+ binding deduced from the
fluorescence measurements by a factor of 20 to 30, larger than the factor of about 3 by which the
KM deduced from steady-state ATPase activities is shifted. This is an indication of significant
differences between the enzyme kinetics of the ADA mutant and WT enzymes, the basis of which was explored by examining various partial reactions.
Pi -dependent tryptophan fluorescence changes in WT and ADA ATPases,
phosphorylation from 32Pi, and competition with Ca2+.
Conformational changes resulting from phosphorylation from inorganic phosphate in the absence of Ca2+ were also monitored by intrinsic fluorescence, as shown in Figure 6A. Sequential
addition of Pi to the purified and reconstituted WT enzyme in its Ca2+-free state in the presence of
obtained in the presence of saturating Ca2+, while subsequent addition of a high calcium
concentration restored the initial level. This is in agreement with what was originally reported for the native enzyme (61). ADA underwent similar fluorescence changes upon binding of inorganic phosphate, indicating that the apparent affinity with which Pi raises tryptophan fluorescence was not modified by the ADA mutation (Pi½ being roughly estimated to 30-40 µM). Addition of a high
Ca2+ concentration again further raised the ADA fluorescence, up to the initial level, as expected.
Addition of more moderate concentrations of Ca2+ were less efficient for ADA than for WT (data
not shown), in agreement with the above-mentioned poorer affinity of ADA for Ca2+.
We also directly measured with [32P]Pi phosphorylation from inorganic phosphate of WT
and ADA ATPases and the effect of competition with Ca2+ on this phosphorylation. Results are
displayed in Figure 6B and 6C. For WT, the concentration of calcium for half-inhibition of phosphorylation from Pi was about 2 µM, consistent with previous data (20,62) and as expected slightly higher than the true Kd for Ca2+, because calcium binding competes with phosphorylation
from Pi. For ADA, half inhibition required the addition of 35-40 µM Ca2+, i.e. a calcium
concentration about 20 times higher than for WT, again consistent with all the above evidence for a lower affinity of ADA ATPase for Ca2+.
These measurements of Pi-derived phosphorylation data in the absence of Ca2+ therefore do
not reveal any clear implication of the L6-7 loop in the events occurring at the phosphorylation site in the cytosolic domain of the ATPase. A different conclusion was however reached when ATP-dependent phosphorylation was monitored, as described below.
Limited activation of ADA ATPase at low ATP concentration.
We next measured the ability of the purified and reconstituted ATPases to become
phosphorylated from ATP at various calcium concentrations, using an ATP concentration (2 µM) low enough to minimize any background noise. Panels A and B in Figure 7 show that under these conditions, the apparent [Ca]1/2 for calcium activation of phosphorylation of WT was again
submicromolar, as expected (here, approximately 0.7 µM) . There was also a slight further increase in phosphorylation at millimolar concentrations of Ca2+, probably due to CaATP replacing MgATP
as ATPase substrate, as described previously (20,63,64). For ADA, the amount of phosphoenzyme formed from ATP at submillimolar Ca2+ concentrations remained low, about 20-25 % of that of
WT, with an apparent [Ca]1/2 for calcium activation of phosphorylation that was roughly estimated
to be 30 µM. As in our previous experiments (Figures 3A and 4A in (20)), the phosphorylation level further increased at higher (millimolar) Ca2+ concentrations, approaching the same level as for
WT ATPase. In our previous experiments, we had estimated that the small amount of
phosphoenzyme formed at submillimolar Ca2+ concentrations was not significant (Figures 3A and
4A in (20)); however, because of the above demonstration of the ability of ADA to bind low concentrations of Ca2+, we now believe that this small amount is indicative of the turnover
properties of the ADA mutant, while the higher phosphorylation level found at very high Ca2+
concentrations is due to the stabilization of phosphoenzyme arising from replacement of magnesium by calcium at the hydrolytic site. This conclusion was confirmed by time-resolved experiments, showing that dephosphorylation was slower following an initial phosphorylation at a high Ca2+ concentration than following an initial phosphorylation at an intermediate submillimolar
Ca2+ concentration (Figure C in Supplemental Material).
In trying to understand the apparent discrepancy between the quasi-normal ATPase activity of the reconstituted ADA mutant shown in Figure 2B and the fact that the amount of
phosphoenzyme formed from ATP was so strongly reduced for this mutant at submillimolar Ca2+
concentrations, we realized that very different concentrations of ATP were employed in the two situations, 2 µM for the phosphorylation assay and 1 mM for the ATPase activity assay. We
therefore checked the effect of a low ATP concentration on the hydrolytic activity of ADA ATPase. As displayed in Figure 7C, at 2 µM ATP the Vmax of ATP hydrolysis of the WT enzyme was 0.7
µmol ATP hydrolysed/mg Ca2+-ATPase/min, corresponding to about 70 % of the V
max measured at
1 mM ATP. The KM for calcium activation was about 0.4 µM, close to the value estimated at the
higher ATP concentration (Figure 2B). In contrast, the ADA mutant displayed a much lower Vmax
for Ca2+-dependent activity at 2 µM ATP, about 0.2 µmol ATP hydrolysed/mg Ca2+-ATPase/min,
corresponding to only 20 % to that of the WT. The ATPase activity of ADA was thus dramatically reduced compared to that measured at high ATP concentrations, and consequently activation by Ca2+ was limited, a behaviour similar to what was observed above in Figure 2A at high ATP, but in
the presence of C12E8.
ADA ATPase is stabilized in E2 at low ATP concentration, due to a reduced E2 to
Ca2E1 transition and an acceleration of dephosphorylation.
The above-described combination of a low hydrolytic activity and a low steady state phosphorylation of the ADA ATPase would be consistent with the view that the dephosphorylated form E2 of the enzyme accumulates at steady-state at low ATP concentration. A possible reason for such an accumulation would be a slowing down of the Ca2+-induced transition from the
unphosphorylated E2 to the Ca2E1 form, as previously reported for the D813N-D815N-D818N
cluster mutant (23). Subsequently, a similar proposal has been made for the D813L mutant (26). In all these cases, the E2 to E1 transition indeed becomes rate-limiting at low ATP concentration, while this is not necessarily the case at high ATP concentrations since the E2 to Ca2E1 transition
has been shown to be accelerated by bound ATP (65-70). We have evaluated the validity of this hypothesis by checking whether the phosphorylation level of the ADA mutant at a low ATP concentration and a moderate Ca2+ concentration can transiently reach a higher value during
pre-steady state than during pre-steady state when starting from Ca2+-saturated ATPase. Figure 8A shows
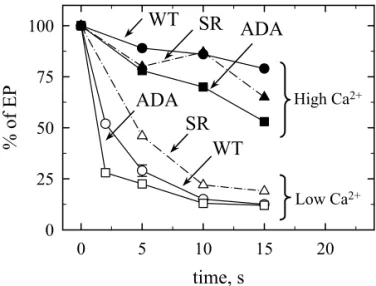
that when the time course of phosphorylation from ATP was followed in a sub-second time scale at 20 °C, the WT enzyme reached a maximal phosphorylation level within about 0.1 s and then remained essentially constant during the time course of the experiment. In contrast, the ADA enzyme displayed an overshoot in phosphorylation, attaining within 0.1 s a maximal level
corresponding to about 40 % of that of the WT enzyme and then declining to a level of 20-25 % of WT after 0.6 s.
A similar behaviour has also been reported for mutants K758I in M5 (71,72) or D813L in L6-7 (26), and interpreted as being due to a reduced rate for the E2 à Ca2E1 transition. The
overshoot reported by these authors was more pronounced than that reported here, which at least partially can be attributed to the higher ATP concentration they used (5 µM, compared to the 2 µM ATP used here) and leading to a faster initial phosphorylation rate. In addition, the more limited extent of our overshoot could also be ascribable in part to an increased rate of dephosphorylation in the double ADA mutant compared to the single D813L mutant, due to the additional D818A mutation in ADA. When we monitored the rate of dephosphorylation of ATPase by a chase with unlabeled ATP (Figure 8B), dephosphorylation of the ADA mutant was indeed moderately enhanced compared with WT, being about three times faster. Such acceleration of
dephosphorylation will of course reduce the transient overshoot in phosphorylation, and favour accumulation of E2 during steady-state catalysis. Computer simulation of the transient kinetics of phosphorylation of Panel A was carried out with the SimZyme software (71), reducing the cycle to three main species: E2 à Ca2E1 à Ca2EP à E2. An additional constraint placed on these
simulations was that steady-state ATP hydrolysis by ADA was requested to remain significantly below that of WT ATPase as a consequence of the low ATP concentration used (Figure 7C). The best values obtained for the rate constants of the three transitions for WT were 20, 14 and 4 s-1
respectively. These values are reasonably consistent with those (25, 35 and 5 s-1) calculated from
the same kind of experiments with COS cells expressing Ca2+-ATPase and at 5 µM ATP (71).
Values obtained for ADA were 1.4, 6 and 10 s-1, suggesting indeed that the E2 à Ca2E1 reaction
dephosphorylation Ca2E1P à E2 increases 2-3-fold and the rate of phosphorylation Ca2E1 à
Ca2EP drops by about two-fold. The latter changes in rates contribute to making the amplitude of
the observed overshoot only moderate.
ADA ATPase sensitivity to orthovanadate during turnover at high ATP concentration also reveals increased accumulation of E2.
We then asked whether accumulation of the E2 form of ATPase during steady state turnover, shown above to occur in the presence of 2 µM ATP as a result of the reduced rate of the E2 to Ca2E1 transition, also occurs in the presence of a high ATP concentration. To address this
question we used the classical procedure of evaluating to what extent ADA turnover is inhibited by orthovanadate, an inhibitor thought to react with the E2 form of ATPase only (e.g. (73)). We therefore measured the ATPase hydrolytic activity in the presence of increasing concentrations of vanadate. Figure 9A shows that the EC50 for turnover inhibition by orthovanadate in the presence of
1 mM MgATP was about 20-fold lower for ADA than for WT ATPase (about 4 µM versus about 70 µM), consistent with a higher proportion of the E2 form during steady-state cycling of the ADA mutant, compared to WT.
A prerequisite, however, for this conclusion, is that the true affinity of E2 for orthovanadate is the same in WT and ADA ATPases. To address this question we took advantage of the fact that upon dilution of previously inhibited Ca2+-ATPase, bound vanadate is released fairly slowly,
namely over a few minutes (60,74,75). This was checked in preliminary experiments (see Figure E in Supplemental Material). We therefore pre-incubated Ca2+-free ATPase in the presence of various
concentrations of orthovanadate for more than one hour, to allow for equilibration at all vanadate concentrations, and deduced the proportion of uninhibited ATPase from the rate of ATP hydrolysis observed during the first 30 seconds after 20-fold dilution of the ATPase into a standard coupled-enzyme assay medium. Figure 9B shows that WT and ADA ATPases were inhibited by vanadate with about the same EC50 (about 2 µM), confirming that the higher sensitivity of ADA turnover to
vanadate illustrated in Figure 9A probably arises from a larger proportion of E2 present during turnover and not from a different intrinsic affinity for vanadate.
Note that in Panel A and Panel B of Figure 9, vanadate inhibition was found to be slightly more effective for SR than for WT ATPase, with respect to both the extent of inhibition and the EC50. The first fact at least is easily understandable, as essentially all ATPase activity in SR
vesicles is due to the SERCA, whereas this is not the case in our partially purified expressed ATPase.
The ADA mutation reduces affinity for ATP at equilibrium.
The fact that ADA at a high ATP concentration has an almost unaltered Vmax(Figure 2B)
implies that the high ATP concentration at least partially compensates for the slowing down of the E2 to E1Ca2 transition, so that the rate of this transition is no longer rate-limiting. Nevertheless the
transition is likely to remain slower in ADA than in WT, also at high ATP concentrations, as ADA is more sensitive than WT to inhibition by vanadate. Simulation of the cycle with reasonable values for the rate constants confirmed this qualitative conclusion (data not shown). Still the question remains whether ATP, by binding to the E2 conformation, stimulates the rate of the (intrinsically slower) transition in ADA with the same nucleotide binding affinity as it does in WT.
Monitoring tryptophan fluorescence of purified and reconstituted WT and ADA ATPases, as was done previously for SR vesicles (76), provides a method by which we were able to directly estimate the equilibrium affinity of ATPase for ATP in the absence of Ca2+. This is shown in Figure
10, in which Panel A displays control measurements done with SR vesicles and Panel B the results with WT and ADA ATPases. Although the amplitude of the ATP-induced changes is not much larger than the noise level in the measurements, it is clearly seen that experiencing a perceptible conformational change for ADA mutant requires higher concentrations of ATP than for WT
ATPase. The Kd of ATP binding to WT ATPase was roughly estimated to be about 2-4 µM under these conditions, similar to that for SR itself, while for the ADA mutant it was obviously larger, probably above 20 µM.
At this step, it may be relevant to point out that the rate of ADA phosphorylation from ATP that we deduced from the analysis of our pre-steady state experiment was moderately slower than that for WT (inset to Figure 8A). Experimentally, a similar slowing down was also found by Zhang
et al. (77). Although our above-estimated Kd values for ATP refer to ATP binding in the absence of
Ca2+, a similar reduction in affinity might also apply to the binding of ATP to ADA in the presence
Discussion
Detergent sensitivity of ADA ATPase
The importance of the L6-7 loop in the function of SERCA1a Ca2+-ATPase was initially
revealed by the fact that replacing aspartic acid residues 813 and 818 by alanine reduced Ca2+
-dependent ATPase activity very significantly: under the assay conditions used, the ADA mutated enzyme displayed a very low ATPase activity, amounting to only about 10 % of that for WT ATPase (Figure 5 in (19) and Figure 2 in (20)). At that time, as we were working with yeast microsomal membranes, we found it necessary to add a solubilizing concentration of C12E8 to the
medium during the activity measurements to suppress the non-specific hydrolytic activity arising from other proteins present in yeast membranes which made it difficult to unambiguously attribute the small Ca2+-dependent activity (amounting to about 2 % of total activity in the absence of
detergent) to expressed SERCA1a. The same ADA mutant enzyme, expressed in COS cells, was later reported by Zhang et al. (22) to display a significant Ca2+-dependent ATPase activity, up to
about 30 % of that of the WT enzyme, a level of activity that was detected without any detergent added to the medium (Figure 4D in (22)). In the same work, the mutation was also reported to reduce the apparent affinity for calcium, but only to a moderate extent, suggesting for ADA a much better sensitivity to calcium than the millimolar sensitivity that we had described previously on the basis of phosphorylation experiments.
These experimental discrepancies were rather puzzling, but a satisfactory explanation for them now arises from the present work. We have found that after purification and reconstitution into lipids, the ADA enzyme behaves more like WT ATPase when activity is measured in the absence of detergent and at a high ATP concentration, from the point of view of both its apparent affinity for Ca2+ and its maximal velocity. In contrast, when activity is tested in the presence of
solubilizing concentrations of detergent, the purified mutant displays the same low ATPase activity and poor affinity for Ca2+ as we have described previously.
Inhibition by detergent of the ADA ATPase activity seems to be of a reversible nature since the final reconstituted preparation retains activity despite the 18 hour-incubation period, in the purification procedure, during which the ATPase is maintained in a solubilized state in the presence of detergent and Ca2+ before reconstitution into lipids. In this respect the ADA mutant resembles
WT ATPase for which it is well established that irreversible loss of activity can be avoided during solubilization if the latter is performed in the presence of Ca2+ and lipids (36). Compared to WT
ATPase, however, a difference is that the activity of ADA enzyme is sensitive to sub-solubilizing concentrations of C12E8 or DDM lower than for WT. Such concentrations induce a reversible
decrease of ATPase activity, as initially described for the native Ca2+-ATPase by Andersen et al.
(54) and de Foresta et al. (55,56,78). If, as suggested by de Foresta et al., this perturbation is due to partial replacement of tightly associated lipids by detergent (55) and/or possible loss of one of the high affinity calcium-binding sites (56), the increased sensitivity of the ADA ATPase to mild detergent may suggest that specific interactions between the protein and some lipid molecules are weakened or lost in the ADA mutant. It could also be an indication that these lipids are close to the L6-7 loop, with possible consequences for the high affinity calcium-binding sites. Interestingly the replacement of acidic residues of the L6-7 loop of the Na+,K+-ATPase by alanine residues was
recently reported to make the mutant more labile during extraction by SDS (24). Perhaps the loss of negative charges in all these L6-7 loops mutants (which retain positive charges at the other end of the L6-7 loop) might affect local dipoles which become critical for stability when the lipid water interface is destroyed by solubilization.
The ADA mutation reduces the true Kd for Ca2+ or Sr2+ binding and slows down E2 to
Ca2E1 transition, impairments which are partially reversed by high ATP concentrations.
By monitoring the intrinsic fluorescence or the extrinsic fluorescence of purified and reconstituted ATPase at equilibrium in the presence of various Ca2+ concentrations (Figures 4 and
5), we found that calcium binding to the ADA enzyme occurs with a Kd 20-30-fold higher than that for the WT enzyme, being shifted from a submicromolar value up to about 10 µM under standard conditions (at pH 7 in the presence of Mg2+). This reduction in the true affinity for Ca2+ of ADA
ATPase is confirmed by the data of Zhang et al. (22) who found that at a free concentration of 3 µM Ca2+ less 45Ca2+ binds to this mutant than to WT ATPase. This 20-30-fold difference in true
Ca2+ affinity for ADA versus WT ATPase is seemingly at variance with the smaller 3-fold
difference in the apparent affinity (KM) with which Ca2+ activates the ATPase at high ATP
concentrations (Figure 2B). However, here it should be realized that the KM for Ca2+ activation may
be affected not only by the affinity with which the cation binds at equilibrium but also by the rate constants for the other steps in the cycle (see e.g. (51,79) for examples and simulations). Thus the findings that the ADA mutant has retained full ability to bind Ca2+ with a reduced affinity, whereas
steady-state measurements performed at low ATP hardly reveal any activation by Ca2+ of either
steady-state phosphorylation or ATPase activity (under these conditions, EPmax and Vmax are much
smaller for ADA than for WT, see Figure 7), can be easily understood on the basis of the reduced rate of the transition between the Ca2+-free E2 and Ca2+-bound E1 forms of ADA ATPase (Figure
8A). This transition, which accompanies calcium binding, is an intrinsically fairly slow reaction, which is accelerated very significantly by low levels of ATP, so that at high ATP under usual assay conditions this step is no longer rate-limiting for the entire cycle (65,67,68,70,80,81). With WT ATPase this situation already occurs at 2 µM ATP, resulting in phosphorylation of the enzyme at a high level. This is clearly not the case for the ADA mutant, whose E2 to Ca2E1 transition rate has
been significantly reduced (Figure 8A and (77)). However a high ATP concentration such as 1 mM succeeds in relieving this rate limitation (simulation not shown). In other words, a high ATP concentration overcomes the functional deficiencies due to the mutation. For the ADA mutant in the absence of ATP, this reduced rate of the E2 to Ca2E1 transition of course contributes to a shift
towards a lower affinity of this mutant for Ca2+ at equilibrium.
Further consequences of the ADA mutation on the rest of the cycle, and role of the L6-7 loop at the molecular level.
We showed previously that the L6-7 loop plays a major role in ATPase activation by Ca2+
(20), and some of these early results advocated a direct role of D813 and D818 in the initial binding of Ca2+, perhaps as an entrance gate, a hypothesis explored further in direct metal binding
experiments (21). Along this view, which was also adopted in an in silico study (25), the present findings that the ADA mutation reduces the overall ATPase affinity for Ca2+ and for Sr2+ to the
same extent (Fig C in Supplemental Material versus Figure 4A, and inset versus main panel in Figure 2B) suggests that the putative L6-7 pre-binding site (21) does not have any preference for Ca2+ over Sr2+. Conversely, since the rate of the E2 to Ca
2E1 transition is generally thought to be
rate-limited not by Ca2+ binding per se (or even dehydration) but, instead, by a conformational
transition, proposed to occur either after binding of the first Ca2+ ion (80) or before binding of the
first Ca2+ ion, which in that case corresponds to proton deocclusion from “E2”, e.g. (82,83). The
fact that the ADA mutation reduces the rate of this transition seems to favour the alternative hypothesis, i.e. an indirect effect of the mutation (this would account equally well for the similar reduction in affinity for Ca2+ and Sr2+). At this stage, it is nevertheless probably fair to leave both
hypotheses open.
As regards the effect of the mutation on other steps in the cycle, we found that the ADA mutation leaves the affinity for phosphorylation from Pi almost unaltered (see Figure 6), but increases the dephosphorylation rate after phosphorylation from ATP (presumably by accelerating
the Ca2E1P to E2P transition) (Figure 8B). In addition, the mutation causes a reduction in the
affinity with which MgATP is bound to the ATPase in the absence of Ca2+ (Figure 10) -the reduced
affinity for ATP binding of the ADA mutant of course contributing to the reduction in the phosphorylation level and the ATPase activity observed, at low ATP (Figure 8)-. These facts illustrate that the L6-7 loop controls other steps in the ATPase cycle, beyond the E2 to Ca2E1
transition.
In their initial report of the 3D structure of the Ca2+-ATPase, Toyoshima and co-workers
emphasized the central position in the structure of the L6-7 loop, located halfway between the membrane domain and the P domain. They also noticed that residues of this loop were engaged in an extended network of hydrogen bonds, suggesting that the L6-7 loop might play an important role during the Ca2+-dependent phosphorylation from ATP, by transmitting to the P domain the
movements of M6 or M5 induced by calcium binding (14). Zhang and colleagues subsequently reported that this hydrogen bond network was indeed critical to stabilize the phosphorylation and calcium binding domains (23).
A well documented example of a functional interplay between the nucleotide binding and Ca2+ binding domains is the acceleration by bound nucleotide of the rate of the E2→E1Ca
2
conversion (65,67,68,70,80,81). Nucleotide binding to the cytosolic portion of Ca2+-ATPase in the
absence of Ca2+ apparently permits faster reorganization of the transmembrane domain, leading to
faster binding of calcium and/or release of previously occluded protons. The fact, shown here, that the D813A-D818A mutation appreciably reduces the affinity of the ATPase for binding of ATP as well as Ca2+, and simultaneously slows down the E2→E1Ca
2 transition step (a slowing down which
is reversed at high ATP concentration), could therefore be an indication that the mutation prevents movements of the TM segments with consequences in the distant nucleotide binding domain. As the L6-7 loop seems to essentially follow the P-domain reorientation during the E2→E1Ca2
transition, it is indeed quite conceivable that alterations in this loop, e.g. those induced by the ADA mutation, have consequences on that reorientation, although transmission of information between the nucleotide binding site and the TM domain remains possible with the mutated loop (as shown by the fact that the E2→E1Ca2 transition is accelerated in the presence of high ATP for the mutant,
too). The L6-7 loop may thus have a direct contribution in relaying distant conformational changes from one site to the other. This, of course, does not exclude the participation of neighbouring elements, such as the upper part of the M5 transmembrane span, as major conformational changes of the ATPase obviously require concerted changes of the various domains of the protein. Further progress remains to be done to get a better understanding of such a mechanism at the atomic level.
Abbreviations
SR, sarcoplasmic reticulum; SERCA1a, 1a isoform of the SR Ca2+-ATPase; WT, wild type
SERCA1a Ca2+-ATPase; ADA, Asp813Ala-Asp818Ala double mutant of SERCA1a; NTA, Ni2+
-nitrilotriacetic acid; DDM, b-D-dodecyl maltoside; EYPC, egg yolk L-a-phosphatidylcholine; EYPA, egg yolk phosphatidic acid; EDTA, ethylenediamine tetraacetic acid; EGTA, ethylene glycol-bis(2-aminoethyl)-N,N,N’,N’-tetraacetic acid; FITC, fluorescein isothiocyanate; TCA, trichloracetic acid; PAGE, polyacrylamide gel electrophoresis; TEMED,
N,N,N’,N’-Tetramethylethylenediamine; RPM, revolutions per minute; SDS, sodium dodecyl sulphate; TM, transmembrane; C12E8, octaethylene glycol monododecyl ether; Tes, 2-
{[2-hydroxy-1,1-bis(hydroxymethyl)ethyl]amino}ethanesulfonic acid; Hepes, 4-(2-Hydroxyethyl)piperazine-1-ethanesulfonic acid; Mops, 4-Morpholinepropanesulfonic acid; Tg, thapsigargin; cmc, critical micellar concentration; TCA, trichloracetic acid.
Acknowledgements
We would like to thank Cedric Montigny for technical help, Dr. Jean-Marc Verbavatz (LTMD, CEA Saclay, France) for the freeze fracture electron microscopy, Dr. M. Garrigos
(LTMD, CEA Saclay, France) for introducing us to the Pi colorimetric measurements in multi-well microtiter plates, Pr. J. P. Andersen (Aarhus University, Denmark) for the gift of SimZyme
software, Dr. J-M Neumann (LBPM, CEA Saclay, France) for comments about the structure of the L6-7 region, and Dr. B de Foresta (LTMD, CEA Saclay, France) and Dr. J-J Lacapère (Inserm U410 Unit) for critical discussions and reading of the manuscript. This work was supported by the Commissariat à l’Energie Atomique (CEA), by the “Centre National de la Recherche Scientifique”, by Human Frontier Science Program Organization funds (to M. P.) and by a fellowship of the “Ministère de la Recherche et de la Technologie” and from the “Fondation pour la Recherche
References
R
1. Hasselbach, W., and Makinose, M. (1961) Biochemische
Zeitschrift 333, 518-528
2. Ebashi, S., and Lipman, F. (1962) The Journal of Cell Biology
14, 389-400
3. MacLennan, D. H. (1970) J. Biol. Chem. 245, 4508-4518
4. Mintz, E., and Guillain, F. (1997) Biochim. Biophys. Acta
1318, 52-70
5. MacLennan, D. H., Rice, W. J., and Green, N. M. (1997) J.
Biol. Chem. 272, 28815-28818
6. Møller, J. V., Juul, B., and le Maire, M. (1996) Biochim.
Biophys. Acta 1286, 1-51
7. Makinose, M. (1973) FEBS Lett. 37, 140-143
8. de Meis, L., and Vianna, A. L. (1979) Annu. Rev. Biochem. 48,
275-292
9. Champeil, P. (1996) in Biomembranes, ATPases (Lee, A. G., ed)
Vol. 5, pp. 43-76, JAI Press, London
10. Scarborough, G. A. (2002) J. Bioenerg. Biomembr. 34, 235-250 11. MacLennan, D. H., Brandl, C. J., Korczak, B., and Green, N.
M. (1985) Nature 316, 696-700
12. Zhang, P., Toyoshima, C., Yonekura, K., Green, N. M., and Stokes, D. L. (1998) Nature 392, 835-839
13. Dux, L., Pikula, S., Mullner, N., and Martonosi, A. (1987) J.
Biol. Chem. 262, 6439-6442
14. Toyoshima, C., Nakasako, M., Nomura, H., and Ogawa, H. (2000)
Nature 405, 647-655
15. Toyoshima, C., and Nomura, H. (2002) Nature 418, 605-611 16. Martonosi, A. N., and Pikula, S. (2003) Acta Biochim. Pol.
50, 337-365
17. Clarke, D. M., Loo, T. W., Inesi, G., and MacLennan, D. H. (1989) Nature 339, 476-478
18. Andersen, J. P. (1995) Biosci. Rep. 15, 243-261
19. Falson, P., Menguy, T., Corre, F., Bouneau, L., de Gracia, A.
G., Soulié, S., Centeno, F., Møller, J. V., Champeil, P., and
le Maire, M. (1997) J. Biol. Chem. 272, 17258-17262
20. Menguy, T., Corre, F., Bouneau, L., Deschamps, S., Møller, J. V., Champeil, P., le Maire, M., and Falson, P. (1998) J.
Biol. Chem. 273, 20134-20143
21. Menguy, T., Corre, F., Juul, B., Bouneau, L., Lafitte, D., Derrick, P. J., Sharma, P. S., Falson, P., Levine, B. A., Møller, J. V., and le Maire, M. (2002) J. Biol. Chem. 277, 13016-13028
22. Zhang, Z., Lewis, D., Strock, C., Inesi, G., Nakasako, M., Nomura, H., and Toyoshima, C. (2000) Biochemistry 39, 8758-8767
23. Zhang, Z., Lewis, D., Sumbilla, C., Inesi, G., and Toyoshima, C. (2001) J. Biol. Chem. 276, 15232-15239
24. Xu, G., Farley, R. A., Kane, D. J., and Faller, L. D. (2003)
Ann. N. Y. Acad. Sci. 986, 96-100
25. Costa, V., and Carloni, P. (2003) Proteins 50, 104-113
26. Andersen, J. P., Clausen, J. D., Einholm, A. P., and Vilsen, B. (2003) Ann. N. Y. Acad. Sci. 986, 72-81
27. Falson, P., Lenoir, G., Menguy, T., Corre, F., Montigny, C., Pedersen, P. A., Thinès, D., and Le Maire, M. (2003) Ann. N.
Y. Acad. Sci. 986, 312-314
28. Lenoir, G., Menguy, T., Corre, F., Montigny, C., Pedersen, P. A., Thinès, D., le Maire, M., and Falson, P. (2002) Biochim.
Biophys. Acta 1560, 67-83
29. Lenoir, G., Montigny, C., Le Maire, M., and Falson, P. (2003)
Ann. N. Y. Acad. Sci. 986, 333-334
30. de Meis, L., and Hasselbach, W. (1971) J. Biol. Chem. 246, 4759-4763
31. Champeil, P., Guillain, F., Venien, C., and Gingold, M. P. (1985) Biochemistry 24, 69-81
32. Cuenda, A., Henao, F., Nogues, M., and Gutierrez-Merino, C. (1994) Biochim. Biophys. Acta 1194, 35-43
33. MacDonald, R. C., MacDonald, R. I., Menco, B. P., Takeshita, K., Subbarao, N. K., and Hu, L. R. (1991) Biochim. Biophys.
Acta 1061, 297-303
34. Pullman, M. E., Penefsky, H. S., Datta, A., and Racker, E. (1960) J.Biol. Chem. 235, 3322-3329
35. Møller, J. V., Lind, K. E., and Andersen, J. P. (1980) J.
Biol. Chem. 255, 1912-1920
36. Lund, S., Orlowski, S., de Foresta, B., Champeil, P., le Maire, M., and Moller, J. V. (1989) J. Biol. Chem. 264, 4907-4915
37. Tsien, R., and Pozzan, T. (1989) Methods Enzymol. 172, 230-262
38. Drueckes, P., Schinzel, R., and Palm, D. (1995) Anal.
Biochem. 230, 173-177
39. Saheki, S., Takeda, A., and Shimazu, T. (1985) Anal. Biochem. 148, 277-281
40. Vyskocil, F., Teisinger, J., and Dlouha, H. (1980) Nature 286, 516-517
41. Vijaya, S., and Ramasarma, T. (1985) J. Inorganic
Biochemistry 20, 247-254
42. Molnar, E., Kiss, Z., Dux, L., and Guba, F. (1988) Acta
Biochim. Biophys. Hung. 23, 63-74
43. Guillain, F., Gingold, M. P., and Champeil, P. (1982) J.
Biol. Chem. 257, 7366-7371
44. Sarkadi, B., Enyedi, A., Foldes-Papp, Z., and Gardos, G. (1986) J. Biol. Chem. 261, 9552-9557
45. Weber, K., and Osborn, M. (1969) J. Biol. Chem. 244, 4406-4412
46. Laemmli, U. K. (1970) Nature 227, 680-685
47. Menguy, T., Chenevois, S., Guillain, F., le Maire, M.,
Falson, P., and Champeil, P. (1998) Anal. Biochem. 264, 141-148
![Fig D. Vanadate-dependent oxidation of NADH in the presence or absence of membranes. time, min010 20Absorbance at 340 nm1.01.5ADPSRA23187303301030[VO4], µM303301030[VO4], µM](https://thumb-eu.123doks.com/thumbv2/123doknet/13595599.423372/42.892.227.605.215.526/vanadate-dependent-oxidation-presence-absence-membranes-absorbance-adpsra.webp)
![[PDF] Apprendre le référencement web support de formation | Cours webmaster](data:image/gif;base64,R0lGODlhAQABAIAAAP///wAAACH5BAEAAAAALAAAAAABAAEAAAICRAEAOw==)