HAL Id: insu-03090207
https://hal-insu.archives-ouvertes.fr/insu-03090207
Submitted on 29 Dec 2020
HAL is a multi-disciplinary open access
archive for the deposit and dissemination of
sci-entific research documents, whether they are
pub-lished or not. The documents may come from
teaching and research institutions in France or
abroad, or from public or private research centers.
L’archive ouverte pluridisciplinaire HAL, est
destinée au dépôt et à la diffusion de documents
scientifiques de niveau recherche, publiés ou non,
émanant des établissements d’enseignement et de
recherche français ou étrangers, des laboratoires
publics ou privés.
Polar stratospheric clouds climatology over Dumont
d’Urville between 1989 and 1993 and the influence of
volcanic aerosols on their formation
Christine David, Slimane Bekki, Sophie Godin, Gérard Mégie, M. P.
Chipperfield
To cite this version:
Christine David, Slimane Bekki, Sophie Godin, Gérard Mégie, M. P. Chipperfield. Polar stratospheric
clouds climatology over Dumont d’Urville between 1989 and 1993 and the influence of volcanic aerosols
on their formation. Journal of Geophysical Research: Atmospheres, American Geophysical Union,
1998, 103 (D17), pp.22163-22180. �10.1029/98JD01692�. �insu-03090207�
JOURNAL OF GEOPHYSICAL RESEARCH, VOL. 103, NO. D17, PAGES 22,163-22,180, SEPTEMBER 20, 1998
Polar stratospheric clouds climatology over Dumont
dUrville
between
1989 and 1993 and the influence
of volcanic
aerosols
on their
formation
C. David, S. Bekki, S. Godin, and G. M•gie
Service d'A•ronomie du CNRS, Institut Pierre-Simon Laplace, Universit• Paris VI, Paris, France
M.P. Chipperfield
Department of Chemistry, University of Cambridge, Cambridge, England
Abstract. The first polar stratospheric
clouds (PSCs) climatology
ever established
from lidar data and relative to a specific site is presented here. It is based on lidar
backscatter and depolarization measurements of PSCs carried out between 1989 and
1993 at Dumont d'Urville (66øS, 140øE), which is a primary station of the Network
for Detection of Stratospheric
Changes
(NDSC). The climatology
was subdivided
based on the stratospheric
sulphuric acid aerosol content (background
aerosols
in 1989-1991 and volcanic aerosols in 1992-1993 following the Mount Pinatubo
eruption). PSCs were mainly observed
in July and August. Very few water ice
clouds
(type II) were detected. Most of the PSCs tended to form around the peak
in sulphuric acid aerosol, between 17 and 23 krn in 1989-1991 and between 11
and 20 krn in 1992-1993. This tendency suggests that sulphuric acid aerosols are
very likely to act as condensation nuclei for PSCs. As shown by previous lidar
studies [Browell et al., 1990], two type I subclasses
were identified: alepolarizing
(nonspherical)
particles
(type Ia) and nondepolarizing
(spherical)
particles
(type Ib).
No type Ia PSCs were detected above the nitric acid trihydrate (NAT) saturation
temperature, TN^T, lending support to the theory that NAT is the main component of type Ia PSCs. There was also no evidence of the existence of sulphuric acid
tetrahydrate
(SAT) in the data. Some
type Ib PSCs were observed
close
to the frost
point, showing that supersaturation with respect to NAT is a necessary, but not
sufficient, condition for the existence of solid PSCs. No type Ib PSCs were clearly detected above TN^T in 1989-1991 whereas 18% of the PSCs seem to be found at
temperatures above TN^T in 1992-1993. This difference might be linked to the HNO3
uptake by volcanic sulphuric acid particles starting at higher temperatures. The
fraction of type Ia out of the total PSCs observations was lower in 1992-1993 than
in 1989-1991. This difference
was not found to be highly statistically significant.
1. Introduction
Polar stratospheric clouds (PSCs) condition the po-
lar stratosphere for subsequent ozone loss over Antarc-
tica by providing sites for heterogeneous reactions which
convert chlorine reservoir species (C1ONO2, HC1) into
active forms (C1, C10) [World Meteorological Orga-
nization, 1995]. Furthermore, they remove nitrogen compounds from the lower stratosphere via nitric acid (HNOa) uptake followed by gravitational sedimenta- tionø
After being first observed from the ground [Stanford,
1973], large-scale PSCs were detected in both polar re-
Copyright 1998 by the American Geophysical Union. Paper number 98JD01692.
0148-0227/98/98JD-01692509.00
gions in 1979 with the satellite instrument Stratospheric
Aerosol Measurements II (SAM II) [McCormick et al.,
1982]. The first data on PSC physical characteristics were obtained during the Airborne Antarctic Ozone Ex-
pedition (AAOE) (Journal of Geophysical Research, 9•,
(D9) and 9J (DiJ), 1989)in 1987. Balloon-borne
mea-
surements of PSCs have been conducted at from Mc-
Murdo Station (78øS, 167øE) since 1987 [Hofmann and
Deshler, 1991; Adriani et al., 1992], and several years
of observations are available from the Admunsen-Scott
South Pole Station (90øS) [Rosen
et al., 1991, 1993].
In addition, lidar measurements at Syowa (65øS, 40 øE)
since 1983 [Iwasaka et al., 1986], at Admunsen-Scott since 1987 [Fiocco et al., 1992] and at McMurdo since
1991 [Gobbi et al., 1991] have confirmed the intermit-
tent presence of PSCs over the whole continent during the winter.
22,164 DAVID ET AL.' PSC CLIMATOLOGY AND VOLCANIC INFLUENCE
These observations have shown that PSCs mainly form in the 12-25 km range and that their occur-
rence is tightly correlated to temperature minima [Mc-
Cormick et al., 1982]. The thermodynamically most
stable HNO3 hydrate, nitric acid trihydrate (NAT), was the first realistic suggestion as the most likely compo- nent of PSC particles [Crutzen and A rnold• 1986; Toon et al., 1986]. On the basis of their optical properties, PSCs were classified into two general types, I and II
[Hamill et al., 1988; Poole and McCormick, 1988]. Type
I clouds that are observed at 5 to 7 K above the ice frost point, are believed to be mainly composed of HNO3, and to have typical radii of about I/•m. Type II PSCs are thought to be water ice particles, with radii ) 2/•m, forming at the frost point temperature. Analyses of
Arctic lidar data revealed two subclasses of type IPSC,
Ia and Ib [Browell et al., 1990], both appearing at, or be-
low, the NAT equilibrium threshold temperature. Type Ia particles exhibit low backscatter ratios and high de- polarization ratios, and are consistent with nonspheri-
cal larger particles [Toon et al., 1990]. Type Ib particles
exhibit high backscatter ratios and low depolarization ratios, consistent either with numerous liquid particles or with nonspherical particles with sizes much smaller than the lidar wavelength.
The exact mechanisms for PSC formation are still
a topic of great debate. First, as the temperature de-
creases, stratospheric sulphuric acid aerosols absorb wa-
ter to maintain their composition in equilibrium with
the ambient water vapor pressure [Steele and Hamill,
1981]. Then, after further cooling, PSCs form. Sev- eral modes of formation have been proposed. Poole and
McCormick [1988] suggested that H2SO4/H20 aerosols
could freeze as sulphuric acid tetrahydrate (SAT) at sufficiently low temperatures and act as solid conden- sation nuclei for NAT particles at temperatures below the NAT saturation point (• 195 K at 20 km, for 5 ppmv of H20 and 10 ppbv of HNOa). In this view,
the different classes of type I PSCs form according to
the cooling rate experienced by the air masses (cooling
rate <_ 5 K/d for type Ia and > 5 K/d for type Ib)
[Toon
et al., 1990]. More recently,
Molina et al. [1993]
proposed that H2SO4/H20 aerosols might remain su-
percooled even below the NAT equilibrium tempera- ture. Type Ib could then be droplets of liquid ternary
H2SO4/HNO3/H20 solution which form through rapid
uptake of HNOa by sulphuric acid aerosols at temper-
atures below the NAT saturation temperature, as ob-
served
at low sulphuric
acid aerosols
content (nonvol-
canic situation) by Dye et al. [1992]. Temperatures
for type lb formation have never been observed for
high H2SO4 aerosol loadings. Observations of liquid
HNOa/H20 films prior to NAT formation have been
reported in the laboratory [Hanson, 1990]. Overall, the
formation mechanism of solid particles above the frost
point (type Ia PSCs) is still unclear, and several hy-
pothesis for the freezing process have been suggested,
including
NAT freezing
out of ternary solution
[Molina
et al., 1993; Tabazadeh et al., 1994], NAT freezing out of
binary HNOs/H20 solution during rapid temperature
fluctuations [Meilinger et al., 1995], and even hetero-
geneous nucleation of NAT on seed particles different
from H2SO4/H•O particles [Carslaw et al., 1994; Iraci
et al., 1995]. A metastable phase, nitric acid dihydrate
(NAD), might form first and then convert into NAT at
lower temperatures [Worsnop et al., 1993; Fox et al.,
1995]. Tabazadeh et al. [1995] suggested that amor-
phous solid solutions of HNO3 and H•O, so-called type Ic PSC, could form during the warming of stratospheric
aerosols which were in a glassy state. However, on the
basis of laboratory data, Koop et al. [1995] argue that
H•SO4 or HNO3 hydrates could only form from water ice below the frost point but would then continue to ex- ist up to their melting points. Whatever the formation
mechanism, once formed, the solid particles would grow
absorbing HNO• and H•O through condensational pro-
cesses.
In this paper, we present a five year PSC climatol- ogy over Dumont d'Urville (66øS, 140øE), Antarctica,
derived from lidar observations. The Mount Pinatubo
(15øN, 120øE) eruption in June 1991 provided the opportunity of investigating the influence of volcanic particles on PSCs. Two periods are thus compared: 1989-1991, before the eruption when only background aerosols were present, and 1992-1993 after the global
dispersion of Pinatubo aerosols was completed.
In section 2, the experimental setup is described to-
gether with the methodology used to retrieve the optical
properties of the different scattering layers. Section 3 displays the observations and the method used to iden- tify PSCs in the lidar signals is presented in section 4. Results and comparison of the two periods are shown
in section 5. Interpretations of the observations, using
a thermodynamic model, are discussed in section 6. Fi-
nally, the section 7 provides a summary of the results obtained.
2. Experimental Description and
Methodology
The Polar Ozone Lidar Experiment (POLE) is
a French Italian cooperation between the Service
d•A6ronomie du CNRS and the IROE-CNR. POLE is
a program of continuous monitoring of the stratosphere
in the Antarctic, located at the French station Dumont d'Urville, which is a primary station of the Network
for Detection
of Stratospheric
Changes
(NDSC). At the
present time, the lidar in Dumont d'Urville is the only one operating throughout the year on the Antarctic con- tinent.
The backscatter lidar for aerosols and PSC measure-
ments was set up in December 1988 and started oper-
ating in April 1989 [Sacco et al., 1989]. During this
first phase of the POLE experiment, the lidar included a frequency doubled Nd:YAG laser which emits 270 mJ
DAVID ET AL.' PSC CLIMATOLOGY AND VOLCANIC INFLUENCE 22,165
of 532 nm [Stefanutti
et al., 1991]. The backscatter
signal
was collected
on a 50-cm-diameter
Newtonian
telescope
and split into two components
polarized
re-
spectively
parallel
and perpendicular
to the laser emis-
sion. Both components were detected by photomulti-
plier tubes with 10.5% quantum efficiency at 532 nm.
The photomultipliers were gain switched to prevent sat-
uration by the stronger returns from the lower altitudes.
The signals
were
then time resolved
using
a 12-bit tran-
sient waveform recorder capable of storing 1024 samples
with a resolution of 75 m. These digital samples were
averaged on several shots before being recorded.
During the second phase of POLE, the first lidar
system was improved and a DIAL lidar was set up in
January 1991 to measure sequentially the vertical dis-
tributions of stratospheric ozone and of stratospheric
aerosols
and PSCs [Stefanutti
et al., 1992]. The 532 nm
wavelength
is still used for particle observations.
The
methodology for aerosols and PSC retrievals remained
unchanged. The output energy of the pulsed Nd:YAG
laser at 532 nm is now 450 mJ at 10-Hz repetition rate. The signal is received on a 80-cm-diameter Cassegrain telescope with aluminium coated optics. The two com- ponents polarized parallel and perpendicular to the
laser emission are still recorded. The different wave-
lengths are separated using a grating spectrometer and further detected by photomultiplier tubes. Then the li- dar signals are time resolved with a 30-m resolution and averaged before final data acquisition.
As the aerosols and PSC retrievals were essentially identical during the two phases, the data obtained be- fore and after 1991 are consistent. Figure I shows an example of digitized raw signal profiles recorded on the June 24, 1993. Figure 1, which only represents a sam- ple of the database profiles, illustrates well the good quality of the raw signal obtained by the instrument. The scale used here is meant to show the entire dy-
namic of the signal (note that the horizontal axis is
logarithmic).
The solid line gives
the received
signal
in
the polarization channel parallel to the laser emission,
while the dashed line corresponds to the received signal
in the perpendicular polarization. The receiver gain
switching occurs between 3 and 8 km for the parallel
channel and between I and 3 km for the perpendicular channel. On the parallel channel, the Mie scattering
signals are seen from about 10 to 15 km due to volcanic
aerosols and at about 23 km due to PSCs, superim-
posed to background aerosols. The Rayleigh scattering
from the molecular atmosphere further decays with at-
mospheric density between 28 and 35-40 km. Above
these altitudes, only a background signal is detected.
To reduce the statistical noise on an individual pro-
file, the signals are averaged over 1000 shots (5 min)
during polar night and 2000 shots (10 min) during day- time. A daily profile is defined as the average of all the individual profiles of that day. From the digitized
raw signals, background levels are estimated using a lin-
ear or parabolic fit at higher altitudes (typically above
40 km) where backscattering
by both molecules
and
particles is negligible. Then the range and background
corrected signal is inverted using an algorithm based on
the Klett [1981, 1985] method. The quantities
derived
from the combined Mie and Rayleigh components of the
lidar signal include backscatter ratio and depolarization
ratio, as defined in the next section.
2.1. Backscatter Ratio
The volume extinction coefficient a(z) and backscat-
ter coefficient, /•(z) represent the sum of the contribu-
tions of both the Mie scattering by particles, Up(Z) and
/•p
(z), and the Rayleigh
scattering
by molecules,
a,• (z)
and/•,• (z):=
=
+
PSCMolecular
scattering
6O 55 5O 45 •40 v55 •25 20 15 10 5 0 70 100 200 400 700 1000 2000 4000DIGITIZED RAW SIGNAL
Figure 1. Example of lidar raw signals in the channels
polarized
parallel (solid line) and perpendicular
(dot-
ted line) to the laser emission on June 24, 1993 (the
horizontal axis is logarithmic).
Scattering by particles is usually characterized by the
backscatter ratio R(z), defined as
R(z)
- i + tip(Z)
(3)
To calculate the Rayleigh molecular backscatter co- efficient, the absolute atmospheric density profiles are derived from local daily meteorological radiosondes. The extrapolation above the upper altitude of the ra-
diosonde (-•20 to 25 km in average) is made using a
monthly zonal atmospheric model Middle Atmosphere Program, 1985 (MAP) at 65øS. The resulting uncer- tainty will be detailed in section 3.
Meanwhile, the determination of •3(z) from the lidar
equation requires quantitative knowledge of a relation-
ship between c•(z) and/•(z) [Klett, 1981]. If the value of
the backscatter phase function is assumed to be known, these relationships are
22,166 DAVID ET AL.- PSC CLIMATOLOGY AND VOLCANIC INFLUENCE
ap(z)
(4)
= (5)
where T,• is the Rayleigh backscatter phase func-
tion normalised
for molecular
scattering
(T,• m s-•
m 0.12 sr
-•) and Tp(z) is the particles
phase
function.
The estimation
of Tp(z) without the knowledge
of the
size, shape and refractive index of the aerosols is very
difficult. In the classical Klett inversion procedure for
single
wavelength
lidar measurements,
Tp is considered
as constant with altitude and its value is then repre-
sentative
of the altitude where /3p(z) is maximal. In
our methodology, before retrieving the optical proper-
ties of scattering layers, we first retrieve their geometri-
cal characteristics, using a threshold method based on
the variance
of the range
and background
corrected
sig-
nal [Chazette
et al., 1995]. Using this procedure,
the
bottom and top altitudes
of a given scattering
layer,
distinct from molecular atmosphere, are determined. Particle phase function values were estimated for each
layer from previous measurements or from Mie scatter-
ing models, according to the type of aerosols. Back-
ground stratospheric aerosols phase function is chosen
at 0.018 sr
-1 from an optical
model [Rosen
and Hof-
mann• 1986]o Volcanic aerosols phase function is esti-
mated to be 0.025 sr- • from lidar measurements at the
Observatoire
de Haute-Provence
(44 oN, 50
E) [Chazette
et al., 1995]o As type II PSC scattering properties are
close to those of cirrus clouds, their phase function is
taken from the cirrus phase
function,
e.g., 0.055 sr -•.
This value is also considered as an approximation for
type IPSC phase function. This phase function profile
provides the basic hypothesis for the Klett inversion method.
The determination of the total backscattering coeffi-
cient through the Klett procedure also requires a bound-
ary condition'
the knowledge
of/3p
(z) at a reference
al-
titude'zr. To ensure the stability of the solution, this al-
titude is chosen above the aerosol layers, where the par-
ticle content is negligible and where scattering is only
due to the molecular atmosphere, typically between 28
and 32 km, assuming therefore that the backscatter ra-
tio R(z) is equal to unity at and above this reference altitude.
Calculated this way, 5(z) includes depolarization from
the molecular atmosphere, which is estimated to be about 1.5% [McNeil and Carswell, 1975; Kent et al.,
1990]. When the optical depth is sufficiently
low (less
than -•10 -• for most PSCs) contamination
of the lidar
return by multiple scattering is negligible [Platt, 1981].
The aerosol depolarization ratio (ratio of the inten-
sity backscattered only by particles in the perpendicular
channel to that backscattered only by particles in the
parallel channel) is not used here because we found that
it induces large mathematical instabilities in the alti- tude regions of low particle content. This parameter is only relevant for PSCs or for volcanic aerosols.
2.3. Uncertainties
Uncertainties in the determination of the total
backscatter coefficient /3(z) and therefore in the
backscatter ratio R(z) were derived from the statisical
analysis based on several years of data. They can be
related
to three main causes
[Chazette
et al., 1995]:
1. The statistical fluctuations of the measured lidar
signal associated with random detection processes; this
uncertainty contributes to statistical errors of less than
2% to the backscatter
ratio values
on the parallel
chan-
nel (parallel
polarization
to the laser
emission)
and be-
tween
5 to 10% on the perpendicular
channel
(perpen-
dicular polarization
to the laser emission),
depending
on the scattering matter (the uncertainty is lower for
depolarizing matter, as the backscattered signal level is
higher),
2. The presence of particles at and above the chosen
reference altitude zr and the subsequent uncertainty on
the value of R(•); it is estimated to be less than 5%
on the parallel channel and less than about 8 to 10% on
the perpendicular channel,
3. The value
of the particle
phase
function
Tp(z) and
its altitude dependence; this uncertainty is estimated to
be • 20%.
The total uncertainty which results from these three causes on the parallel channel is less than 7% with the
signal being significant
up to 40 km [Chazette
et al.,
1995]. On the perpendicular
channel,
the signal
be-
comes very noisy above 25-30 km, resulting in a large
uncertainty on the a priori knowledge of the backscat-
tering coefficient
at the reference
altitude /3(z•). Ac-
2.2. Depolarization Ratio
Detection of the signal on the polarization perpen-
dicular to the laser emission allows the measurement of
the depolarization ratio defined as
Table 1. Uncertainty on 5(z) for Various
Uncertainties on the Backscatter Ratio on the
Perpendicular Channel, for a Fixed Uncer- tainty on the Backscatter Ratio of m 7% on
the Parallel Channel
5(z)
= (z)
/311
(z)
(6)
where fix(z) and fill(Z) are respectively
the total
backscatter coefficients in the parallel and perpendic-
ular planes
relative to the emitted polarization
plane.
Uncertainty on nñ(z) Uncertainty on 5(z)
10% 15 to 20%
15% 20 to 25%
20% 25 to 30%
DAVID ET AL.' PSC CLIMATOLOGY AND VOLCANIC INFLUENCE 22,167 24 ø1• •10 1989 •8
Jan. March May July Sept. Nov.
Feb. April June August Oct. Dec.
MONTH 24_ 22- 20- ß 18 œ _ 16-: _ 14-' _ 12-' 10-' 8 6 4 2 0
Jan. March May July Sept. Nov.
Feb. April June August Oct. Dec.
MONTH 1990 Jan. March Feb. April Jan. March •1,. ^ .-..,:1 F•U. /'%[k,I i ii
May July Sept.
June August MONTH
Oct.
Nov.
May July Sept.
June r-•u ,, ,,g, ,..+ r,..+ uoL •./,,.,, ,...
MONTH
Dec.
Nov.
1993
Jan. March May July Sept. Nov.
Feb. April June August Oct.
MONTH
Dec.
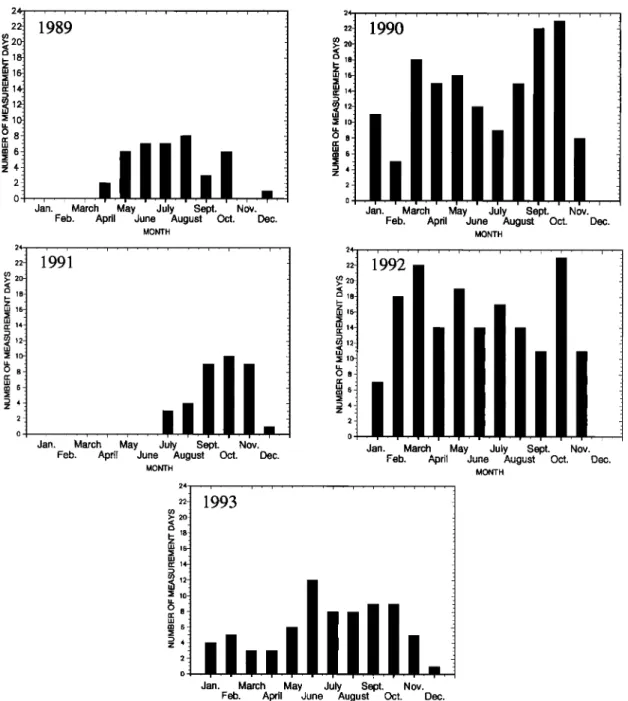
Figure 2. Number of days of valid lidar measurements per month at Dumont d'Urville between
1989 and 1993.
cordingly, the total uncertainty on the perpendicular
backscatter ratio (10 to 25%) is higher than on the par-
allel channel. The uncertainty on the depolarization ra-
tio 5(z) is primarily controlled by the uncertainty on the
backscattering coefficient on the perpendicular channel.
Table 1 gives the uncertainty on 5(z) for various uncer-
tainties on the backscatter ratio on the perpendicular
channel, assuming a maximum uncertainty of 7% on the
backscatter ratio on the parallel channel.
The contribution of each of the three errors men-
tioned above has an altitude dependance (according to
the propagation of the errors at each step of the in-
version [Chazette et al., 1995]). Thus, to account on
this uncertainty on the backscatter ratio and depolar-
ization ratio, only measurements with uncertainty on
/•11(z)
lower than 10% and/or uncertainty
on /•ñ(z)
lower than 25% are taken into account and validated.The data set is thus reliable and consistent in terms of
signal-to-noise ratio.
3. Observations
The lidar data presented in this paper were obtained between April 1989 and December 1993. Figure 2 presents the number of days of validated measurements
per month. The low number of measurements in 1989
and 1991 originates from the difficulties encountered in
22,168 DAVID ET AL.' PSC CLIMATOLOGY AND VOLCANIC INFLUENCE of the Antarctic. Two measurements per week were
planned outside the period of PSC formation. This fre- quency had to be increased during winter and spring to produce a suitable dataset on PSCs. From June
to September, when meteorological conditions are good
(i.e., tropospheric cloud free atmosphere), observations
are performed daily.
Three types of additional information are necessary to interpret the lidar data: the position of Dumont d'Urville with respect to the polar vortex, the tem- perature profile at the altitude range of the observed
PSCs and the reference NAT and ice threshold tem-
peratures. The position of Dumont d'Urville with re- spect to the polar vortex is evaluated on the 475K
isentropic level (•-, 50 hPa or 18 km). During winter-
time, the polar vortex structure is such that if Dumont d'Urville is inside the vortex at 475K, it is very likely to be also inside the vortex at any levels of interest for
PSC observations (i.e., between _• 15 km and _• 28 km)
[Schoeberl et al., 1992; Tuck et al., 1989, 1992]. Er-
tel's potential vorticity maps at 475K are provided by the European Centre for Medium range Weather Fore-
casts (ECMWF). We consider here that values of po-
tential vorticity
greater
than-35x10 -s km2kg-•s
-• are
outside the vortex, whereas values between -35 and-
55x10 -e km2kg-•s
-• characterize
the edge
region,
and
values
less than-55x10 -• km2kg-•s
-t are inside the
vortex [Schoeberl et al., 1992; Tuck et al., 1989, 1992].
Daily meteorological radiosondes provide tempera-
ture profiles. The mean altitude reached by the ra-
diosondes is about 20-25 km. Some of them reach
30 km, while others do not exceed the tropopause height
by more than a few kilometers. In this case, they are ex- trapolated using the monthly Middle Atmosphere Pro-
gram, 1985 (MAP) climatology
for 65øS
in order to cal-
culate molecular optical properties. As the MAP data are only mean zonal temperatures that tend to smooth out very low temperatures observed at the edge of the vortex, only radiosonde data are used in the interpreta-
tion of the PSC data. Consequently, _• 30% of the de-
tected PSC (from 1989 to 1993) cannot
be analysed
in
terms of temperature. Allowing for the uncertainty on radiosonde data, about 1 K for temperatures between 190 and 200 K [Parsons et al., 1984], and the daily temperature variability between 1989 and 1993, the av- erage uncertainty on the temperature is estimated to be 1-1.5 K between 16 and 20 km.
PSC formation is strongly controlled by saturation threshold temperatures which, in turn, depend on the cloud composition. As the two types of PSCs were
first believed to be composed of NAT and ice, the ra-
diosonde temperatures are compared to NAT and ice
saturation
temperatures
(TNAT
and T•ce).
They are cal-
culated
using the Goff-Gratch
formula [Murray, 1967]
for the saturation water vapor pressure over ice and the
Hanson and Mauersberger [1988] expression for HNO3
saturation vapor pressure over NAT. The mean HNOs
and H20 profiles for this calculation are taken from
25 3 4 H20 mixing ratio (ppmv) 5 6 7 8 1 2 3 4 5 6 7 8 9 10 11 12 HN03 mixing ratio (ppbv)
Figure 3. HNOa (solid line) and H20 (dotted line) mixing ratio profiles from LIMS data in average for April, at 66ø32'S [Gille et al., 1984].
the Limb Infrared Monitor of the Stratosphere (LIMS)
data (Figure 3) [Gille et al., 1984]; they correspond to
66ø32'S averaged for April, just before the formation of the southern polar vortex. The HNO3 mixing ratio reaches 10 ppbv at 19 km, whereas the H20 mixing ra- tio lies between 4 and 5.2 ppmv in the 10-30 km altitude range. These profiles are consistent with the more re- cent data from Upper Atmospheric Research Satellite
(UARS) [Roche
et al., 1994]. It is worth pointing
out
that the profiles are not supposed to reproduce accu- rately the actual HNO3 levels during a particular win- ter, but rather to be representative of the average condi- tions prevailing over Dumont d'Urville. The calculation of TN^T is only weakly sensitive to the uncertainty on the HNOs mixing ratio. Indeed, at 50 hPa, for typical
conditions, the HNOs mixing ratio has to be multiplied
by a factor 2 to increase TNA? by about 1 K.
4. Identification of PSCs on Lidar
Signals
POLE data provide stratospheric vertical profiles of backscatter ratio and depolarization ratio. A backscat- ter ratio greater than unity is the signature of a scatter- ing layer distinct from the molecular atmosphere. The depolarization ratio is an indicator of the nonsphericity of the particles and hence of their physical state. Com-
bining these two parameters allows us to distinguish be-
tween stratospheric aerosols and PSCs and between the
different types of PSCs. On the basis of previous lidar
measurements [Kent et al., 1986; Iwasaka et al., 1986;
Poole and McCormick, 1988; Toon et al., 1989], the expected range of values of backscatter ratio and depo- larization ratio at 532 nm for different types of aerosols
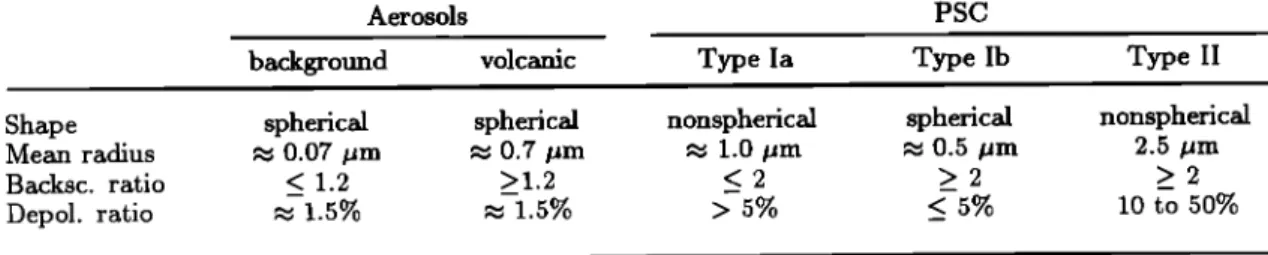
and PSCs are summarized in Table 2. It should be no-
DAVID ET AL' PSC CLIMATOLOGY AND VOLCANIC INFLUENCE 22,169
Table 2. Stratospheric
Aerosols
and PSC Physical
Characteristics
and Lidar Optical Properties
Converted at 532 nm From Previous Measurements.
Data are from Kent et al. [1986],
Iwasaka
et al. [1986],
Poole
and McCormick
[1988],
and
Toon et al. [1989].Aerosols PSC
background volcanic Type Ia Type lb Type II
Shape
spherical
spherical nonspherical spherical nonspherical
Mean radius • 0.07 •m • 0.7 •m • 1.0 •m • 0.5 •m 2.5 •m
Backsc. ratio <_ 1.2 >1.2 <_ 2 > 2 > 2
Depol.
ratio
• 1.5%
,,• 1.5%
> 5%
_<
5%
10 to 50%
which depolarize too weakly (depolarization_< 5%) to be
considered unequivocally as fully formed NAT particles,
are included into the type lb subclass.
We chose to characterize PSC by their optical prop-
erties at the maximum of backscatter ratio. The main
reason is that the best signal-to-noise ratio is obtained
at the peak, minimizing the uncertainties on the data set. Also, the signature of a PSC layer is thus deter- mined at a single altitude point. Some PSCs extended through a relatively wide altitude range exhibiting dis- tinct layers. In that case, each layer was treated as a distinct cloud which was characterized at its peak. Con-
sequently, several PSCs might be observed on the same
profile at different altitude levels.
According to the aerosol loading, two periods were analysed separately and then compared: before the eruption of Mount Pinatubo, 1989-1991, when only background aerosols are present; and after the erup- tion, 1992-1993, when a significant amount of volcanic aerosols was present.
4.1. First Period: 1989-1991
During
this period (April 1989
to August
1991), three
different types of scattering layers were detected on the
lidar signals between 8 and 25 kin: background aerosols,
cirrus, and PSCs [Stefanutti et al., 1991].
Lidar measurements at 532 nm are sensitive to par-
ticles with radii greater than 0.1-0.15 pm. Back-
ground aerosols were regularly observed between the tropopause and about 25 km. The altitude of maxi- mum scattering varied between 15 and 21 km, depend- ing on the tropopause height, with an average altitude at 19.0:k0.5 km, which is in agreement with balloon-
borne observations [Rosen et al., 1975]. Backscatter ra-
tios for background aerosols were first calculated from
profiles obtained out of the PSC period (July and Au-
gust). It showed little seasonal variations with a mean
maximum backscatter ratio of 1.11 and a standard de-
viation a of 0.08. The inclusion of July and August profiles, which did not exhibit PSC layers, in the calcu-
lation of the background aerosol average backscatter ra-
tio profile does not change these values significantly. As expected, no depolarization was associated with back- ground particulate matter.
Cirrus clouds are the second type of particles encoun-
tered in the altitude range of interest. From our lidar measurements, the properties of these clouds are close to those of type II PSC with backscatter ratios greater or equal to 2 and depolarization ratios ranging from 10 to 40%. However, cirrus clouds are expected to be
found below or around the tropopause region (and they
were). These cirrus observations are not discussed here.
During the period 1989-1991, we considered that PSCs were identified when the lidar signal indicated
a depolarization ratio greater than 2.5% (1.5% q- 1.0%
originating from the maximum relative uncertainty at 2•r) and/or a backscatter ratio greater than the av- erage backscatter ratio of background aerosols 1.27
(1.11 + 0.16 at 2•r). The choice of the threshold values
within their possible ranges should have little impact on the results, because most of the PSC identifications
correspond to signals out of the 2•r envelope. Individual
PSC backscatter ratios are defined as the total backscat-
ter minus the aerosol contribution. The aerosol contri-
bution is estimated from the background aerosol mean
profile.
4.2. Second Period: 1992-1993
After a period of inactivity of 635 years, Mount
Pinatubo (15.14øN, 120.35øE), in the Philippines,
erupted in June 1991 in series of minor explosions lead-
ing to a cataclysmic eruption on June 14 and 15. Large
quantities of gaseous sulphur dioxide (SO2) were in-
jected into the stratosphere between 20 and 30 kin. The total mass of SO2 injected was estimated to be between 12,000 and 20,000 kT [Bluth et al., 1992; McPeters et al., 1993; Read et al., 1993]. The SOa cloud, as ob-
served by Total Ozone Mapping Spectrometer (TOMS),
encircled the Earth around the tropics in 22 days [Bluth
et al., 1992]. The conversion of gaseous SOa into liq-
uid sulphuric acid (HaSO4) was completed within a
few months. The meridional dispersion was driven by
two transport regimes in the stratosphere [Trepte et al.,
1993]. A lower-altitude transport regime was induced
by the Asian Monsoon anticyclonic circulation. At up- per altitudes, poleward transport was associated with transient planetary wave activity interacting with the Quasi Biennal Oscillation (QBO) easterlies. Accord-
22,170 DAVID ET AL.: PSC CLIMATOLOGY AND VOLCANIC INFLUENCE
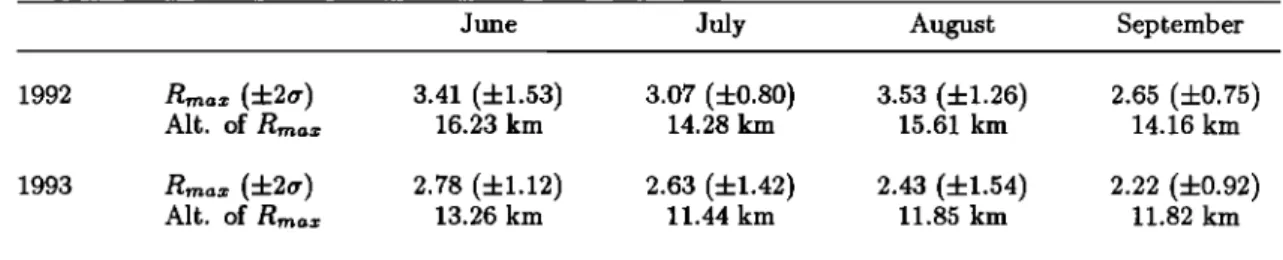
Table 3. Volcanic Cloud Maximum Backscatter ratio (Rma•) with 2 Standard Deviation and
Altitude of This Maximum as Measured Inside Vortex by the POLE Lidar in Dumont d'Urville Between June and September in 1992 and 1993
June July August September
1992 Rmax (-4-2er) 3.41 (-4-1.53) 3.07 (-4-0.80) 3.53 (-4-1.26) 2.65 (-4-0.75)
Alt. of R,,ax 16.23 km 14.28 km 15.61 km 14.16 km
1993 Rm• (4-2er) 2.78 (4-1.12) 2.63 (4-1.42) 2.43 (4-1.54) 2.22 (4-0.92)
Air. of Rmax 13.26 km 11.44 km 11.85 km 11.82 km
ing to POLE data, the volcanic cloud reached Dumont d'Urville in September 1991 outside of the vortex. After October 1991, the polar vortex was rarely located over
the station. Then the aerosol loading increased contin-
uously until December 1991. Dispersion and vertical mixing of the volcanic particles appeared to be com- pleted by the end of February 1992 [David, 1995; Godin et al., 1996].
Volcanic aerosols from the Cerro Hudson (49.9øS,
73.0øW) eruption (August 14 and 15, 1991) in Chile
were first observed over Dumont d'Urville on September
6, 1991, below 15 km. They were totally removed from
the Antarctic stratosphere at the beginning of 1992.
These particles thus do not interfere with the present analyses.
In 1992-1993, the presence of dense volcanic particle layers in the lower stratosphere, made the distinction
between type Ib PSCs and volcanic aerosols more diffi-
cult. The previous methodology for type Ib PSC identi-
fication had thus to be revised. Since volcanic particles have a composition and physical state similar to that of background aerosols, they were not expected to de- polarize the lidar signal. Their only signature was an
enhancement of backscatter ratio with respect to back-
ground aerosols values• The temporal evolution of the altitude and amplitude of the volcanic cloud maximum
backscatter ratio inside the polar vortex is given in Ta-
ble 3.
To reliably identify the type Ib cloud signatures su-
perimposed on the volcanic aerosols backscatter signal,
a two-step threshold type algorithm based on the ob- served variance of the volcanic cloud was developed. As dynamical transport through the polar vortex edge
is small during the winter [Schoeberl et al., 1992], with
air inside the vortex experiencing subsidence, measure-
ments located outside and inside vortex were treated independently. As the volcanic cloud underwent spatial and temporal fluctuations, daily backscatter ratio pro- files were monthly averaged between June and Septem-
ber 1992 and 1993. First, all the profiles (with and with-
out PSCs) were taken into account in the calculation of
monthly mean profiles. Then, if a daily profile exhibited in certain regions deviations from the monthly mean larger than 2er, we considered that PSC layers were de-
tected on that profile. As a test, a new monthly mean profile was calculated without including the profiles on which PSCs were identified. Then the procedure was repeated. The resulting few additional PSC detections were found to be very close to the 2er envelope and thus
doubtful. We decided to discard them from the PSC
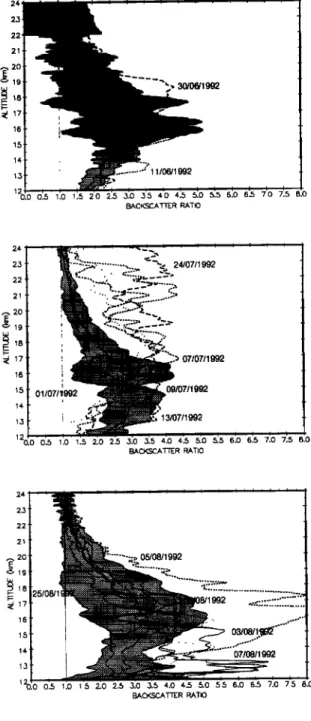
analysis. Therefore this method may underestimate the number of type lb PSCs. Figure 4 shows some type Ib PSC profiles extracted by this procedure compared to the monthly mean profiles. As for the 1989-1991 pe- riod, the aerosol contribution is estimated from the new monthly mean profiles and individual PSC backscatter ratios correspond to the total backscatter from which
the aerosol contribution was removed. Note that no
PSCs were detected outside the vortex.
5. Results
Data collected during the pre-Pinatubo (1989-1991)
and post-Pinatubo (1992-1993) periods were analyzed
separately. The two data sets are compared and com- mon features as well as differences are discussed. Sixty
PSCs (any type) were detected in 1989-1991, whereas
61 PSCs (any type) were observed in 1992-1993, all lo-
cated inside or at the edge of the polar vortex. Only five
type II PSCs (one in 1989-1991 and four in 1992-1993)
were detected, for temperatures below T•½e. Indeed, the
evolution of the temperature profiles from radiosondes showed that temperatures very rarely dropped below
T•½e over Dumont d'Urville. A climatological study can-
not be completed and no clear definite conclusions on
the effect of H2SO4 aerosols loading on type II clouds
formation could be directly inferred from the very few
number of type II observations. Therefore they were ex-
cluded from further analysis. Measurements statistics on type I PSCs are given in Table 4.
Compared to higher-latitude stations [Collins et al.,
1993; Rosen et al., 1993], PSCs were present over Du-
mont d'Urville relatively late in the season, mainly in
July and August, reflecting the fact that the station was
mostly inside the vortex during this time period. Some
clouds were also detected in June and September, espe-
cially in 1992 and 1993. They were associated with the
vortex moving over the station, providing suitable tem- peratures for PSC formation in June and September.
DAVID ET AL.' PSC CLIMATOLOGY AND VOLCANIC INFLUENCE 22,171
.24
[ • ' t•_•
I , I , I , I [ I , I ] I • : • '.
• '.
• ',
,2'1 ß 14- != .... 1,5 0.0 0.5 1.0 1.5 2.0 2.5 ,5.0 ,5.5 4.0 4.5 5.0 5.5 6.0 6.5 7.0 7.5 8.0 BACKSCATTER RATIO 24. ! 23' ' ... 22' 21 2o "'"' 19 : ,. : ,, .. ,, , t , • , I , I , 120.0:0:.5:1:.0' 1.5 2:0 2:5 ,5:0',5:5'4;0 4.5 5.0 5.5 6.0 6.5 7.0 7.5 BACKSCATTER RATIO 24 2,5 22 21 ,• 20 _ • 17 16 15 14 1,5 12 0.0'0'.5 1.0 1.5 2.0 2.5 ,5.0 ,5.5 4.0 4.5 5.0 5.5 6.0 6.5 7.0 7.5 8.0 BACKSCATTER RATIO 24 22 2120
18 16 15 14- 1,5 ß t , i , i -'•=':':':'•'-':':':':':'%•' • i i , I t t : : : : .. •20.0 0'.• •.0 •.•'2'.0' 2'.• ,5'.0 ,5'.• ,.0 ,..• •'.0 •'.• •:.0 •:.• ½.0 ½.• •'.0 BAC•CATT• •O 24 ' • ,• 2,5 • 22 21 2O •'•' 19• 18
25/08/1
.•.17 16 15 14 ' 1,5' 1 i , i , 20.0 0.5 25. 22- 21' 2_0'17'
"•"'
16'
• !!•..
,....,
..•..:...•½!,
"7•-'•
06/08/1995
14- 1,5 1 O: 0:5"•;0 '•:5'2:0 2:5 •:0 ' '50 BACKSCATTER RATIO 24 ; I , , I , I , I , I , I , I , I , I , I , I , I , I , I , 2,5 22 21 20•E
19
,
18 { • ii
17"•• 25/09/1992
141 0.5
1.0
1.5
2.0
2.5
,5.0
,5.5
4.0
4.5
5.0
5.5
6.0
6.5
7.0
7.5
8.0
BACKScATTER RATIO 24 2,5 22 21 20 •'•' 19 17 16 15 14 1,5 120. 0 2•09/1993 16/09/1993 15/09/1993 0.5 1.0 1.5 2.0 2.5 ,5.0 ,5.5 4.0 4.5 5.0 5.5 6.0 6.5 7.0 7.5 BACKScATTER RATIOFigure 4. Type
Ib PSC
profiles
extracted
by the method
using
a threshold
type
algorithm
based
on the observed variance of the volcanic cloud compared to the monthly averaged profiles, for
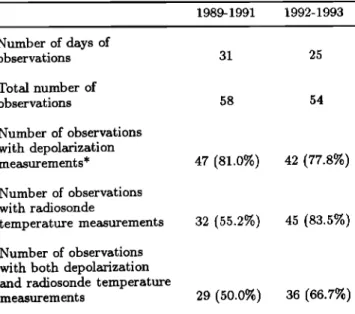
22,172 DAVID ET AL.' PSC CLIMATOLOGY AND VOLCANIC INFLUENCE Table 4. Statistic of Type IPSC Observations
1989-1991 1992-1993 Number of days of observations 31 25 Total number of observations 58 54 Number of observations with depolarization measurements* 47' (81.0%) 42 (7'7.8%) Number of observations with racliosonde temperature measurements 32 (55.2%) 45 (83.5%) Number of observations
with both depolarization and radiosonde temperature
measurements 29 (50.0%) 36 (66.7'ø-/0)
* Parentheses indicate percentage of the total
number of PSC observations.
used here interchangeablyø The percentage of PSCs de-
tected per 1 K class of ATNA T is shown on Figure 7. In 1989-1991, when PSCs were detected, ATNA T ranged
from-2 to 6 K with a maximum occurrence between 1
and 4 K (• 73% of the observations). Some clouds were
observed at temperatures 2 K above the NAT point. However, this 2 K difference is not significant as it lies within the error of analysis resulting from the uncer- tainties in the radiosonde temperature and in the HNO3
mixing ratio (see section 3). Consequently, in view of
this uncertainty, we do not claim to have detected PSCs above the reference NAT saturation temperature for
background aerosols conditions. In 1992-1993, ATNA T
ranged from-4 to 8 K. Despite two very cold cases dur-
ing this period, more PSCs were observed at low tem- perature in 1989-1991 than in 1992-1993. This may only reflect interannual temperature variability. In contrast, PSC formation at higher temperatures is an interest-
ing feature. Even allowing for a 2 K uncertainty, 18%
of the PSC events for which radiosondes temperature
measurements are available (see Figure 7), were found
at temperatures above TNAT.
5.1. PSC Altitudes
Figure 5 shows the evolution of the altitude of the peak PSC scattering along with the tropopause height between June and September for both periods. PSCs were found between about 11 and 25 km. They were
observed at higher altitudes at the beginning of the win-
ter compared to the end, which is consistent with the
stratospheric warming occurring first at higher altitudes
[Iwasaka et al., 1986]. Some clouds were detected at
lower altitudes earlier in the winter in 1992-1993 than
in 1989-1991. This appears more clearly on Figure 6, which displays the percentage of detected PSCs per 3- km-thick layers between 11 and 26 km. In 1989-1991,
almost 70% of the PSCs were found between 17 and
23 km, around the peak in background sulphuric acid aerosols. In 1992-1993, the peak in PSC occurrence
(• 73% of the observations) was shifted toward lower
altitudes, between 11 and 20 km, where most volcanic sulphuric acid aerosols were located. This tendency was
also noticed over McMurdo station in 1992 [Deshler et
al. , 1994].
5.2. PSC Temperatures
In order to account for the altitude dependency of the
NAT point, TNAT, the difference ATNAT (---- TNAT- T,
where T is the radiosonde temperature) is used as an
indicator of the potential for the formation of NAT PSCs. SNAT, the saturation ratio of HNO3 with respect to NAT, is also a good indicator (SNAT = PHNO3/
P•NO3 where
PHNOs
is the nitric acid partial pressure
and P•tNO•
the HNO3 equilibrium
vapor
pressure
over
NAT, for a given temperature and water vapor partial pressure). Both indicators, ATNAT or $NAT, will be
50 28 26 24 22 20 18 16 14 Background ß eo e ß ß
ß • e eo
270 26O 25O 230 • 0 220 7O 8O 6ODAY (from June to September)
50 28 26 24 22 •'•o •16 '< 14 12 10 6 Volcanic e• ß ß ß ß ß ß ß % eee X ß
)• •X X•
X X•
X
x
150 160 170 180 190 200 210 220 230 240 250 260 270 280DAY (from June to September)
Figure 5. Evolution of the altitude of the peak
PSC scattering (dots) along with the tropopause height
(crosses)
between
June and September,
(top) for back-
ground conditions 1989-1991 and (bottom) for volcanic
DAVID ET AL.' PSC CLIMATOLOGY AND VOLCANIC INFLUENCE 22,175 45 • Background 40 F-'-] Volcanic •, 55 v o 50 o 25 o 20 "' 15 10 5 0 11-14 km 14-17 km 17-20 km 20-23 km 23-26 km
Figure 6. Percentage of PSCs detected per 3 km thich
layer between 11 and 26 km, (top) for background con-
ditions 1989-1991 and (bottom) for volcanic conditions
1992-1993.
In 1989-1991, the altitude of peak PSC scattering did not appear to be correlated with ATNAT (Figure 8). However, in 1992-1993, the PSCs observed at temper- atures above TNAT were all located below 17 km (i.e.,
18% of the observed PSCs), around the center of the
volcanic cloud.
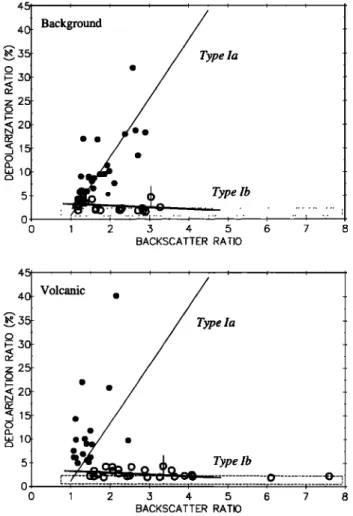
5.3. PSC Types
As the different types of PSC were characterized through their backscatter ratio and depolarization ratio,
the data should appear (for type I) as two distinct sub-
classes on a depolarization versus backscatter diagram.
These diagrams are displayed in Figure 9; the solid lines
are linear fits to the two subclasses, type Ia and lb, for
the pre-Pinatubo period. As explained in subsection 4.2, type Ia clouds are defined as clouds with a depo- larization ratio greater than 5%. As expected, for both
30
t ' I , I , i , I
• Background 25 I--I Volcanic • 15 ,17; 4o o -5 -4 -5 -2 -1 o 1 2 5 4 5 6 7 8 TN,,,T- T (K)Figure 7. Percentage of PSCs detected per 1 K classes
of ATNAT (= TNAT--T, where T is the radiosonde tem-
perature), (top) for background conditions 1989-1991
and (bottom) for volcanic conditions 1992-1993.
50 28 26 24- 16 14 12 10 Background ß ß ß -5 -4 -3 -2 -1 0 1 2 3 4 5 6 7 8 T•-- T (K) 50 28 26 24 • 2o •- 18 J Volcanic ß ß ß ß ß TN,T- T (K)
Figure 8. Altitude of peak PSC scattering as a func-
tion of ATNAT, (top) for background conditions 1989-
1991 and (bottom) for volcanic conditions 1992-1993.
periods, type lb data lay around a straight line cor- responding to a constant low depolarization ratio and varying backscatter ratio. On the other hand, type Ia class exhibits high depolarization ratio and relatively
low backscatter ratio (slope 0.16). The strong disper-
sion around the linear fit for type Ia may be due to the sampling of clouds at different stages of their formation and growth (that is, any stage: forming PSCs, mature
clouds, or evaporating clouds).
Some differences are apparent between the two peri- ods. Backscatter ratio of type Ia clouds ranges from 1 to 3 during the pre-Pinatubo period (1989-1991) whereas they essentially did not exceed • 2 in post-
Pinatubo conditions (1992-1993). In contrast, the range
of backscatter ratio values covered by type lb clouds was just slightly smaller during the pre-Pinatubo pe-
riod (1 to 3.3) compared to the post-Pinatubo period
(1 to 4.2, with two outliers at 6.1 and 7.6). As explained
in subsection 4, PSC backscatter ratios were calculated as the difference between daily measured backscatter ratios and the aerosol contribution from monthly mean backscatter ratios. As expected, daily fluctuations were not significant for background conditions. On the other
22,174 DAVID ET AL' PSC CLIMATOLOGY AND VOLCANIC INFLUENCE 45 4O o • 30 z 25 o • 2o o "'10 Background Type la ß ß Type lb 0 1 2 .3 4 5 6 7 8 BACKSCATTER RATIO 45 , i , i , i , i , i , i , i ,
•,
40
Volcanic
ß /
• 35 e la oa<
2•
< 2(2 o L•10 ß ß5
--/ •. •__ -
? 0_ O.-- Type
_• Q _-lb
_ F--Z"--t•.,-•-' •-,•'-,,J-•o ,.., ;...'• ... 0 ... -•--• 0 , '--I ... • ... r .... • ... T ... r .... • ... r .... '1 ... * ... r .... • ... r ... ,- .... 0 1 2 3 4 5 6 7 8 BACKSCATTER RATIOFigure 9. Depolarization ratio versus backscatter ra-
tio diagram, where the two distinct subclasses of type I
PSCs appear, (top) for background conditions 1989-
1991 and (bottom) for volcanic conditions 1992-1993;
linear fits to the two subclasses (solid lines), type Ia and
lb, for the 1989-1991 are reproduced on the 1992-1993 diagram; the rectangle indicates the range of alepolar-
ization uncertainty for type lb (1.5% + 0.5% originating
from the maximum relative uncertainty); an example of
error bar is given for type lb in each panel.
of both depolarization and temperature are reported in figure 11. Only PSCs with non or low depolarization ratios were found at temperatures above TNAT. In ad-
dition, it appears that as suggested by Figure 10, the
fraction of type Ia out of the total PSCs observations was lower in 1992-1993 than in 1989-1991 although, on average, the levels of saturation with respect to NAT
in both periods were comparable (see Figure 11). It is
still possible that there were significant differences in temperatures and ,-•NAT between the two periods out- side the Dumont D'Urville area, leading to changes in
the distribution of PSCs over Dumont D'Urville.
6. interpretation
6.1. Common Features
There are many common features in the pre-Pinatubo and post-Pinatubo climatologies. PSCs mainly occur when temperatures are low within or at the edge of the polar vortex. They tend to form around the altitude of the peak in sulphuric acid aerosol mixing ratio. This observed correlation implies that stratospheric aerosols may play a key role in PSC formation, probably act-
ing as formation sites (condensation nuclei). Therefore,
by changing the altitude of PSC formation, volcanic
aerosols may have also influenced the altitude range of
ozone destruction due to PSC heteregeneous chemistry.
It is very likely that the non depolarizing (type lb)
clouds are liquid, supporting strongly the existence of
PSCs composed of liquid ternary H2SO4/HNOa/H20
solution [Molina et al., 1993; Tabazadeh et al., 1994].
Backscatter ratios can rapidly reach high values
(R _> 2) as the entire population of small liquid parti-
cles grow by absorbing HNOa available in the gas phase
[Tabazadeh et al., 1994]. This leads to high particles
concentrations. The two outliers in backscatter ratio
(6.1 and 7.6) for type Ib PSCs in 1992-1993 may re-
flect a higher number of particles (due to the enhanced
hand,
they
were
very
substantial
for
volcanic
conditons. 50
Thus
the precision
(sum
of the daily
signal
standard
de-
45
viation and the monthly mean standard deviation) on 40
PSCs backscatter
ratio values,
for 1992-1993,
was not •35
sufficient
for
fully
quantitative
study
of the
effect
of • 30
an enhanced aerosol loading on PSCs. For this reason,
c• 25
only the depolarization ratio is considered in the follow- ,,,
o 20
ing analysis. ,,,
The percentage of PSCs detected per alepolarization • 15
class is plotted in Figure 10. The frequency of alepolar- l0
izing
clouds
(that is, depolarization
ratio
_• 5%) repre-
5
sented 38% of the observations in post-Pinatubo condi-
tions,
which
is 11%
lower
than
during
the
pre-Pinatubo 0
period. However, this difference is not statistically sig-
nificant at the 95% confidence interval. Figure 11 shows
the depolarization ratio as a function of ATNAT. No-
tice that only the PSC observations with measurements
Type lb
, I ,
Background Volcanic Type la < 2.2% 2.2-5% 5-8% 8-12% 12-18% 18-25% > 25% DEPOLARIZATION CLASSESFigure 10. Percentage of PSCs detected per depolar-
ization classes, (top) for background conditions 1989-


![Figure 3. HNOa (solid line) and H20 (dotted line) mixing ratio profiles from LIMS data in average for April, at 66ø32'S [Gille et al., 1984]](https://thumb-eu.123doks.com/thumbv2/123doknet/14801011.606257/7.925.470.826.89.372/figure-hnoa-dotted-mixing-profiles-average-april-gille.webp)