République Algérienne Démocratique et Populaire
Ministère de l’Enseignement Supérieur et de la Recherche Scientifique
U
U
N
N
I
I
V
V
E
E
R
R
S
S
I
I
T
T
E
E
D
D
E
E
B
B
A
A
T
T
N
N
A
A
Faculté des Sciences de l’Ingénieur
Département d’Electrotechnique
M
M
é
é
m
m
o
o
i
i
r
r
e
e
d
d
e
e
M
M
a
a
g
g
i
i
s
s
t
t
e
e
r
r
e
e
n
n
E
E
l
l
e
e
c
c
t
t
r
r
o
o
t
t
e
e
c
c
h
h
n
n
i
i
q
q
u
u
e
e
O
O
p
p
t
t
i
i
o
o
n
n
:
:
M
M
a
a
c
c
h
h
i
i
n
n
e
e
s
s
E
E
l
l
e
e
c
c
t
t
r
r
i
i
q
q
u
u
e
e
s
s
Présenté par Monsieur
Bouna Ould Zeidane
Ingénieur d’état en Electrotechnique de l’Université Eldjabel Gharby, Libye Pour obtenir le diplôme de Magister de l’Université de Batna
C
C
o
o
n
n
t
t
r
r
i
i
b
b
u
u
t
t
i
i
o
o
n
n
t
t
o
o
t
t
h
h
e
e
S
S
t
t
u
u
d
d
y
y
o
o
f
f
t
t
h
h
e
e
G
G
r
r
i
i
d
d
C
C
o
o
n
n
n
n
e
e
c
c
t
t
e
e
d
d
P
P
h
h
o
o
t
t
o
o
v
v
o
o
l
l
t
t
a
a
i
i
c
c
S
S
y
y
s
s
t
t
e
e
m
m
Case of the Domestic Load Mémoire soutenu le / /2006
Devant le jury composé de :
Jury Grade Affiliation QUALITE
BELKACEMI Mohamed Prof. Université de Batna Président AZOUI Boubaker M.C. Université de Batna Rapporteur DJARALLAH Mohamed C.C. Université de Batna Co-Encadreur MOUSSI Ammar Prof. Université de Biskra Examinateur BENOUDJIT Azeddine M.C. Université de Batna Examinateur DIB Abderrahmane Dr.CC. C. U. O.El-Bouaghi Examinateur
Promotion 2003
T
To all my family members, Especially my father and mother To all my friends…
Contents
Knowledge………... I Dedication………...II Contents……… III List of symbols………VGeneral introduction
………..………. 2Chapter 1
Overall background required to design a photovoltaic system
1.1 Introduction………...51.2 Solar radiation……… 5
1.2.1 Solar radiation source………. 5
1.2.2 Solar radiation outside the earth’s atmosphere………. 5
1.2.3 Solar radiation on the earth’s surface……… 6
1.2.4 Algerian insolation map……… .…... 8
1.2.5 Solar radiation measurements……… 9
1.3 Photovoltaic generator………. 10
1.3.1 Solar cells………. 10
1.3.1.1 Concept of PV cells……… 11
1.3.1.2 Solar cell characteristics………. 12
1.3.2 Photovoltaic module……… 14
1.3.3 Module characteristics………. 15
1.3.4 Photovoltaic array……… 15
1.4 Power conditioning elements……… 16
1.4.1 DC-DC maximum power point tracking………. 16
1.4.2 Inverter……… 17
1.5 Conclusion……… 18
Chapter 2
Grid-connected PV system conceptions
2.1 Introduction………... 202.2 Conception of grid-connected PV system……… 20
2.3 Types of grid-connected PV systems………... 21
2.4 Problems and risks involving grid-connected PV systems……….. 22
2.5 Technical interconnection requirements……….. 24
2.6 Benefits of grid connected PV system………. 26
2.7 Some developed programs around the world………... 27
2.8 Examples of grid-connected PV system……….. 28
2.8.1 Power flow control of a single distributed generation unit with nonlinear local load……….. 28
2.8.1.1 System description……… 28
2.8.1.2 Control scheme……….. 29
2.8.2 Optimization of photovoltaic system connected to electric power grid………. 29
2.8.2.1 Operation principles……….. 29
2.8.3 Utility-connected power converter for maximizing power transfer from a PV
source while drawing ripple-free current………... 31
2.8.3.1 Operation principles………. 31
2.8.3.2 Filter requirements………... 31
2.8.3.3 Control section………. 31
2.8.4 Novel maximum-power-point-tracking controller for PV energy conversion system………. 32
2.8.4.1 Proposed MPPT algorithm……….. 32
2.8.4.2 System configuration and control scheme……….. 32
2.9 Conclusion……… 34
Chapter 3
Modeling and analysis of the controlled grid-connected PV system
3.1 Introduction……… 363.2 Global Configurations……….. 36
3.3 System modeling……….. 37
3.3.1 PV array model………... 37
3.3.2 Maximum power point tracker (MPPT) model……….. 39
3.3.3 Inverter controllers………. 41
3.3.3.1 Inverter topology………... 41
3.3.3.2 Controlled grid connected PV system: an overview………. 42
3.3.3.2.1 Power-current controller……… 42
3.3.3.2.2 Power controller………. 43
3.3.3.2.3 Current controllers………. 45
3.3.4 Output filter model………. 48
3.4 Daily load profile model………. 49
3.5 Conclusion……… 51
Chapter 4
Matlab/Simulink model Implementation and simulation results
4.1 Introduction………... 534.2 Photovoltaic array simulation………... 53
4.3 PVG-MPPT simulation………. 56
4.4 Simulation of the inverter and its control system………. 44
4.5 Simulation of daily operation modes……… 61
4.6 Conclusion……… 65
General conclusion
………. 67References
……… 69Appendices
………74
List of symbols
Symbol Definition
G Irradiation intensity σ Stafan-Boltzmann constant Τ Absolute temperature ex G Extraterrestrial irradiance ) n (Gon Eccentricity correction factor
o
r Annual average sun earth distance
) n (
r Current sun earth distance
z
θ Solar zenith angle
Ph E Photovoltaic energy g E Energy gap h Planck constant c Light speed λ Wavelength of light Iph Photocurrent source s R Series resistance sh R Shunt resistance
Isc Short circuit current
Voc Open circuit voltage
max
P Maximum power
Vmax Maximum voltage
Imax Maximum current
FF Fill factor Vt Thermal voltage a G Ambient irradiation m Ideality factor P Active power Q Reactive power
LDC Inductor filter at the DC side
Symbol
Definition
Clink Linked capacitor at the inverter input
Vlink DC linked voltage
inv
I Inverter output current
inv
V Inverter output voltage
PV
V PV generator output voltage
PV
I PV generator output current
c
v Output filter capacitor voltage
c
i Output filter capacitor current
u v Utility voltage u
i
Utility current L i Load current E Irradiation energy maxE Maximum irradiation energy
st t Sunrise time sat I Saturation current q Electronic charge mp V Module voltage mp I Module current ref V Reference voltage ref I Reference current T ∆ Variation of temperature ref T Reference temperature
α current temperature coefficient
β voltage temperature coefficient
Ns Series solar cells in module
Np Parallel branches in module
Nsm Series modules
Acknoledgment
I would like to use this opportunity to honestly thank Professors **************and
*****for their assistance in guiding me throughout this research and for providing me with the
facilities that made this work possible.
I also want to express gratitude Professor Abd ssamed *** the president of the searching
group in ******laboratory, for his helpful agreement that allowed me a member in this
laboratory think which allowed me finish my work in this laboratory under suitable environment.
Finally, I would like to extent gratitude and thank to all my friends for their continuous
helps.
General introduction
The world energy consumption has still increased due to expected rapid increase of world population, especially in the third world and in new industrialized countries because ever more humans also need ever more energy. At present, the world consumes over 8477.4 million tones oil equivalent (toe) of primary energy each year. This is roughly equivalent to 3.6x10 20J. The vast majority of this energy is obtained by combustion of fossil fuels, nuclear and hydroelectricity generate approximately 7.4% and 2.7% respectively. There are problems with this present situation as the reserves of fossil fuels are limited and there is potential for global warming, [1].
Continually rapid growth is foreseen in the near future, with the world population rising from the present 6 billion to about 8 billion over the next 25 years, and is expected to grow perhaps to 10 billion people by the middle of 21st century. Such a population increase
will have a dramatic impact on energy demand, at least doubling it by 2050, even if the developed countries adopt more effective energy conservation policies so that their energy consumption does not increase at all over that period, [2].
Sometime in the mid-21st century the world will need a new, safe, clean and
economical source of energy to satisfy the needs of both developing and developed nations. The World Energy Council wrote in a published report 2000, [2]:
Renewable energies are nearly unlimited energy sources, if one compares the energy, which we receive from the Sun, with the energy demand of humankind. Moreover they are available prevailing inland or local and therefore secure. The problem is that without financial support renewable energies cannot normally compete with fossil energies. However this does not mean that it is not important to promote renewable energies according to market economic criterions in order to get even more profit from reduction in costs with mass production and from experiences with their increasing application, [3].
To cover the energy requirement, the researches are being made for conventional or renewable energy. One of the renewable energy is solar energy, which can be the main source or alternative energy source in the power generator. Excellence of using the renewable energy is clean energy and friendly to the environment. Beneficially solar radiation is equally distributed in the any place on the earth, its density isn’t large, irradiation fluctuate sharply with the fickle weather, and the solar energy cannot be stored, which cause no conflict on the earth and on each one in peace. In fine details, the irradiance intensity is influenced by the
factors: geographic (longitude, latitude) of the location. The location around the equator has good irradiation throughout the year, but the location around the pole particularly in winter season has little irradiation. Based on these reason, the equipment of solar energy in the tropic area is more effective than other places (subtropics and pole). The survey, the observation and measurement must be made to sure the irradiance intensity of a location. Although in the tropic area, the topography of the location and the weather also affect the irradiation. For example, the location at the mountain is often rain or cloudy. As a result, the total irradiation in one day is low, [3, 4].
Photovoltaic (PV) generation provides a good solution for distributed energy generation (DEG). PV systems provide the highest power level in the middle of the day, which coincides with the peak power requirements on the utility grid, especially during the summer. Even though PV systems are intermittent resources due to their reliance on the sun shining, the times when the energy available from the sun is at its highest corresponds to the highest demands on the utility grid. This correlation makes PV generation highly suitable as a peaking source, [4, 5].
The major problem that must be overcome when connecting PV arrays to the utility grid is to extract and export the maximum power available with a high factor quality/price. Concerning the quality of energy, the power conditioning system (PCS) that is required to convert the DC output voltage to 50 or 60Hz AC voltage at the proper level to interface to the utility at the specified distribution level, should be selected with its control system adequately. For achieving that, the work is divided into four sections.
In the first chapter, Overall background required to design a photovoltaic system is presented. This study includes solar radiation, photovoltaic generator, and power conditioning elements.
In the second chapter a general study about grid-connected photovoltaic system is given. The study concerns the system conception, types, problems encountered, technical interconnection standards requirements, etc.
The third chapter is focused on the development of different models for each components of the system followed by an analysis of some types of the controlled grid-connected PV system.
Finally, in the last chapter, the overall system is implemented in Matlab/simulink
environment and the dynamic behavior of the system is analyzed; followed by a detailed interpretation.
1.1 Introduction
The photovoltaic generation is the direct conversion of solar radiation into electricity, by means of solar cells. The solar cell is a p-n junction semiconductor under illumination; it produces a direct current depended on the weather conditions.
Therefore, in this section, the study will focus on these overall backgrounds required to design a photovoltaic system, namely, solar radiation, photovoltaic generator, and power conditioning elements.
1.2 Solar radiation
In this subsection we will give an outlook study about solar radiation as the source of the photovoltaic energy.
1.2.1 Solar radiation source
The sun is a large sphere of intensely hot gases consisting, by mass, about 75% of hydrogen, 23% of helium and others (2%). Its mass and radius are respectively, 1.99 1030 kg
and 696000 km, [6]. Hydrogen atoms fuse there to form helium and this energy is then delivered as radiation (light and heat) into space. The sun’s outer surface, namely photosphere, has an effective blackbody temperature of approximately 6000 k, [2]. This mean, as view from the earth, the radiation emitted from the sun appears to be essentially equivalent to that emitted from a blackbody at 6000 k. To understand the behavior of the radiation from the sun the characteristics of the blackbody should be discussed.
The “blackbody” is an absorber and emitter of electromagnetic radiation with 100% efficiency at all wavelengths, [7]. When the temperature is known, the radiation intensity of a blackbody can be calculated using the Stafan-Boltzmann’s law, [2, 6, 7]:
G=σ.Τ4 (1.1)
where: G : Irradiation intensity [W/m2]
σ : Stafan-Boltzmann constant [5.67 10-8W/m2/k4] Τ: Absolute temperature of the body [k]
The solar irradiation intensity is measured in watts or kilowatts per square meter [W/m2, kW/m2]. But the radiation energy, i.e., the power integrated over a certain period of time, is given in watt-hours (also kilowatt-hours, Joules) per square meter.
1.2.2 Solar radiation outside the earth’s atmosphere
Nuclear fusion reactions in the active core of the sun produce inner temperature of
radiation is absorbed in the outer passive layers which are heated to about 6000 k and so become a source of radiation with a relatively continuous form of spectral distribution. Measurements indicate that the radiation flux, received from the sun outside the earth’s
atmosphere is remarkably constant. The so-called solar constant, 1367 W/m2, defines the
average amount of energy received in a unit of time on a unit of area perpendicular to the path of radiation outside the earth’s atmosphere at the average distance of the earth orbit around the sun. This value fluctuates with a few percent resulted especially from the change of sun-earth distance in the orbit during a year, [2, 9].
Due to the elliptic orbit of the earth, the extraterrestrial irradiance G onex a surface normal to the sun beam on day nof the year is, [9]:
Gexn =Gon(n)Go (1.2) with: Gon(n) is the eccentricity correction factor. It is given by:
365 n 2 cos 033 . 0 1 ) ) n ( r r ( ) n ( G o 2 on π + = = (1.3)
The radii r and o r(n) respectively are the annual average and the current sun earth distance at
dayn. The number n ranges from 1 on January 1 to 365 on December 31. The extraterrestrial
spectrum is important for satellite applications of solar cells.
1.2.3 Solar radiation on the earth’s surface
While passing the earth’s atmosphere, the sunlight is attenuated. Some of the sunlight is absorbed by air molecules, water vapor and dust. Some is scattered, either back into space or forward to the earth surface, by ozone, water and carbon dioxide, [2, 10].
The radiation that is not reflected or scattered and reaches the surface directly in line from the solar disc is called direct or beam radiation. The scattered radiation which reaches the ground is called diffuse radiation. Some of the radiation may reach a receiver after reflection from the ground, and is called the albedo. The total consisting of these three components is called global radiation, [9, 10]. Fig. 1.1 illustrates the solar components on a tilted plane on the earth surface.
After scattering and absorption followed by partial re-radiation into space,
approximately 1000 w/m2 reaches the ground under clear weather condition. However, this
amount varies greatly from one point in time to another due to atmospheric conditions and the movement of the earth with respect to the sun, [7].
The term air mass (AM), which is often used in the field of solar energy, is defined as the ratio of the path length of the radiation through the atmosphere at a given solar zenith angle, θ , to the path length when the sun is directly overhead . The solar zenith angle is the z angle between the ground normal and the solar position vector. Fig. 1.2 shows the definition of the solar zenith angle and the air mass number.
Fig. 1.2: Definitions of the zenith angle and the air mass, [7] Earth Z θ L LX Atmospher Fig. 1.1: Fractions of global radiation on the ground as
received by a tilted plane, [9] β
Direct
Diffuse Albedo
AM1 is defined as the air mass at the path length L1 through the atmosphere. The air mass
number for the path length Lx is z
cos 1
θ where θ the solar zenith angle. In general the air z
mass number is given by, [7]: z cos 1 M θ = (1.4) When the sun is situated in the zenith above the observer, the air mass is one. Outside the atmosphere it is zero. In moderate latitudes, often Μ =1.5 is assumed as a characteristic value, [9].
1.2.4 Algerian insolation map
Algeria is a large area country (2382000 km2) with variety in sites leading to diversity
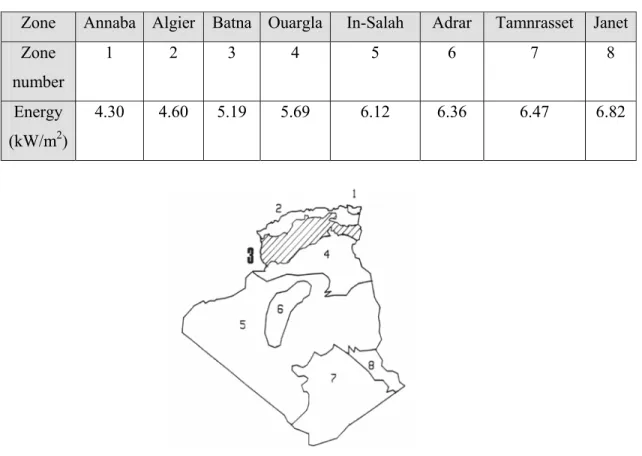
in climate, [11]. The country receives more than 3000 hours of sunshine per year with a high level of radiation. Fig. 1.3 shows the Algeria insolation zones which can be divided into eight climate zones have approximately a homogenous insolation, [12, 13, 14]. Table 1.1 gives the received average global horizontal insolation energy.
Table 1.1: Algeria average global horizontal insolation energy
Zone Annaba Algier Batna Ouargla In-Salah Adrar Tamnrasset Janet
Zone number 1 2 3 4 5 6 7 8 Energy (kW/m2) 4.30 4.60 5.19 5.69 6.12 6.36 6.47 6.82
1.2.5 Solar radiation measurements
In order to determine how a photovoltaic system will operate at a given geographic location, the solar radiation at the location must be measured and characterized. The solar radiation is usually measured with the help of a pyranometer or pyrhelometer.
Pyranometer as shown in Fig. 1.4, for example, is a basic instrument for measuring the global radiation. The measuring principle has based on the temperature difference between white and black painted sectors.
A precisely cut glass dome shields the sensing elements from environmental factors. By that means the measuring results is not effected by ambient temperature. When the instrument is exposed to solar radiation, temperature difference is created between the black and white sectors. This temperature difference is detected by a thermopile (a set of thermocouples) within the instrument, which then reacts by generating a small electrical signals. Finally a calibration factor converts the millivolt signal to an equivalent radiant energy flux in watts per square meter, [2].
Direct radiation can be measured by pyrheliometer. In contrast to a pyranometer, the black sensor disc is located at the base of a tube whose axis is aligned with the direction of the sunbeam. Thus, diffuse radiation is essentially blocked from the sensor surface. Furthermore, pyrheliometer, as shown in Fig. 1.5, is normally mounted on a solar tracker so that it is continually pointed directly at the sun throughout the day. However, this makes the measurements complicate and expensive.
In case of the diffuse radiation, it can be determined by subtracting the measured
direct radiation from the global radiation mathematically.However, it can also be measured
by applying a shadow band to the pyranometer as presented in Fig. 1.6. By this means, the sunbeam is blocked and whereby a value measured refers only to the diffuse component. By the way, the albedo radiation can be measured as well.
As shown in Fig. 1.7, for instance, the instrument consists of two identical pyradiometers. The upper measures the global radiation whereas the inner dome protects the detector from infrared radiation from the outer dome, which may change rapidly with meteorological conditions and the lower measures the reflected radiation of the ground.
1.3 Photovoltaic generator
A photovoltaic generator (PVG) is the whole assembly of solar cells, connections, protective parts, supports, etc., [15]. In this section, the focus is only on cells, modules and arrays.
1.3.1 Solar cells
The direct transformation from the solar radiation energy into electrical energy is possible with the photovoltaic effect by using solar cells. And because solar cells are made of semiconductor materials (usually silicon), it is useful to give a short brief about such materials together with concentrating on solar cells it selves: its operation, structures and characteristics.
Fig. 1.4: Star pyranometer, [7]. Fig. 1.5: Pyrheliometer and solar tracker, [2]
1.3.1.1 Concept of PV cells
The history of photovoltaic dates back to 1839, when the French Physicist Edmond Becquerel first observed the photovoltaic effect, [7, 16]. In 1886, American Charles Fitts constructed a selenium photovoltaic cell converted visible light into electricity with an efficiency of 1%. In the 1930s, the theory was developed for the electrical properties of silicon and other crystalline semiconductors, [7].
The silicon is one of the most semiconductor materials used to construct the PV cells. It has valence four and a diamond crystal structure. When the material is doped (Fig. 1.8), it becomes as a source of electrical energy if it is exposed to the sunlight. The photovoltaic energy conversion relies on the quantum nature of light, which carry the energy given by, [6, 8, 10, 17]:
λ = hc
EPh J or (eV) (1.5)
where: h: Planck constant; c : light speed;
λ : wavelength of light.
The mechanism of the current generation is illustrated by the Fig. 1.9. The photons with energy in excess of the band-gap can be converted into electricity by the solar cells, and the excess of this energy is lost as heat to represent one of the fundamental losses in a solar cell.
The structure of a silicon solar cell is illustrated in Fig. 1.10, where the electrical current is extracted by front and rear contacts of the cell.
Fig. 1.8: Doping of silicon.
(a) With pentavalent atom (b) With trivalent atom, [2]
Si Si Si Si P Si Si Si Si free electron Si Si Si Si B Si Si Si Si hole (a) (b)
1.3.1.2 Solar cell characteristics
The typical equivalent circuit of a solar cell is given in Fig. 1.11. It is composed of a photocurrent source Iph, a reverse diode D and two loss resistances (shunt resistance R and sh
series resistanceR ). When it is connected to an external load s RLoad , the applied output voltage and the circulating current are V and I respectively, [2, 10, 18].
The I-V characteristic of such solar cell, when it is exposed to the sunlight and connected toRLoad, is given by Fig. 1.12. For a given insolation and temperature, three zones can be observed: MN region, where the current is nearly constant, PS region in which the
Fig. 1.9: Generation of electron-hole pairs by light, [8] heat Eg Valence band conduction band heat Incident photon
voltage is also nearly constant and NP region which contains the maximum power point (A). So the load curve must be passing through it.
A real solar cell can be characterised by the fundamental parameters, [15] given in table 1.2.
Table 1.2: Real solar cell parameters
Parameter Practical Equivalence
Iph Isc (1.6) Voc = o Ph t o Ph c B I I ln V I I ln q T mK (1.7)
Pmax ImaxVmax (1.8)
Efficiency a max max in max AG V I P P = (1.9) Fill factor (FF) Sc oc max max Sc oc max I V I V I V P = (1.10) Fig. 1.11: An equivalent circuit for a PV cell or module, [2]
sh R RLoad I V Ph I s R D
Fig. 1.12: A typical current –voltage (I−V) curve for a solar cell for different loads, [15]
1/Ropt 1/R M N S P V (V) I(A) Isc Imax Vmax Voc 0 A
where:
q T mK
V B c
t = : the thermal voltage and T the absolute cell temperature; c
Vmax and Imax : the voltage and the current at the optimum power point respecrtively;
a
G :the ambient irradiation andA the cell area. m is the ideality factor.
1.3.2 Photovoltaic module
A photovoltaic module is the connection of solar cells either in series or in parallel in order to meet specified power output requirements. Fig. 1.13 presents how the I-V curve is modified in the case when two identical cells are connected in series or in parallel.
The constructed module is an arrangement of solar cells with similar characteristics, which are encapsulated to obtain higher power values, [2]. Cells are encapsulated with various materials to protect them and their electrical connectors from the environment, [15]. The manufacturers supply PV cells in modules, consisting of Np parallel branches, each with
Ns solar cells in series, as shown in Fig. 1.14.
The overall objective of module encapsulation includes, [16]: protecting the solar cell, maximizing the amount of sunlight, user safety, etc.
Fig. 1.13: Connection of identical PV cells. (a) In series (b) In parallel, [15]
I(A) V(V) One cell Two cells V(V) I(A) One cell Two cells (a) (b) 0 0
1.3.3 Module characteristics
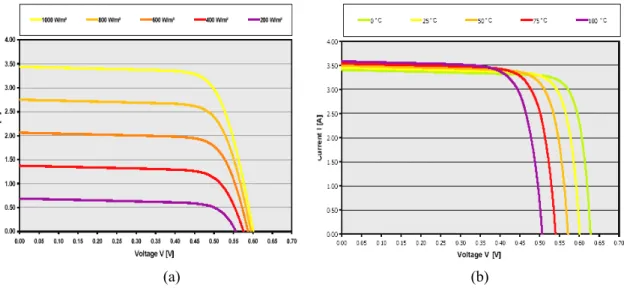
Fig. 1.15a shows that the open circuit voltage increases logarithmically with the
ambient irradiation, while the short circuit current is a linear function of the ambient irradiation. Fig. 1.15b shows that the dominant effect with increasing cell’s temperature is the linear decrease of the open voltage, the cell being thus less efficient. The short circuit current slightly increases with cell temperature, [15].
1.3.4 Photovoltaic array
A photovoltaic array is defined as a mechanical and electrical integrated assembly of photovoltaic modules together with support structure, as required to form a direct current power supply unit.
The power output of a module is seriously affected when the module is practically shadowed or has one or more damaged cells. This problem has to be prevented for the
Fig. 1.14: The PV module construction Encapsulation
Solar cells Cadre
Fig. 1.15: Influence of the ambient cell temperature and irradiation on the cell characteristics. (a) The influence of cell temperature (b) The effect of the irradiation, [15]
photovoltaic array to perform efficiently. To alleviate this problem a diode is connected either for a single solar cell or for a module. In the practical, a bypass diode is connected in parallel with modules as it is shown in Fig. 1.16.
According to the inclination of tilt angles of PV arrays, there are several types in application today. Among these are, [16]: flat-Plate stationary arrays and tracking arrays.
Concerning the sizing of the PV array, three items need to be addressed: module selection, number of modules, and the orientation tilt. A several PV design packages exist in the market, [16].
1.4 Power conditioning elements
According to the nature of the generated PV power (DC type) and its dependency on the weather conditions (insolation and temperature), it will become necessary to integrate the power conditioning elements: namely a DC-DC maximum power point tracking element, an inverter to convert DC power to AC type and two filters .
1.4.1 DC-DC maximum power point tracking
The purpose of the maximum power point tracking (MPPT) is to move the array operating voltage close to the MPP under changing atmospheric conditions, [19, 20]. A MPPT is, usually, a power electronic DC-DC converter inserted between the PV module and its load
Fig. 1.16: Protection of PV array composed of series-parallel connection of modules, [16] - + - + - + - + - + - + - + - + - + - + - To load
to achieve optimum matching, [21]. Fig. 1.17 shows an example of a buck- boost converter with its waveforms, [3, 19].
1.4.2 Inverter
According to the wave shape, there exist many types of inverters: as square-wave inverters and sine-wave inverters, etc. Since many consumers and the public grid operate on the basis of sine-wave type voltage, high quality inverters should also be able to provide this type of AC output. This voltage form can be obtained in different ways. Some of the most common layouts are pulse-width-modulation (PWM) inverters. Fig. 1.18 shows a typical configuration of single phase full-bridge inverter, [2, 4, 9, 11]. This configuration is suitable for residential applications.
It is a noticed that the filters in both sides of DC-AC converter will be treated in the next chapters.
Fig. 1.17: Circuit and waveforms of DC/DC buck-boost converter
+ i L C Vo -+ L -iS s D + VL - Vi t iL t iS toff ton t VL Vi -Vo
Fig. 1.18: Full bridge single phase voltage source inverter, [2]
Vout D1 S2 D2 D3 D4 S1 S3 C S4 GPV L
1.5 Conclusion
The objective of this chapter was to have a complete idea about the components required for building a photovoltaic system. Therefore, the most necessary elements were studied. Solar radiation source, characteristics, and measurements were presented. PV generator (solar cells, modules, arrays) was also studied. Lastly, this study was finished by outlook for the power conditioning elements including DC-DC and DC-AC converters.
The next chapter will deal with one of the most important applications of the PV system, namely, conception of grid connected photovoltaic system.
2.1 Introduction
The conventional stand-alone systems have the advantages of simple system configuration and control scheme. However, in order to draw maximum power from PV arrays and store excess energy, battery banks are required in these systems. For high power systems, they will increase system cost and weight, and narrow the application areas. Therefore, grid-connected systems, which are designed to relieve this shortcoming, have become the primary researches in PV power supply applications, [4].
In this chapter, a general descriptive study of grid-connected PV system will be presented. This study includes: system conception, types, problems encountered, technical interconnection standards requirements, some developed programs, and finally the study will be ended by selecting studded examples of the grid-connected PV system.
2.2 Conception of grid-connected PV system
The photovoltaic power systems have made a successful transition from a stand-alone feature to large grid-connected systems. Grid-connected PV systems can vary in size, but these systems have common components. In addition to the PV components mentioned previously, the grid connected elements necessitated to be appeared here are: the power- voltage-current controller, and input/output inverter filters, as well as a metering equipment to monitor the power that is fed into the grid and vice versa, [22].
The utility grid acts as storage means for the PV arrays during daytime, therefore the load is supplied by two sources, photovoltaic source and the utility source, [17, 22, 23], as shown in Fig. 2.1 which will be proposed as a case study in this project.
Interconnection of power generation from PV energy sources to the grid needs static DC-DC and DC-AC converters. Connection of the converters with the distribution network is done using passive filters in order to attenuate the voltage and current harmonics, [24, 25].
GPV
MPPT
Fig. 2.1: Power circuit of a grid-connected PV system DC-AC Converter Utility Load Input filter Output filter
Input filter
The effect of the weather conditions on the PV energy which cause fluctuations in voltage and current, make it necessary to insert the input filter to the system to adjust the DC voltage of the inverter at certain value. In the fact, there are many filters topologies as shown in Fig. 2.2a, but by taking the economical and technical considerations into account, the C filter is the suitable one. The capacitance C must be sufficient to making inverter input establishes the character of voltage source type, [24].
Output filter
Because of rapid changes in voltages and currents within a switching converter, power electronic equipment is a source of Electromagnetic Interference (EMI). Legislation and regulations require interference generated by equipment to be limited to relevant standards (ANSI/IEEE Standard 929-2000, UL-1741, and/or National Electrical Code® (NEC®). Therefore, it is also necessary to insert an inverter output filter which must be characterized by its capability to eliminate the maximum harmonics (voltage & current) exit from the inverter, [25]. Fig. 2.2b illustrates types of the output filters.
2.3 Types of grid-connected PV systems
Two types of grid-connected PV systems are generally found: Embedded and Distributed generations, [9, 22]. (a) out C 1 out L Lout2 out C out L
Fig. 2.2: Filtering requirements.
(a) Input filter (b) Output filter
in C in C in L Cin 1 in L Lin2 (b) out L
The embedded PV generation, from hundreds of kW to a MW, tied to the utility distribution network can be a cost-effective solution to the problems of overload or power quality at critical points in the network. Also it is showed that it would be more cost effective to install a PV plant feeding power to a substation at the critical point rather than implementing expensive upgrades. With increasing demands of power in developing countries, embedded generation would be an attractive alternative solution for them. Currently, there are not many studies developed for distribution network of a utility in a developing country. Studies should be carried out as soon as possible to unlock a potentially large market. The PV system could provide an increased reliability in terms of supply, and could bring benefits to the economy to countries that introduces [9].
The distributed generation designated to supply consumers where the power demand is less than a few kWs (<10kW). Individual PV systems on buildings (residential or commercial) connected to the grid constitute the distributed generation. The purpose of distributed generation is to avoid buying electricity from the utility as possible. The great advantage of distributed generation from buildings is that very large area can be covered without employing additional land area.
2.4 Problems and risks involving grid-connected PV systems
The problems that should be anticipated involving interconnection of PV system to the grid would include, [26]:
• Disconnection of PV system if the grid fails (islanding problems); • Earthing and lightning protection;
• Quality of power input to the grid;
• Effects of multiple systems on a part of the grid, particularly unbalanced single phase generation;
• Reliable metering of the power flows; • Technical and financial risks.
Here are some details concerning these problems:
Islanding problems
The phenomenon of islanding is the operating of the PV system in the absence (poor grid reliability) of the grid. This phenomenon could cause transient over-currents when the grid power is connected back. Protection control circuits are developed and constantly revised to protect the grid and the PV from this problem and other problems such as lightning surges,
Quality of power input to the grid
Many norms impose several rules to insure a high quality of power injected to the grid. For example, it states that these PV systems should be compatible with the voltage, wave shape and frequency of the grid. When either the power source/generators or the loads have solid-state equipments, harmonic currents will flow in the system. These harmonics can cause detrimental destruction to the control devices. Overrating of generators, transformers, cable, motors and circuit breakers are needed when higher harmonics are significant. Special voltage generator voltage control systems are required to avoid erratic operations, [22].
Reliable metering of the power flows
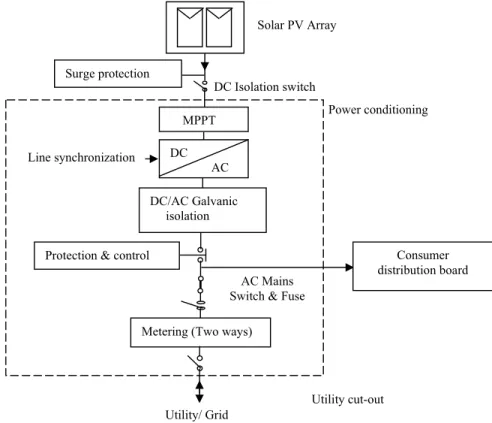
Fig. 2.2, shows the typical connection of PV system to the grid, where a reliable two-way meter is installed, so that a reliable monitoring of the power flows could be obtained. This meter should also be able to tell the consumers of any changeover of power flow. Most countries that have PV systems connected to the grid have only one-way metering, [28].
Technical and financial risks
The electricity utilities present its reluctance to this technology with risks that they have no historical basis for quantifying. Some of the risks that were highlighted are, [22]:
Fig. 2.3: Typical connection of PV system to the grid, [28] MPPT
Protection & control
Metering (Two ways)
Utility/ Grid
AC Mains Switch & Fuse DC AC Line synchronization DC Isolation switch Solar PV Array Surge protection Consumer distribution board Power conditioning Utility cut-out DC/AC Galvanic isolation
• Technical risks: there is a possibility that the system will not be performed as specified; • Construction risks: the possibility of going over budget, or construction of the system
cannot be completed by the due date;
• Operating risks: the possibility that the system breaks down or power is unavailable when it is in demand. Other operating risks would include islanding;
• Financial limitations: high costs of finance based on the perceived risks above.
2.5 Technical interconnection requirements
The connection of the PV system with the utility grid, safety and quality for individual and companies must adhere to the standards that are developed and approved by the National standards setting authorities. The standards are as follow, [22, 26]:
• ANSI/IEEE Standard 929-2000, IEEE Recommended Practice for Utility Interface of Photovoltaic (PV) Systems.
• UL-1741, Standard for Static Inverters and Charge Controllers for Use in Photovoltaic Power Systems, Underwriters Laboratories Inc. (UL), May 1999.
• National Electrical Code® (NEC®), National Fire Protection Association, 2002.
ANS/IEEE Standard 929-2000
The IEEE 929-2000 is standard to which the PV interconnection hardware designs must adhere. This standard removes all costly and inefficient situations where different utilities require different and specialized hardware. The standard allows the PV systems to perform as expected and allow them to be installed at a reasonable cost without compromising on the safety and operational issues. IEEE 929-2000 is the first IEEE standard that allows interconnection of non-utility owned generation equipment, [26].
Their focuses are on the Power Quality (i.e. the normal operating voltage range, voltage flicker, frequency, waveform distortion and power factor), safety and protection functions (i.e. frequency disturbances and islanding protection, etc). Some of the standards are discussed briefly:
• The normal operating voltage range is selected as a protection function that responds to abnormal utility conditions. The injected current has the potential of impacting the utility voltage. As long as the PV current injection on a utility line remains less than the load on that line, the utility’s voltage regulation devices will continue to operate normally.
• The voltage flicker indicated for the connection of the inverter to the utility system at the point of common coupling should not exceed the limits defined by the maximum
borderline of irritation curve identified in IEEE STD 519-1992. This requirement is necessary to minimize the adverse voltage effects to other customers on the utility system.
• The frequency of both PV and utility systems must be synchronized. The two systems should follow the frequency operating window standards in their part of their world. Utilities may require adjustable operating frequency settings for intermediate and large systems.
• The islanding protection should be included into any PV system tied to the grid. This is done by detecting the voltage and frequency of the utility grid. The IEEE 929 includes several other standards like the UL-1741. These standards are developed to assure that power that is supplied to the grid meets the harmonic content, frequency and voltage level. The main concern for the standard is to guarantee that the power conditioning unit (PCU) disconnects from the utility when the grid fails, or falls outside the operating window for voltage or frequency. Other standards that need to be followed are found in the IEEE 929 document [22].
UL-1741
The UL-1741 covers the safety aspects of the PV inverters and charges the controllers, tests for anti-islanding capabilities voltage and frequency trip points, [26]. A PV power plant feeds the generated power instantaneously into the grid by employing one or more inverters and transformers as shown in Fig. 2.4. Therefore, any PCU that passes the UL-1741 would definitely pass the criteria of the IEEE 929 standard. These PCUs do not need additional protective equipment to prevent islanding or filters to maintain power quality.
Fig. 2.4: multiple inverter PV power plant, [26] DC AC DC AC DC AC To grid Inverters Transformers PVG
2002 National Electrical Code® (NEC ®)
The NEC® covers the technical issues that are related to the safety and performance assuming the PV system to be customer-owned and it is connected on the load side. That will enable future PV systems to be installed using clearly defined requirements. Some of the requirements include ground fault protection, specific grounding, and over current protection, interconnection issues and others.
2.6 Benefits of grid connected PV system
In this section, the benefits of connecting a PV system to the grid will be discussed. Some of the advantages of grid-connected PV system over stand-alone systems would include the savings from wiring costs, batteries and the possibility that grid-connected PV system could sell off the surplus electricity to the utility. Some of the benefits of grid-connected PV systems are briefly discussed in the following sections, [26]:
Reduction in labor costs
By following the requirements set by IEEE, UL & the NEC®, the utility would remove the need to come out with requirements or standards of its own. The use of two-way metering also would reduce the need for separate processing of meter readings for electricity that is delivered to and from the customers.
Reduction in equipment costs
Inverters that follows the UL-1741 standards would provide safety and power quality protection, therefore eliminates the need for the utility to implement a separate protection devices on its network.
Distributed generation benefits
Studies have shown that there is a direct, measurable economic benefit of distributed generation, [26], which includes reduced energy losses in transmission and distribution lines. Other advantages would include voltage support, reactive power losses, deferred substation upgrades, deferred transmission capacity and reduced demand for spinning reserve capacity.
Environmental benefits
PV electricity generation would reduce the effects of pollution caused by conventional power generators. Looking at the green house effects, PV electricity generation would provide a better alternative to the pollution problems, [2]. Grid connected PV systems reduce the
consumption of natural resources, such as coal, oil, etc, therefore diminishing the need for new power stations.
2.7 Some developed programs around the world
There are many important developed programs around the word in whole fields of renewable energy; in this section, the study focus at the developed PV Programs, especially where the grid-connected is applied.
In the United State, the Department of Energy (1970-1980) monitored household loads in one of their research programs. They evaluated and provided technical information on residential PV systems in different regions; build and monitored PV powered homes and commercial buildings, and studied their impacts on the power distribution network. This program is now superceded by the “Solar 2000” program, which aims to develop economically competitive PV systems and hence increase installed capacity in the US from 50 MW to 1000 MW by 2000 and 50,000 MW by 2010-2030, [22]. Other US Programs include the Utility PV Group (UPVG). They planned to educate utility end users as to the value of PV in their systems and introduced a cost effective and emerging PV technology in
US utility grids from 1993 onwards, [22]. In Japan, Grid-connected market increases satisfactory in 2001. 50 kW for off-grid
domestic application, 5960 kW for off-grid non-domestic application, and 116 000 kW for grid-connected, for grid-connected distributed applications, especially in residential sector were installed.
In year 2000 grid-connected distributed systems increased dramatically because the additional budget for Residential PV System Dissemination Program was approved to correspond to great demand for residential PV systems. Thus, the total installed capacity of grid-connected distributed systems in 2000 increase 77% from the year before, [29].
In 1992, Austria began a “200 kW Photovoltaic Rooftop Program”. Financial support is provided to the householder for the building integrated, utility connected PV systems up to 3.6 kWp. The program was closely monitored to assess the feasibility of decentralized generation, [22].
In the last several years, Germany has executed important programs in the field of PV that have triggered remarkable results in market development and technology progress.
While most developing countries install stand-alone PV systems, India has planned major PV programs, including grid-connected systems up to 100 kWp. Seventy central village
sized PV plants, ranging from 2 to 10 kW are now in operation. In 1993-94 further 200 kW of the same system was installed.
Installed PV capacity in Australia grew by 15% in 2000, with 3.89 MWp PV system installed. A large proportion (over 80%) of this was for installations on residential, commercial and educational buildings, a market stimulated by an Australian Government PV rebate program. The grid-connected PV market continues to grow and now represents 10% of installed capacity, [30].
2.8 Examples of grid-connected PV system
In this section, the study will be focused on the most important examples, which have been studied, to get a general idea about the different constructions, considerations, and technical methods which are used in grid-connected PV systems. For this purpose, several studies will be summarized including: Power flow control of a single distributed generation unit with nonlinear local load, [31], Optimization of photovoltaic system connected to electric power grid, [32], Utility-connected power converter for maximizing power transfer from a PV source while drawing ripple-free current, [33], Novel maximum-power-point-tracking controller for PV energy conversion system, [34].
2.8.1 Power flow control of a single distributed generation unit with nonlinear local load
This example was introduced from three phases distribution to one phase to will be suitable for our case study. It combines voltage regulation plus harmonic (current control) minimization under island mode and decoupled P and Q control under grid-connected mode with a nonlinear local load. The control does not require knowledge of the equivalent impedance of the utility grid distribution (DG) unit is connected to and yields seamless switching transients between island mode and grid-connected mode, strong P and Q regulation capability, fast enough response, and purely sinusoidal.
2.8.1.1 System description
The DG unit, as shown in Fig. 2.5, consists of a DC bus powered by any DC source or AC source with a rectifier, a voltage source inverter, an LC filter stage, an isolation transformer with secondary side filtering. The DG unit has a local load, linear or crest, and is connected to the utility grid through a TRIAC. The utility grid is modelled as an equivalent AC source with an equivalent internal impedance (Z).
2.8.1.2 Control scheme
Under island mode, the inverter conducts voltage control, where the load voltage (Vout) should track the given reference. The voltage control goal is strong voltage regulation,
low static error in rms, fast transient response, and low total harmonic distortion (THD). If the voltage of the utility main Vu is measured and used as the reference, Vout will be controlled to
match Vu in magnitude and synchronized in phase angle.
Under grid-connected mode, the DG unit conducts power control, where the output active power P and reactive power Q from the DG unit to the utility grid should be regulated to desired values Pref and Qref.Both Pref and Qref can be positive or negative, which provides
possibility for the DG unit to help with the energy production and stability enhancement of the power system or sustain power supply to local load when it exceeds the capacity of the DG. The control goal of power regulation is stability, low static error, and fast response. In
the switching transient from island mode to grid connected mode, even though Vout matches
Vu before the TRIAC is turned on, transient current will still flow due to the change of the
circuit topology.
2.8.2 Optimization of photovoltaic system connected to electric power grid
This example proposed the use of a PWM inverter to promote the interface of a photovoltaic system with the AC system. The main idea is to make this system to operate as a controllable voltage source connected in parallel with the power grid.
2.8.2.1 Operation principles
This work proposes the use of a PWM inverter, to promote the interface of a photovoltaic system with the ac system. The idea is to make this system to operate as a controllable voltage source connected in parallel with the power grid. By controlling the inverter output voltage phase angle and amplitude in relation to the grid voltage, it is possible
Fig. 2.5: Grid-connected DG unit with local load
Lf C Transformer G Vu Iu Z VDC L oad Inverter controller
to have the photovoltaic system supplying active and reactive power, independently of the sunstroke level.
2.8.2.2 Control technique and power circuit
The control technique used was developed with the objective of adjusting the inverter active and reactive power supplied to the electric grid, according to what can be produced by the photovoltaic system, in order to maintain the DC side inverter voltage regulated for the best possible performance. The control circuit block diagram and the power circuit for this application are presented in Fig. 2.7.
As shown in Fig. 2.7b, the control circuit is divided in two blocks: block 2 extracts the signal from the current generated by the photovoltaic modules (IPh) and compares it with a
reference signal (IPh,ref), generating an error (e2). This error is multiplied by the grid voltage
signal (Vu) and the result is added to this voltage (Vu), originating a modified value (y2).
Block1 extracts the signal from the DC-side capacitor voltage (Vc) and compares it with a
reference signal (Vc,ref, originating an error (el). This error pass through an integral
proportional circuit and it is multiplied by the grid voltage signal (Vu), which has a 90° phase
shift in advance. This new signal originated (yl) is added to the modified value (y2) from block 2, resulting the PWM reference signal (VI). Therefore, block 2 adjusts the voltage
amplitude, and block 1 adjusts the load angle.
(b) (a) PV System Pulses Vu VC Iph Inverter C VC Filter IPh,ref IPh - + e2 P Sum VC,ref VC - + e1 PI P Su m Vu X2(m) Y2 x1(φ) Y1 I Vu Vu
Block1:Phase angle control
Block2: Amplitude control
VI
Distribution grid
Pulses
Fig. 2.7: Configuration of the system.
2.8.3 Utility-connected power converter for maximizing power transfer from a PV source while drawing ripple-free current
This example presents a power converter for coupling photovoltaic arrays to the utility grid. The converter draws a programmable, ripple-free of current from the photovoltaic array and injects power into the grid at unity power factor. The programmable input current feature makes this converter ideal for use with maximum power point tracking technology.
2.8.3.1 Operation principles
A power converter design for coupling solar panels to the utility grid for power generation was presented. Fig. 2.8 shows a block diagram of the system. The basic features of the system are controllable, ripple-free current drawn from the PV unit, and power injected into the grid at unity power factor. The controllable input current feature makes this design compatible with maximum power point tracking. This design has an additional unique feature in that the DC link is not kept stiff. In a conventional design, the DC link capacitor would be large enough so that AC current drawn from the link by the inverter does not create a large voltage fluctuation in the link.
2.8.3.2 Filter requirements
As seen in Fig. 2.8, the converter has three main filters: CPV, LDC and Clink at the
output of the DC-DC converter, and Linv and Cinv to filter out the inverter switching frequency
ripple current. In a traditional design, the DC link capacitor Clink is designed to be large so that
any ripple current drawn from the link flowing through the link capacitor causes a small voltage variation.
2.8.3.3 Control section
There are two main control sections in the system: DC-DC and DC-AC control design sections.
For controller design and simulation the DC-DC converter average model was used. The average model describes the converter behavior for average values of current and voltage without the switching ripple. To design the controller the DC-DC converter must be linearized. The block diagram of the system is included a DC-DC converter control scheme.
The inverter controller has two main functions. First, it must source a sinusoidal current into the grid at unity power factor. Second, it must regulate the link voltage Vlink to a
desired average value. The controller features an inner current loop and outer voltage loop. The voltage loop must be designed to regulate the average voltage of the link. When the DC
link average value is lower than the desired (reference) value, the reference current decreases, which decreases the current drawn from the DC link. This causes the link voltage to increase.
2.8.4 Novel maximum-power-point-tracking controller for PV energy conversion system
In this example, the study was implemented to let the system operates at the maximum Power point to increase the output efficiency of PV arrays. The MPPT method which was used is the perturbation and observation method. Conventionally, PV energy conversion systems are composed of a DC-DC converter, a DC-AC inverter, batteries, and a center-tapped output transformer.
2.8.4.1 Proposed MPPT algorithm
The conventional MPPT algorithms use 0
dVdP = to obtain the maximum output power
point. The perturbation and observation method measures P∆ and V∆ to judge the
momentary operating region, and then, according to the region, the reference voltage is increased or decreased such that the systems operates close to the maximum power point .
2.8.4.2 System configuration and control scheme
A traditional two-stage PV energy conversion system is connected between the PV array and the electrical power system. The DC-DC converter is controlled so as to track the maximum power point of the PV array and to transfer energy to the batteries and inverter. The DC-AC inverter is controlled to produce an output current in phase with the utility voltage and to obtain a unity power factor.
The system configuration of a single-stage PV energy conversion is shown in Fig. 2.9a. It is controlled so as to supply power to the load and supply surplus power with a unity power factor to the utility line. Simultaneously, system must be operated so as to track the maximum
DC-DC Converter DC-AC Converter CPV VPh + - IPh * Ph I - + VDC GC1 Clink LDC Vlink Utility Vinv Linv * link V + - e GC3 GC2 + - * inv i Ilink Cinv + - inv i
power point of the PV array. Fig. 2.9b shows the controller block diagram of the proposed single-stage system. When the system is operated in the solar generator mode, the single-stage
MPPT controller is used to compute Vref the according to the proposed MPPT algorithm.
When the system is operated in the active power line conditioner mode, the reference voltage is a constant voltage. The voltage controller G is used to control the voltage loop to produce vc
the DC reference current command Im. Then, the DC reference current is multiplied by
) t
sin(ωu , which is captured from the phase-locked-loop (PLL) circuit to produce the ac
reference current command *
u i . Load u i u V Lo GPV * 0 i - Gch * u i Gfd Gcc L i ref v m I kPWM Gvci + ) t sin(ωu Gvs PLL + + -+ + + -0 i cont v Gvf Fixed voltage Cref v MPPT controller + Ph I VDC i C f C f L 0 i u V (b)
Fig. 2.9: PV energy conversion system. GPV Load VDC, IPh C L VDC
The single stage controller
Vu
iu
IPh
Switches
2.9 Conclusion
The purpose of this chapter was to have background information about the grid-connected PV system, as it is the case study of this work. For that, a general conception of the system is given together with: its types, problems involving the interconnection, the technical standard interconnection requirements, and the best developed programs around the word. To finish this chapter, many selected studied examples in the field are exposed. In the following chapter, modeling and analysis of the controlled grid-connected PV system will be studied.
3.1 Introduction
Any grid connected PV system can transfer powers with the grid utility, but by what and how this operation is obtained?. The operation can be reached by different controllers for different quantities (powers, voltage, and current). All this necessitates a development and analyzing of different models for different power system elements of course, including controllers models.
The main purpose of this chapter is to describe the model of each element of the proposed controlled grid-connected PV system in order to manage the system operation with maximum power and high energy quality. But first of all, let see the configurations that can be studied.
3.2 Global Configurations
In the distributed PV generation, generally many circuit configurations of topologies can be observed, [35, 36]. The general conception, without transformer, can be illustrated in the Fig. 3.1, where the inverter and its controller are detailed; meanwhile the PV generator (PVG) and the associated MPPT are given as block diagrams. As main elements shown in this figure, the following subsystems are included as well: inverter input and output filters, load, and the grid.
Fig. 3.1: Equivalent circuit of the proposed PV controlled grid-connected system Blocking diode iinv u i u v c i c v + - C 1 L L2 - err + Clink inv v Hysteresis- controller Inverter switches Sin(wt) (50Hz) × maxI MPPT Ph I Ph V G T PVG Vmax Load L i
3.3 System modeling
The power system elements and the related parameters need to be modeled are: solar irradiation, PV generator, MPPT, inverter and its control system, load, and utility models.
3.3.1 PV array model
As it is known, the PV array performance depends totally on the climatic conditions
essentially temperature and insolation. Thus, the model for the insolation versus time, t in hours, can be given as follow, [12, 37]:
) 12 t t sin( E E st max − π = (3.1) where: Emax: the maximal insolation (W/m2);
tst : sunrise time (hours).
As example, Batna site is taken for calculation of the daily insolation, where the maximal insolation in period of summer is 1000 W/m2 and the sunrise is 6h00.
Meanwhile, the PV array model can be obtained as accumulation of its basic component (solar cell). The solar cell equivalent electrical circuit, when neglecting the internal shunt resistance, can be represented by a one-diode model as shown in Fig. 3.2, [2, 7, 11, 18, 19, 38, 39, 40, 41, 42]. This model is considered as the general familiar model.
The I-V characteristics of a solar cell is given by the following equation; where the net current is the difference between the photocurrent and the normal diode current as follow:
− + − = − = (V R I) 1 T mK q exp I I I I I s B sat Ph D Ph (3.2)
where: I : Photocurrent in Ampers; Ph I : Saturation current in Ampers; sat q : Electronic charge in Coulombs;
Rs
IPh D
Fig. 3.2: An equivalent circuit of a solar cell I V G T D I
B
K : Boltzman constant in Joules per Kelvin.
T : Junction temperature in Kelvin; m : Ideality factor.
In this model, the saturation and photocurrent are varied with temperature and insolation according to the following equations, [38, 43]:
− = T 1 T 1 T K qE exp T T I I ref B g 3 ref or sat (3.3)
[
]
100 G ) 25 T ( K I IPh = SC + I C − (3.4) where: I : the saturation current at or T (the reference temperature in K); refEg: band gap of the semiconductor used; G : insolation in W/m2 .
In a general, there are many models to represent the PV generator I-V characteristics. In this work, the following model is chosen according its simplicity to carryout, [11, 37]:
− − = 1 V C V exp C 1 I I oc 2 ref 1 sc ref (3.5) where: − − = oc 2 mp sc mp 1 C V V exp I I 1 C (3.6) − − = sc mp oc mp 2 I I 1 ln 1 V V C (3.7)
This model requires three measured points in order to define this curve, namely the open circuit voltage, the short circuit currant and the maximum power point.
Adaptation of equation (3.5) to other levels of insolations and temperatures are carried out using the following equations, [43]. These equations shift any point (Vref,Iref) of the reference I− curve to a new point (V I,V).
![Fig. 1.2: Definitions of the zenith angle and the air mass, [7]](https://thumb-eu.123doks.com/thumbv2/123doknet/14913134.659451/12.918.282.651.294.546/fig-definitions-zenith-angle-air-mass.webp)
![Fig. 1.10: Structure of a typical crystalline silicon solar cell, [10]](https://thumb-eu.123doks.com/thumbv2/123doknet/14913134.659451/17.918.181.740.328.754/fig-structure-typical-crystalline-silicon-solar-cell.webp)
![Fig. 1.16: Protection of PV array composed of series-parallel connection of modules, [16]](https://thumb-eu.123doks.com/thumbv2/123doknet/14913134.659451/21.918.249.706.369.741/fig-protection-array-composed-series-parallel-connection-modules.webp)
![Fig. 1.18: Full bridge single phase voltage source inverter, [2]](https://thumb-eu.123doks.com/thumbv2/123doknet/14913134.659451/22.918.164.733.802.1014/fig-full-bridge-single-phase-voltage-source-inverter.webp)

![Fig. 2.4: multiple inverter PV power plant, [26]](https://thumb-eu.123doks.com/thumbv2/123doknet/14913134.659451/29.918.220.733.785.1015/fig-multiple-inverter-pv-power-plant.webp)
