HAL Id: hal-02614512
https://hal-amu.archives-ouvertes.fr/hal-02614512
Submitted on 21 May 2020
HAL is a multi-disciplinary open access
archive for the deposit and dissemination of
sci-entific research documents, whether they are
pub-lished or not. The documents may come from
teaching and research institutions in France or
abroad, or from public or private research centers.
L’archive ouverte pluridisciplinaire HAL, est
destinée au dépôt et à la diffusion de documents
scientifiques de niveau recherche, publiés ou non,
émanant des établissements d’enseignement et de
recherche français ou étrangers, des laboratoires
publics ou privés.
Optimal Sizing of hybrid grid-connected energy system
with demand side scheduling
Majdi Saidi, Zhongliang Li, Seifeddine Ben Elghali, Rachid Outbib
To cite this version:
Majdi Saidi, Zhongliang Li, Seifeddine Ben Elghali, Rachid Outbib.
Optimal Sizing of hybrid
grid-connected energy system with demand side scheduling.
IECON 2019 - 45th Annual
Con-ference of the IEEE Industrial Electronics Society, Oct 2019, Lisbon, France.
pp.2209-2214,
�10.1109/IECON.2019.8926623�. �hal-02614512�
Optimal Sizing of hybrid grid-connected energy
system with demand side scheduling
Majdi Saidi, Zhongliang Li, Seifeddine Ben Elghali, Rachid Outbib
Abstract—With the accelerated development of the renewable energy and smart grid technologies, more and more electricity consumers are planning integrating local renewable systems for economical and ecological reasons. To be efficient, the system has to be sized optimally in consideration of both energy generation and consumption. Meanwhile, the demand side management subject to consume energy more flexibly has been drawing more and more attention. In this study, an optimal sizing strategy is proposed for grid-connected PV/WT hybrid system with demand side scheduling. To do this, the energy consumption related to different load types are modeled for scheduling. A bi-level optimization framework is then proposed to realize load scheduling within the optimal sizing. In the framework, down-level is for load scheduling and achieved by genetic algorithm, while the up-level is dedicated to optimal sizing and realized by efficient global optimization algorithm. The proposed framework is verified through a case study for an industrial company, whose objective is to size one PV/WT system to compensate the local energy consumption. The obtained results show the benefits of combining system sizing with load scheduling.
Index Terms—Optimal sizing, load scheduling, hybrid power systems, consumption model, multi-level optimization.
I. INTRODUCTION
The shortage of natural resources and the problems of en-vironment have been motivating the applications of renewable energy sources since the last decades. Decentralized power generation is an effective solution to use the renewable energy. A huge growth in local renewable energy system installations are recently driven by cost decreases [1]. To achieve a flexible and secure power supply, multiple renewable/non-renewable energy sources are usually combined. The hybrid energy sources are connected energy storage units and loads are usually connected and formed as a potential micro-grid [2].
Proper sizing of a hybrid renewable energy system is important, since a properly sized energy system have greater potential to provide higher-quality electricity, higher system efficiency, and less cost [3]. Different factors can be considered for sizing a hybrid renewable system, such as power security level, economical factors, environmental and social acceptance factors. Different sizing criteria and resolution methods are reviewed in [4]. In most case, the sizing problem is formulated as a constrained optimization problem. The power balance, either as a constraint or a criterion, is one of the most important factors for proper sizing. To analyze the power flow within a
All the authors are with the LIS Lab (UMR CNRS 7020), Aix-Marseille University, 13397 Marseille Cedex 20, France (e-mail: [email protected]; [email protected]; [email protected]; [email protected]). M. Saidi is also with Energy Mechanical Building company, 13420 Gemenos, France.
micro-grid, the load power profile is usually required in prior. The sizing result is therefore dependent on the characteristics of the load.
As the development of communication technology, it is also possible for modern micro-grids to provide two-way communi-cation channels between the energy generation sources and the end users. The shift of some loads to the periods out of demand peaks or to renewable generation periods is thus feasible. This offers reduced system operation costs, lower electricity costs, and reduced emissions [5]. Several works were have been proposed for demand side management or load scheduling in micro-grids. Some representative works can be found as follows. In [6], a model predictive control based demand side management method is proposed for a grid-connected photovoltaic-battery hybrid system. In [7], the manufacturing is modelled and scheduled for power consumption and carbon footprint reduction. The works proposed in [8] and [9] are respectively devoted to the power consumption scheduling for domestic use and for residential buildings.
The load scheduling should be dependent on the profile of the generated energy which is determined partially by the system sizing. Hence, the system sizing and load scheduling are interrelated. In the system sizing phase, it is nature that the effect of load scheduling should be taken into account. However, in most of the existing works the system sizing and load scheduling are usually carried out sequentially and separately. A hybrid energy system is usually sized considering a fixed load profile. While the load scheduling is usually achieved for a given sized system.
The main objective of the work is to propose the optimal sizing in consideration of the load flexibility by integrating the load scheduling procedure. Specifically, a hybrid energy system consisting of photovoltaic (PV) panels and wind turbines (WT) is designed for a manufacturer of industrial products to complement the consumption of electricity from the utility grid. In the studied case, the load of this specific consumer is schedulable and periodic. The sizing of the PV/WT system integrated with load scheduling is achieved in a bi-level optimization framework. On the down-level, the load is firstly modelled. Then, the load scheduling subject to one production cycle is achieved using genetic algorithm. The up-level optimization is dedicated to the system sizing. The calculation of the cost function for sizing involves multiple time-consuming load scheduling processes. Efficient global optimization (EGO) algorithm is adopted to reduce the prob-lem resolution time and obtain the final optimal sizing.
The rest of paper is organized as follows: In Section II, the model of the concerned PV/WT system and the design
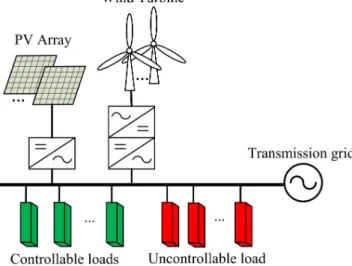
Fig. 1. Diagram of the PV/WT hybrid energy system.
criterion is presented. Section III is dedicated to describing the load model and the load scheduling based on the built model. In Section IV, the bi-level optimization framework is talked about and the algorithm used in the two levels are indicated. After that, the results for the case study are analyzed and discussed in Section V. The paper is finally concluded in Section VI.
II. SYSTEM MODELING AND DESIGN CRITERIA
The structure of the studied PV/WT hybrid energy system is shown in Fig. 1. The system is designed to compensate the local electricity consumption. To simplify the system installa-tion and maintenance, the energy storage is not considered in this system.
To size the PV/WT system correctly, the power flow should be analyzed firstly. Assuming that PV panels used in our sys-tem are controlled by a maximum power point track regulator, the power generated by a single PV PP V(t) panel at time t is modeled as a simple function of solar radiation [10], as
PP V(t) = G(t)AP VηP V (1)
where G(t) is the solar radiation, AP V is the surface of the PV panel, ηP V is the efficiency of the PV system.
The power generated by a single WT PW T(t) is calculated as a piece-wise function of the wind speed v(t) as follows [11]: PW T(t) = 0, v(t) < vc Pr v(t)3− v3 c v3 r− vc3 , vc< v(t) < vr Pr, vr< v(t) < vmax 0, v(t) > vmax (2)
where vc, vr, and vmax are respectively so-called cut-in, nominal and cut-off speeds, which are dependent on the WT power level.
Given the numbers of PV panel and WT, the power gener-ated by the PV/WT hybrid energy system Pgen(t) is calculated as
Pgen(t) = NP VPP V(t) + NW TPW T(t) (3) In this study, the power generated by the local installed hybrid energy system will not be fed to the transmission grid, but only used to compensate the local consumption. To guarantee the power balance, the power provided by the transmission grid can be calculated as
Pgrid(t) =
Pload(t) − Pgen(t), Pload(t) > Pgen(t)
0, Pload(t) ≤ Pgen(t)
(4)
where Pload is the load power.
The whole cost during the life cycle of the system Call, including the system cost Csystem and electricity bill Celec , can be formulated as
Call= Csystem+ Celec (5)
where the system cost consists of the initial cost, including ac-quisition and installing costs, and the operating & maintenance cost of both PV and WT, as
Csystem=
(P RP V,install+ P RP V,OM)NP V + (P RW T ,install+ P RW T ,OM)NW T
(6) where P RP V,install, P RW T ,install are respectively the initial
costs of PV panel and WT; P RP V,OM, P RW T ,OM are
respectively the operating & maintenance costs of PV panel and WT.
The electricity cost is calculated as follows Celec= P Relec
Z Tlif e
0
Pgrid(t)dt (7)
where P Relec is the price of electricity provided by the transmission grid, Tlif eis the life cycle of the PV/WT system. In this study, the objective of system sizing from the investigator’s perspective is to minimize the total cost Call by finding the optimal combination of NP V and NW T.
III. LOAD MODELING AND SCHEDULING
In this work, the loads can be recognized as controllable or schedulable loads and uncontrollable or fixed ones. Within one production cycle, one day in our case, the whole load power Pload(k) at k his the sum of fixed power Pf ix(k) and the Pclr(k),
Pload(k) = Pf ix(k) + Pclr(k), k = 1, · · · , 24 (8) where Pclr(k) is the sum of the powers of all controllable loads, as Pclr(k) = Nt X i=1 Pi(k), k = 1, · · · , 24 (9)
where Piis the power ithcontrollable load, Ntis the number of controllable loads.
The ith load is started at ti h and lasts for Li hours. The power of the ithtask is therefore
Pi(k) = (
P ri, k ∈ [ti, ti+ Li− 1]
0, else , k = 1, · · · , 24 (10)
where P ri is the nominal power of the ith load.
Knowing that in each production cycle, the working time for each task should be assured, Li is therefore considered as constant. The load power Pload(k) is then a function of starting time of each task ti.
In the studied case, the powers and the durations different controllable loads and the fixed loads are identified. When the starting time tifor each controllable load is known, the power curve of the concerned day can be obtained. In Fig. 2, the power curve of one workday is established using the above model as the bar plot. It can be seen that the power curve obtained using the model conforms well the measured power curve, which verifies the load model.
0 5 10 15 20 25 Hour 0 5 10 15 20 25 30 35 40 45 P o w e r[ k W ] load fix load 1 load 2 load 3 load 4 load5 load 6 load 7 load8 load 9 load10 load 11 load 12 load mesure
Fig. 2. Measured and modeled load power during one working day.
The goal of load scheduling is to utilize as much energy generated by the local energy system as possible. In other word, the energy provided by the transmission grid should be minimized. The energy provided by the transmission grid can be expressed as Egrid(day)= 24 X k=1 Pgrid(k) (11)
where Pgrid(k) is adapted from (4).
Pgrid(k) =
Pload(k) − Pgen(k), Pload(k) > Pgen(k)
0, Pload(k) ≤ Pgen(k)
(12) where the power generated by a designed system in a day is denoted as Pgen(k), k = 1, · · · , 24, and is considered known. Egrid(day) is dependent on Pload(k), which is finally a function of ti, i = 1, · · · , Nt. The load scheduling problem is then summarized as a problem of minimizing Egrid(day) by varying ti.
IV. OPTIMAL SIZING USING BI-LEVEL OPTIMIZATION
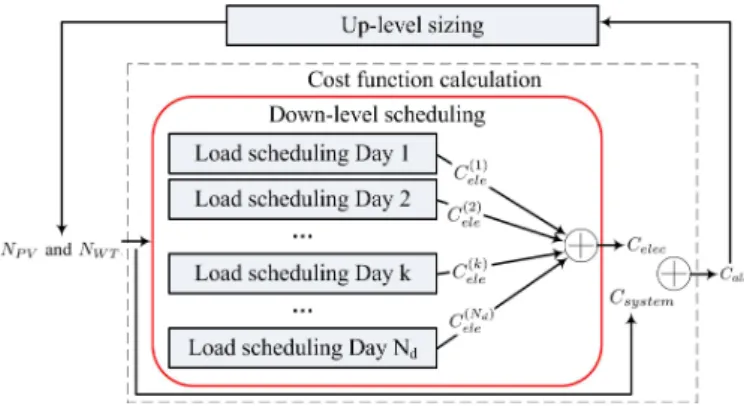
In this work, the sizing of the PV/WT hybrid system is realized by integrating the load scheduling, and through a bi-level optimization procedure. As shown in Fig. 3, the down-level optimization is for load scheduling with respect to one production cycle, i.e., one day in our case. The minimized electricity cost Cele(k)for day k can be obtained after the down-level optimization. The up-down-level optimization is for sizing the system. The whole cost Call used for evaluating the sizing is calculated by considering one-year climatic data. Therefore, multiple daily scheduling actions, i.e., Nd in Fig. 3, have to be carried out for each cost function calculation.
Fig. 3. Schematic of bi-level optimization,
A. Down-level load scheduling
For down-level optimization, the starting time for each controllable load should be optimized to achieve the minimum electricity consumption from the grid. The starting times ti are constrained by the working time, between 7h and 20h for instance, and the their durations Li. The problem can then be one integer constrained optimization one, as
min Egrid(day)(t1, t2, . . . , tN t) (
7 < ti< 20 − Li, i ∈ [1, 2, . . . , Nt] ti∈ Z
(13)
In this study, genetic algorithm is adopted to resolve the down-level optimization. The details of the algorithm can be found in [12].
B. Up-level sizing
The up-level optimization dedicated to sizing can be sum-marized as min Call(NP V, NW T) NP Vmin ≤ NP V ≤ NP Vmax NW Tmin ≤ NW T ≤ NW Tmax NP V, NW T ∈ Z (14)
As stated above, multiple down-level optimizations have to be carried out in each calculation of Call, which is time-consuming. To reduce the resolution time of the up-level optimization, the number of cost function calls should be
lowered to the utmost extent. To realize this, efficient global optimization (EGO) is adopted. The principle of this algorithm is to utilize a surrogate model, or a response surface fitted from the existing calculated samples. By optimizing the less costly surrogate model instead of the original cost function, the computing time can be reduced. The details on EGO can be found in [13] [14].
V. RESULTS AND DISCUSSION
A. Parameters of the studied case
The proposed sizing strategy is applied to one case where a grid-connected PV/WT energy system is designed for one manufacturer of diesel generator. The technical parameters of the concerned PV panel and WT, as well as the economical parameters to evaluate the cost are listed in Table I. Limited by the installing capacity, the maximum number of PV panel NP Vmax and WT NW Tmax are respectively 371 and 6.
TABLE I
TECHNICAL AND ECONOMICAL PARAMETERS OF THE SYSTEM
Technical parameters AP V 1.64 m2 ηP V 0.17 vc 10 m/s vr 12.5 m/s vmax 20 m/s Pr 4 kW Economical parameters P RP V,install 220 C P RP V,OM/P RP V,install 0.6 P RW T ,install 3080 C P RW T ,OM/P RP V,install 0.6 P Relec 0.065 C/kWh
In the studied case, there are 12 controllable loads in addition to the fixed load, as shown in Fig. 2. The nominal powers and the working durations are constant from Monday to Friday, which are summarized in Table II. While only a fixed load power of 3 kW is considered on Saturday and Sunday.
The yearly climatic data of the concerned region, including solar radiation and wind speed, are collected for system sizing. The data, which are recorded from the 1st may of 2018 to 1st may of 2019, are shown in Fig. 4. The life cycle of the system Tlif eis 20 years, which is also used as the period for calculating the cost.
B. System sizing without load scheduling
In the first scenario, the sizing of the system is realized with-out load scheduling procedure. The loads during all workdays are assumed to be identical and as the red cross curve shown in Fig. 2. In this case, the calculation of the objective function
Call with a given combination of PV panel and WT numbers
is easy to realize. The sizing can be therefore realized through a exhaustive search of all the feasible combinations of PV panel and WT numbers. In our case, the number of all the combinations is 2604, which is calculated using the following equation. Ncombination= (NP Vmax+ 1)(N max W T + 1) (15) 0 1000 2000 3000 4000 5000 6000 7000 8000 9000 Hour 0 500 1000 R a d ia ti o n [ W /m 2] 0 1000 2000 3000 4000 5000 6000 7000 8000 9000 Hour 0 20 40 60 80 W in d s p e e d [ m /s ]
Fig. 4. Climatic data of the region.
The obtained optimal PV panel number NP V and WT
number NWT are respectively 44 and 4. The total cost Call
is 1.016 × 10⁵ C, in which the system cost Csystem and
the electricity consumption cost are respectively 3.400 × 10⁴ Cand 6.758×10⁴ C. For reference, the electricity cost without installing a local energy system is 1.258 × 10⁵ C. It is obvious that the installation of PV/WT hybrid energy system benefits a reduced cost with respect to the life-cycle of the system.
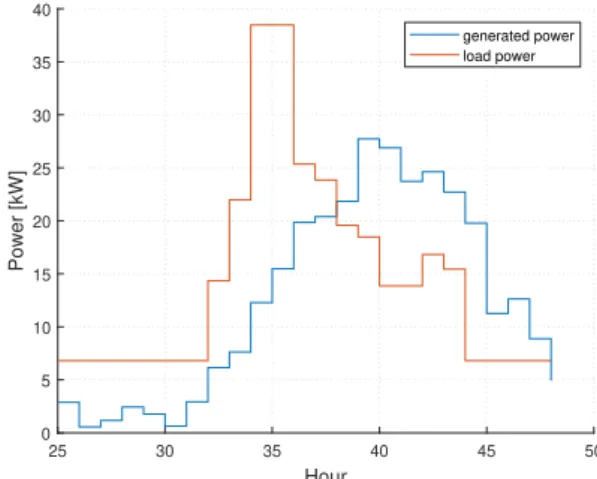
Comparing the power generated by the PV/WT system and the load power, it is found that the power generation and consumption are sometimes mismatched. The power generated and consumed in one day is shown in Fig. 5. It can be noted that the electricity is mainly demanded in the morning while more energy is generated by the system in the afternoon. The local generated energy is not used sufficiently.
25 30 35 40 45 50 Hour 0 5 10 15 20 25 30 35 40 P o w e r [k W ] generated power load power
Fig. 5. Comparison of the generated power and load power without load scheduling.
C. Load scheduling with a pre-designed system
To use more sufficiently the local generated energy and re-duce the electricity consumption from the grid, the controllable loads can be scheduled. With the same configuration of the
TABLE II
POWERS AND DURATIONS OF THE CONTROLLABLE LOAD
Load index 1 2 3 4 5 6 7 8 9 10 11 12 P ri/kW 0.98 0.90 0.90 0.60 3.38 3.38 0.83 1.84 0.42 1.20 13.13 0.13
Li/h 7 5 6 5 7 4 8 10 8 10 2 7
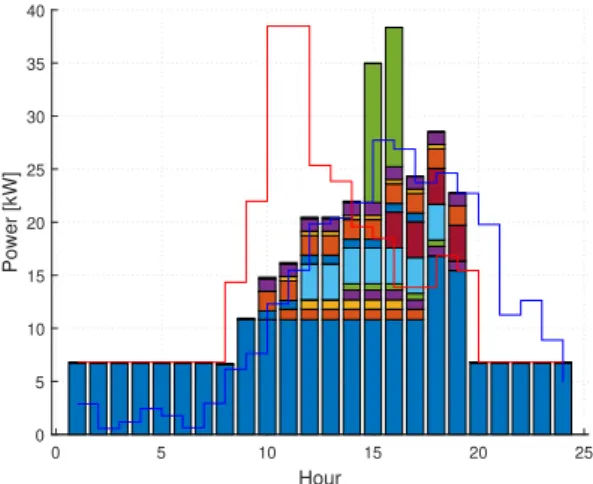
PV/WT system, i.e., the same values of NP V and NWT , the load scheduling is carried out as described in the last Section. Genetic algorithm is applied to achieve the optimal scheduling for all the workdays of one year, which accounts for 271 days. As for the weekends, the load power is fixed, and the load scheduling is not necessary.
With the load scheduling procedure, the electricity cost
is lowered to 6.385 × 10⁴ C. The generated power and
scheduled load power for one day is shown in Fig. 6. It can be observed that the controllable loads are generally scheduled from the morning to the afternoon. The generated power and the scheduled load power are matched more compared to the case without scheduling.
0 5 10 15 20 25 Hour 0 5 10 15 20 25 30 35 40 P o w e r [k W ]
Fig. 6. Comparison of the generated power and load power with preset system. Red line: original load power; Blue line: generated power; Colorful blocks: scheduled power.
D. System sizing with load scheduling
The load profile can be controlled through scheduling, which provides the flexibility for sizing optimally the system. The optimal sizing integrated by load scheduling can be realized by the above mentioned bi-level optimization. For each cost function calculation, genetic algorithm has to be run for 271 times which is time consuming. By using EGO algorithm for the up-level optimization, the optimum can be found with a few number of objective function calls.
By conducting the EGO algorithm for the top-level opti-mization, the optimal PV panel and WT numbers are found after evaluating the cost function for about 30 times. Compared to the exhaustive search which requires 2604 times cost function calculations, the EGO is much more computationally efficient. Even though, The computing time for the bi-level optimization in our case is about 20 mins.
The optimal numbers of PV panels and WTs are found to be respectively 56 and 5. The total cost Call is 9.559 × 10⁴ C, in which the system cost Csystemand the electricity consumption
cost are respectively 4.624 × 10⁴ Cand 4.935 × 10⁴ C.
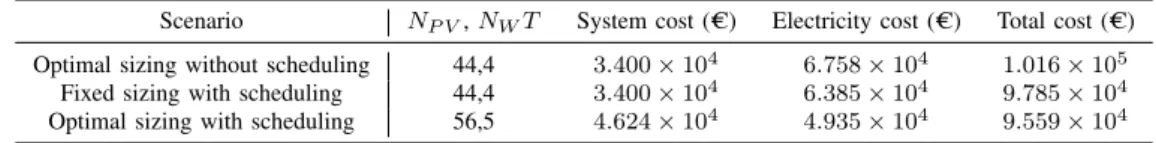
Although more PV panels and WT are installed, the electricity consumption from the transmission grid is lowered more significantly, which reduce the total cost compared to the last two cases. The optimal sizings and the corresponding costs for the three scenarios are summarized in Table III.
Principally, as the load can be scheduled to adapt the generated power characteristic, more PV and WT can be installed to compensate the load consumption. As shown in Fig. 7, the same day as the previous two scenarios is taken to analyze the relation between the power generation and consumption. Compared to the results shown in Fig. 6, more local energy is generated by the PV/WT system, and the load power is covered by the local generated power in most hours on the specific day.
0 5 10 15 20 25 Hour 0 5 10 15 20 25 30 35 40 P o w e r [k W ]
Fig. 7. Comparison of the generated power and load power with optimally sized system. Red line: original load power; Blue line: generated power; Colorful blocks: scheduled power.
E. Discussion
In the studied case, the energy generated by the local PV/WT system is not fed to the transmission grid. The unused generated energy is wasted. In Fig. 7, the energy generated between 16 h and 24 h is more than the demand. It can be seen that the wasted energy account for a large part of the generated energy. That can be the reason why the benefit of installing more PV panels and WTs is not so obvious.
VI. CONCLUSION
In this study, an optimal sizing strategy is proposed for grid-connected PV/WT hybrid system with demand side
schedul-TABLE III
SIZINGS AND COSTS IN DIFFERENT SCENARIOS
Scenario NP V, NWT System cost ( C) Electricity cost ( C) Total cost ( C)
Optimal sizing without scheduling 44,4 3.400 × 10⁴ 6.758 × 10⁴ 1.016 × 10⁵
Fixed sizing with scheduling 44,4 3.400 × 10⁴ 6.385 × 10⁴ 9.785 × 10⁴ Optimal sizing with scheduling 56,5 4.624 × 10⁴ 4.935 × 10⁴ 9.559 × 10⁴
ing. To realize load scheduling, the local load corresponding to the production process is modeled. A bi-level optimization framework is proposed to integrate load scheduling into the system sizing approach. The down-level optimization dedi-cated to load scheduling is achieved using genetic algorithm, while the up-level optimization dedicated to sizing is realized using EGO algorithm. From the real case study, it can be concluded that the electricity consumed from the transmission grid can be reduced, given a same local energy generation. By integrating the load scheduling procedure into the system design phase can be more economically beneficial. With load scheduling, the consumption capacity of local generated en-ergy is enhanced. More renewable enen-ergy units are motivated to be be installed to compensate the local consumption.
In the future work, more flexible system structures, for instance these with energy storage units, can be considered for system sizing. The demand side scheduling can also be combined with energy management.
REFERENCES
[1] N. I. Nwulu and X. Xia, “Optimal dispatch for a microgrid incorporating renewables and demand response,” Renewable Energy, vol. 101, pp. 16– 28, 2017.
[2] Y. Yoldas¸, A. ¨Onen, S. Muyeen, A. V. Vasilakos, and ˙Irfan Alan, “Enhancing smart grid with microgrids: Challenges and opportunities,” Renewable and Sustainable Energy Reviews, vol. 72, pp. 205 – 214, 2017.
[3] A. S. Ogunjuyigbe, T. R. Ayodele, and O. A. Akinola, “Optimal allocation and sizing of PV/Wind/Split-diesel/Battery hybrid energy system for minimizing life cycle cost, carbon emission and dump energy of remote residential building,” Applied Energy, vol. 171, pp. 153–171, 2016.
[4] S. Upadhyay and M. P. Sharma, “A review on configurations, control and sizing methodologies of hybrid energy systems,” Renewable and Sustainable Energy Reviews, vol. 38, pp. 47–63, 2014.
[5] R. Atia and N. Yamada, “Sizing and Analysis of Renewable Energy and Battery Systems in Residential Microgrids,” IEEE Transactions on Smart Grid, vol. 7, no. 3, pp. 1204–1213, 2016.
[6] Z. Wu, H. Tazvinga, and X. Xia, “Demand side management of photovoltaic-battery hybrid system,” Applied Energy, vol. 148, pp. 294– 304, 2015.
[7] K. Fang, N. Uhan, F. Zhao, and J. W. Sutherland, “A new approach to scheduling in manufacturing for power consumption and carbon footprint reduction,” Journal of Manufacturing Systems, vol. 30, no. 4, pp. 234–240, 2011.
[8] Z. Zhao, W. C. Lee, Y. Shin, and K.-B. Song, “An optimal power scheduling method for demand response in home energy management system,” IEEE Transactions on Smart Grid, vol. 4, no. 3, pp. 1391–1400, 2013.
[9] F. Mangiatordi, E. Pallotti, P. Del Vecchio, and F. Leccese, “Power consumption scheduling for residential buildings,” in 2012 11th Interna-tional Conference on Environment and Electrical Engineering. IEEE, 2012, pp. 926–930.
[10] A. Kaabeche, M. Belhamel, and R. Ibtiouen, “Techno-economic valua-tion and optimizavalua-tion of integrated photovoltaic/wind energy conversion system,” Solar energy, vol. 85, no. 10, pp. 2407–2420, 2011. [11] T. Wu, Q. Yang, Z. Bao, and W. Yan, “Coordinated energy dispatching
in microgrid with wind power generation and plug-in electric vehicles,” IEEE Transactions on Smart Grid, vol. 4, no. 3, pp. 1453–1463, 2013.
[12] K. Deep, K. Pratap, M. L. Kansal, and C. Mohan, “A real coded genetic algorithm for solving integer and mixed integer optimization problems,” Applied Mathematics and Computation, vol. 212, no. 2, pp. 505–518, 2009.
[13] D. R. Jones, M. Schonlau, and W. J. Welch, “Efficient global optimiza-tion of expensive black-box funcoptimiza-tions,” Journal of Global optimizaoptimiza-tion, vol. 13, no. 4, pp. 455–492, 1998.
[14] R. Rigo-Mariani, B. Sareni, and X. Roboam, “Integrated optimal design of a smart microgrid with storage,” IEEE Transactions on Smart Grid, vol. 8, no. 4, pp. 1762–1770, 2015.