HAL Id: hal-03125739
https://hal.sorbonne-universite.fr/hal-03125739
Submitted on 29 Jan 2021
HAL is a multi-disciplinary open access archive for the deposit and dissemination of sci-entific research documents, whether they are pub-lished or not. The documents may come from teaching and research institutions in France or abroad, or from public or private research centers.
L’archive ouverte pluridisciplinaire HAL, est destinée au dépôt et à la diffusion de documents scientifiques de niveau recherche, publiés ou non, émanant des établissements d’enseignement et de recherche français ou étrangers, des laboratoires publics ou privés.
from sequential recordings
Oleksandr Sorochynskyi, Stéphane Deny, Olivier Marre, Ulisse Ferrari
To cite this version:
Oleksandr Sorochynskyi, Stéphane Deny, Olivier Marre, Ulisse Ferrari. Predicting synchronous firing of large neural populations from sequential recordings. PLoS Computational Biology, Public Library of Science, 2021, 17 (1), pp.e1008501. �10.1371/journal.pcbi.1008501�. �hal-03125739�
RESEARCH ARTICLE
Predicting synchronous firing of large neural
populations from sequential recordings
Oleksandr Sorochynskyi1, Ste´phane Deny
ID2, Olivier MarreID1☯, Ulisse FerrariID1☯*
1 Sorbonne Universite´ , INSERM, CNRS, Institut de la Vision, 17 rue Moreau, F-75012 Paris, France, 2 Current affiliation: Department of Applied Physics, Stanford University, Stanford, California, United States of America
☯These authors contributed equally to this work.
*ulisse.ferrari@inserm.fr
Abstract
A major goal in neuroscience is to understand how populations of neurons code for stimuli or actions. While the number of neurons that can be recorded simultaneously is increasing at a fast pace, in most cases these recordings cannot access a complete population: some neurons that carry relevant information remain unrecorded. In particular, it is hard to simulta-neously record all the neurons of the same type in a given area. Recent progress have made possible to profile each recorded neuron in a given area thanks to genetic and physio-logical tools, and to pool together recordings from neurons of the same type across different experimental sessions. However, it is unclear how to infer the activity of a full population of neurons of the same type from these sequential recordings. Neural networks exhibit collec-tive behaviour, e.g. noise correlations and synchronous activity, that are not directly cap-tured by a conditionally-independent model that would just put together the spike trains from sequential recordings. Here we show that we can infer the activity of a full population of ret-ina ganglion cells from sequential recordings, using a novel method based on copula distri-butions and maximum entropy modeling. From just the spiking response of each ganglion cell to a repeated stimulus, and a few pairwise recordings, we could predict the noise corre-lations using copulas, and then the full activity of a large population of ganglion cells of the same type using maximum entropy modeling. Remarkably, we could generalize to predict the population responses to different stimuli with similar light conditions and even to different experiments. We could therefore use our method to construct a very large population merg-ing cells’ responses from different experiments. We predicted that synchronous activity in ganglion cell populations saturates only for patches larger than 1.5mm in radius, beyond what is today experimentally accessible.
Author summary
A major goal of neuroscience is to understand how entire populations of neurons process sensory stimuli. This understanding is limited because current experimental techniques do not allow to record all relevant neurons of a sensory structure. A possible strategy to
PLOS
COMPUTATIONAL BIOLOGY
a1111111111 a1111111111 a1111111111 a1111111111 a1111111111 OPEN ACCESS
Citation: Sorochynskyi O, Deny S, Marre O, Ferrari
U (2021) Predicting synchronous firing of large neural populations from sequential recordings. PLoS Comput Biol 17(1): e1008501.https://doi. org/10.1371/journal.pcbi.1008501
Editor: Jakob H Macke, Stiftung caesar, GERMANY Received: June 14, 2019
Accepted: November 9, 2020 Published: January 28, 2021
Copyright:© 2021 Sorochynskyi et al. This is an open access article distributed under the terms of theCreative Commons Attribution License, which permits unrestricted use, distribution, and reproduction in any medium, provided the original author and source are credited.
Data Availability Statement: All data files are
available fromhttps://zenodo.org/record/ 4310029#.X86mmhNKjOQ(10.5281/zenodo. 4310029). Codes for copula model inferences and predictions are available athttps://github.com/ UFerrari/Copula-functions.
Funding: This work was supported by ANR
TRAJECTORY (to OM), by the European Union’s Horizon 2020 research and innovation programme (Human Brain Project SGA2) under grant agreement No. 785907 (to OM), a grant from AVIESAN-UNADEV (to OM). This work was completed with the support of the Programme
overcome this issue, is to use sequential recordings from cells recorded in multiple experi-ments to reconstruct how the entire population will respond. Yet this approach can not account for collective behaviour and synchronous activity within the population. Here we address this issue in the retina and propose a method to infer the activity of an entire pop-ulation of neurons of the same type from sequential recordings. Our method assumes that we have access to many single cell recordings gathered from different experiments, and additionally to a few synchronous recordings of pairs of neurons of the same type. By combining copula distributions and maximum entropy modeling, we used these data to reconstruct the collective activity of a large population of neurons and to show how syn-chrony grows with the number of neurons.
Introduction
A major goal of neuroscience is to understand how populations of neurons process sensory sti-muli. This understanding is limited because, among other reasons, accessing the activity of all neurons of a sensory structure is very challenging. Most techniques only give access to a small fraction of neurons [1,2] (but see [3,4]), leaving as hidden variables many neurons that may play a role in information processing but are not recorded.
To overcome this issue, an emerging, ‘divide and conquer’ approach is to first classify the neurons in a given area into different cell types, where neurons of the same type are supposed to be functionally identical. Then, in a second step, one can characterize the neuronal function of each cell type, to eventually predict how populations composed of all the neurons of the same type will respond to sensory stimuli.
There has been tremendous progress recently in achieving the first step of this approach. Several studies have shown that it is possible to cluster cells in different homogeneous types [5]. This can be done using either the responses of each cell to several standard stimuli [6–8], or using genetic tools [9,10]. These methods have proven successful in isolating most cell types in the retina [7,11,12] and there are several ongoing studies trying to apply these approaches in the cortex [13].
For the second step, many studies have tried to model and predict how neurons of a single type respond to complex stimuli. This strategy has been applied in the retina [14–18] and in many low-level areas [19–21]. A complementary strategy is to use mouse lines expressing GFP in specific cell types in order to record sequentially (i.e. repeatedly across different experi-ments) from cells that are functionally identical. This has been performed in the retina [6,22] and enables one to present as many stimuli as desired to cells belonging to the same type. It is thus possible to gather a lot of information about how single neurons of a well-defined cell type will respond to many different sensory stimuli, using sequential recordings of neurons of the same type taken from different experiments.
Extensive characterization of single cell responses to sensory stimuli is thus possible. The next challenge is to infer how the entire ensemble of neurons of a single type responds together to stimuli. Ideally, one would like to record from all the neurons of a given type, but this is rarely possible.
One possible strategy is to use these sequential recordings from cells of the same type to reconstruct how the entire population will respond. However, reconstructing the activity of a full population from sequential recordings cannot be done by simply pooling the responses to a given stimulus from many sequential recordings. In many cases, pairs of neurons are corre-lated due to shared noise (noise correlation), which might significantly reshape the neurons’
Investissements d’Avenir IHU FOReSIGHT (ANR-18-IAHU-01, to OM and UF), by the French State program Investissements d’Avenir managed by the Agence Nationale de la Recherche [LIFESENSES: ANR-10-LABX-65] (to OM). and by the program ‘‘DIM cerveau et pense´e" from the region Ile-de-France (to SD). The funders had no role in study design, data collection and analysis, decision to publish, or preparation of the manuscript.
Competing interests: The authors have declared
activity [23], and play an important role in information encoding and transmission [15,24–
29]. Because these noise correlations cannot be predicted from sequential recordings, a model is needed to predict them and therefore to infer the activity of a full population of neurons of the same type.
Here we address this issue and propose a method to infer the activity of an entire popula-tion of neurons of the same type from sequential recordings in the retina. Our method assumes that we have access to many single cell recordings gathered from different experiments of neu-rons of the same type, where the same stimulus has been displayed, and additionally to a few recordings of pairs of neurons of the same type. We used these data to reconstruct the activity of a large population of neurons, with a shared noise consistent with the paired recordings.
Previous works have built models capable of predicting the activity of ensembles of neurons in the retina [15,30–35]. However, they were fitted and tested on an ensemble of neurons recorded simultaneously, and it is unclear if they can generalize to predict correlated activity across experiments, a critical feature necessary to reconstruct activity from sequential record-ings. Other approaches [36–40] have focused on predicting missing correlations in a dataset of multiple neuronal ensembles. However, most of these works rely on some overlap between two simultaneously recorded populations to predict correlations for neurons that are not recorded together, while our method is capable of predicting correlations across experiments.
We applied this method in the rat retina, where the activity of many neurons of the same type can be recorded through repetitions of multi-electrode array experiments [3], so that the method can be validated. We first show that a copula-based analysis [41–45] of synchronous activity allows a simple description of noise correlations, that is invariant across stimulus iden-tities and experimental preparations. This description depends only on the individual activities of pairs of cells and on their physical distance. This result allowed us to construct a model based on copulas and to predict -across experiments- the extent of pairwise noise correlations from sequential recordings of neurons of the same type. From this estimation of pairwise cor-relations we then used a time-dependent maximum entropy model [33–35] to infer the activity of the full population of neurons of the same type. We show that this method is accurate and reproduces several features of the recorded population activity. We then applied our method to infer the activity of a large population of neurons of the same type, beyond what can be cur-rently recorded experimentally. Thanks to our inference method, we could estimate the extent of synchronous firing in such a large population, and show that it first grows significantly to then saturate for large populations of about 200 neurons.
Results
Overview of the inference method
The purpose of our method is to reconstruct the activity of a population of neurons of the same type from their individual responses to a same stimulus. Part of this population activity is directly accessible from sequential recordings, but another part needs to be predicted. For example, if we have recorded sequentially two neurons responding to the same stimulus, a naive solution is to pool together their responses as if they had been recorded at the same time. If the noise present in these responses is independent between the two neurons, this is indeed equivalent to recording them together. However, in many cases, the noise between different neurons is correlated. In that case, pooled sequential recordings are not equivalent to simulta-neous recordings [23], and the difference is what is usually termed the noise correlation between these two neurons.
Our method aims at inferring these noise correlations from parsimonious pairwise record-ings of a few cells, and use them to predict how noise will be correlated across an entire PLOS COMPUTATIONAL BIOLOGY Predicting synchronous firing of large neural populations from sequential recordings
population of hundreds of neurons. From this we can reconstruct how a large population of neurons would respond if they were recorded simultaneously, based on sequential recordings.
Our method is divided in three steps. First, we infer the parameter of a model based on cop-ulas [41–43] from simultaneous recordings of few cells. Second, we used the inferred model to predict noise correlations between pairs of neurons from sequential recordings, using only information on the distance between the recorded cells. Our method allows predicting noise correlations for the same pair of neurons responding to a different type of stimulus, and can generalize to predict noise correlations for another pair of neurons of the same type recorded in a different experiment. Third, we use a time-dependent maximum entropy model [33–35] to generalize from pairs of neurons to a full population. This step does not require any addi-tional empirical information with respect to the second step. Note that simultaneous record-ings are necessary only for model inference (and validation), yet sequential recording are sufficient for making prediction.
Here we applied this method to cells of the same type in the rat retina. These data allowed us to test if our reconstruction of the population activity is accurate. Finally, we used our method to infer the synchronous activity of a large neuronal population, much larger than what is nowadays experimentally accessible.
Strong noise correlations between nearby OFF retinal ganglion cells
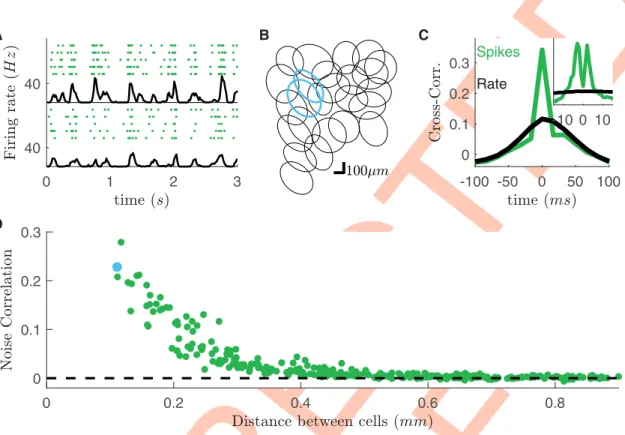
We recorded rat retinal ganglion cells (RGCs) in response to different visual stimuli. We used a previously described method [18] to divide them in different types. Briefly, we clustered their responses to a full field flicker and isolated a single type of OFF-alpha ganglion cells. All these cells responded reliably to a checkerboard stimulus (Fig 1A). The cell responses to random checkerboard have been used to estimate their receptive fields and to find their location. The receptive fields of these cells tiled regularly the visual field (mosaic inFig 1B).
To estimate noise correlation between pairs of cells, we computed the cross-correlation of their spike counts and the cross-correlation of their firing rates (the mean over stimulus repeti-tions of the spike count, respectively green and black lines inFig 1Cinset). Consistently with previous findings [30,32], at short time-scales, spike-count correlation is larger than that of firing rates, but only for nearby pair of cells (Fig 1D). We term noise-correlation the difference between the zero-lag cross-correlation of spike counts and firing rate (Methods). We observed a similar behavior for all visual stimulations and experiments.
In the following we used these data to test our method. We first used copulas to predict the noise correlations between pairs of cells. We then used maximum entropy modelling to recon-struct the activity of a large population of ganglion cells from sequential recordings.
Copula model predicts pairwise response from sequential recordings
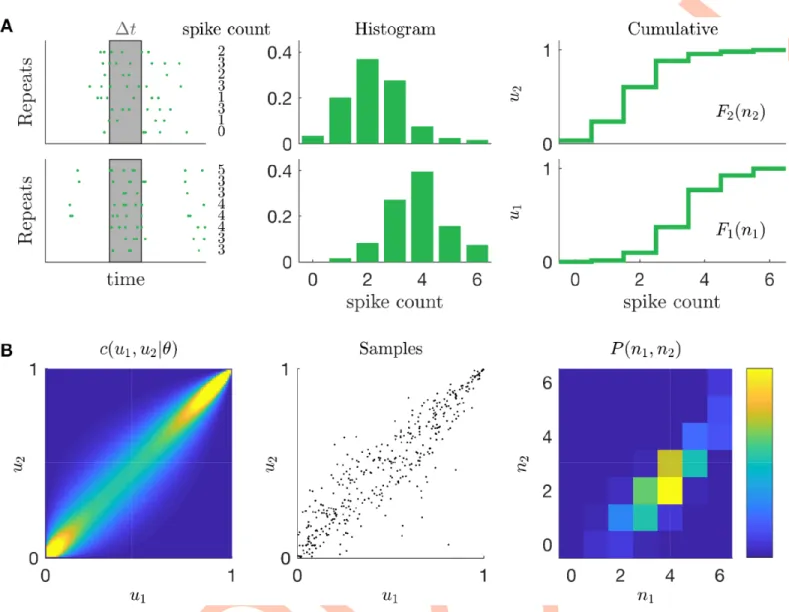
A copula is a method that can build pairwise probability distributions from pairs of single-vari-able distributions (Fig 2andMethods). We used this approach to build the joint spike count distributions of pairs of neurons, that, if marginalized, reproduce the empirical single neuron distributions. For each time-bin, for each recorded neuron, we first estimated the spike count distribution from the response to stimulus repetitions, and from this we obtained its cumula-tive distribution function (Fig 2A). Next a copula model allowed us to compute the joint spike count distribution for all neurons pairs and time-bins using sampling (Fig 2B). Note that in our framework, the copula model and its parameter is the same for all time-bins.
Pairwise parametric copulas are joint cumulative density functions (c.d.f.) characterised by model families with one or several parameters. Among the many possible copulas, a pairwise Gaussian copula is a joint c.d.f that takes a Gaussian form and is characterised by a correlation
coefficient tuning the interaction between the two variables. It is possible to show (suppl. sect.
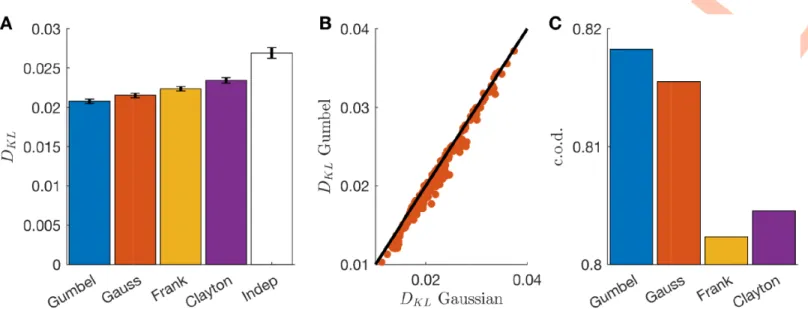
S1 Text) that Gaussian copula modelling is equivalent to discrete dichotomized modelling over integer variables [46]. From this point of view, copulas with different model families can be seen as a generalisation of dichotomized Gaussians, with different functional forms for gen-erating the correlation structure. To determine which was the best model family for our data, we tested several ones (independent, Gaussian, Gumbel, Frank and Clayton, seeMethods) and estimate the Kullback-Leibler divergence with the empirical joint distribution. The Gumbel copula gave the best fits when tested on a stimulus (full-field) different from the one used for training (checkerboard) (Fig 3A) and the improvement over the second best, the Gaussian copula, was significant (t-test over the difference between the log-likelihoods, p-value � 0,Fig 3B). Also the coefficient of determination (c.o.d) for the prediction of the correlation between each pair shows that the Gumbel copula has the larger performance (Fig 3C). Because of this result, we kept the Gumbel family for all the following analysis.
A Gumbel copula is characterized by a parameter that tunes the interaction strength of the two variables, and that can be inferred from data. We found that this copula parameter only depended on the distance between the two cells, and can be fitted using a function with just three parameters (θ = exp(exp(a + bx + cx2)), wherex is the distance between the two
cells.Fig 4A, suppl. sect.S2 Text). We could thus describe the joint activity between all pair of neurons using copulas characterised by only three parameters across the entire population of cells. Once applied on the same response to checkerboard stimulation used for training, our model predicted noise correlations with high accuracy (Pearson’sρ = 0.97, n = 300 pairs, Fig 1. High noise correlation between nearby RGCs subject to checkerboard stimulation. A) Raster plots of two example cells in
response to checkerboard stimulation. Each line corresponds to a repetition of the same visual stimulation. Black line: averaged firing rate of the cell. B) Receptive field mosaic of the recorded OFF cell population. Cyan receptive fields refer to the cells showed in panel A. C) Cross-correlation for the two cyan cells (green,dt = 17ms), superimposed to the cross-correlation of their firing rates (black). Inset: Cross-correlation at finer time scales (dt = 1ms). D) Zero-lag (dt = 17ms) noise-correlation plotted against the distant between cells.
https://doi.org/10.1371/journal.pcbi.1008501.g001
larger thanρ = 0.92 obtained by fitting directly noise correlations (suppl. sect.S4 Text) and c.o.d. = 0.92).
We have built a model with only 3 parameters, that can predict the noise correlation between any pair of neurons from the activity of single cells. We then tested if this model can generalize and predict noise correlations measured in response to different stimuli. We first inferred the copula model from the response to checkerboard stimulation (that ofFig 1). Then, from the response to repetitions of another type of stimulus, we estimated the spike-count distributions of each neuron in each time-bin. Finally, we used our copula model to compute the mean noise-correlations of each neuron pair. We applied this strategy to the RGCs’ response to full-field and moving-bar stimuli (Fig 4B and 4C). In both cases, the copula model was able to reproduce the empirical estimates of noise-correlations with high accuracy (Pearson’sρ = 0.95 and ρ = 0.95, c.o.d. = 0.84 and c.o.d. = 0.88 for full-field and moving-bar Fig 2. Schematic of the copula model. A) First step. Spike counts are estimated across stimulus repetition for a given pair of cells, in a given time-bin. Empirical
histogram of the spike counts are then estimated and later used to compute the empirical cumulative distribution function. B) Second step. A copula distribution then accounts for the mutual dependency of two random variables. From it we draw many samples of pairs of real numbers (u1,u2) 2 [0;1]2with uniform marginals.
Inverse of the cumulative distribution functions transform these samples into pairs of positive integer numbers, whose distribution matches the empirical spike count marginals by construction and accounts for their mutual dependency.
respectively,n = 300 pairs). In addition, in suppl. sect.S3 Textwe show that our predictions are robust across a wide range of time-bins.
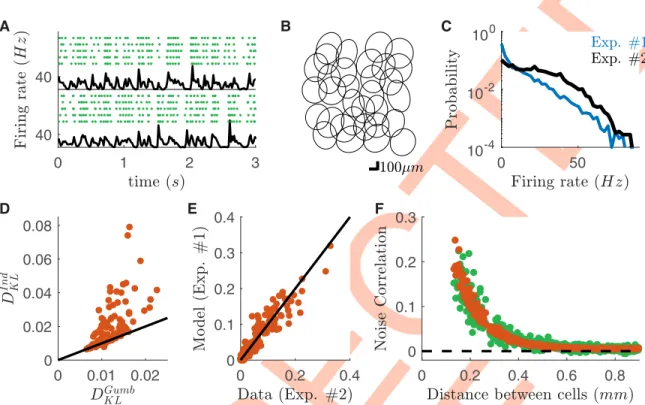
To further demonstrate the robustness of our method we tested if our copula model could predict noise correlations in a different RGC population of the same type, recorded in a differ-ent experimdiffer-ental preparation (Fig 5A and 5B). Note that in the new experiments firing rates were higher than before (Fig 5C). We used the model inferred from the data of the first experi-ment to predict noise correlations between the same type of RGC, but recorded during a sec-ond experiment. Using only single cell responses, our model outperforms an independent copula model (Fig 5D) and its predictions were accurate (Fig 5E, Pearson’sρ = 0.95 and c.o.d.
= 0.91,n = 496 pairs), and accounted for how noise correlations decrease with distance (Fig 5F). The functional dependence of the copula parameter with respect to inter-cell distances is
Fig 3. Gumbel copula outperforms other copula families. A) Kullback-Leibler divergence between empirical and model-predicted distribution for multiple copula
families averaged over all cell pairs. B) Scatterplot of the Kullback-Leibler divergences for Gumbel and Gaussian families for each pair of cells. C) As A but using the c.o.d. for the prediction of noise correlations.
https://doi.org/10.1371/journal.pcbi.1008501.g003
Fig 4. Copula model predicts noise correlations across stimulus ensembles. A) Gumbel copula parameter as a function of the
inter-cell distance. B) Scatterplot of the empirical and model predicted noise correlations for the response to full-field stimulation.
C) As B but for the moving-bar stimulation. In both cases the model has been inferred from the response to checkerboard
stimulation.
https://doi.org/10.1371/journal.pcbi.1008501.g004
thus robust across experiments, and hence corresponds to a general property of OFF-Alpha cells in the rat retina. We obtained similar results for all the 8 testing experiments (overall Pearson’sρ = 0.92 and c.o.d. = 0.80, for a total of n = 1633 pairs).
Note that in order to predict noise correlations (Fig 5) our model never accessed to the simultaneous recordings, but only to the collection of single neuron responses. We could have thus predicted the noise correlation between pairs of neurons in these new experiments using only the sequential recording of each neuron. Therefore, our approach allows for predicting pairwise noise correlations across experiments without requiring simultaneous recordings.
Time-dependent maximum entropy model reconstructs the activity of
large population from the copula’s pairwise predictions
Our copula model predicted pairwise synchronous firing. To reconstruct the activity of a large population of neurons from single cell recordings, we then used atime-dependent Maximum
Entropy population model.
Standard Maximum Entropy models [31] aim at predicting the probability of any spike pat-tern from the mean firing rate of each neuron and the correlations between each pair of cells. Here we use a recent generalization of this approach [34,35] that takes into account a time-varying firing rate. This approach builds a collection of pairwise Maximum Entropy models (one for each time-bin), which share the same couplings, but with different external inputs (fields) for each cell and each time bin [34,35] (Methods).Time-dependent Maximum Entropy Fig 5. Copula model predicts noise correlations across experimental preparations. Data from a second dataset (#2), different from
the one used for training the model (#1). A) Raster plots of two example cells in response to checkerboard stimulation for a second experiment. Each line corresponds to a repetition of the same visual stimulation. Black line: averaged firing rate of the cell. B) Receptive field mosaic of the recorded OFF cell population for the new dataset. C) Firing rate distributions over cells and time-bins for the two experiments. D) Scatterplot of the Kullback-Leibler divergence between empirical and model-predicted distribution for Gumbel and Independent copula models. Each point correspond to a different cell pair. E) Scatterplot of the empirical and model predicted noise correlations from the response to checkerboard stimulation. F) Behavior of the empirical and model predicted noise correlations plotted against the distance between cells.
modelling thus disentangles intrinsic interaction, due to network effects, from extrinsic corre-lations, due to common inputs [35].
We inferred thetime-dependent Maximum Entropy population model from the activity of
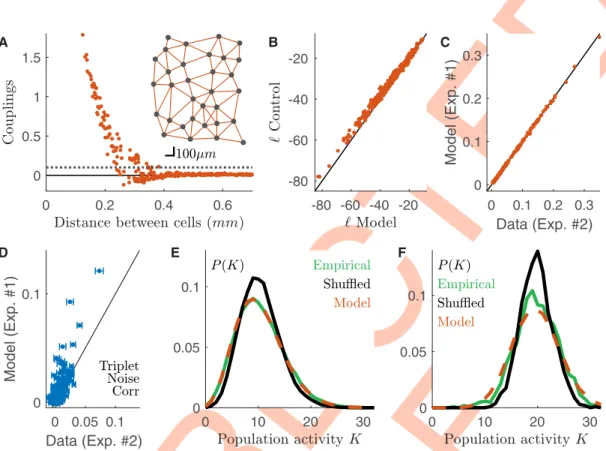
single neurons and the pairwise correlations predicted by the copula model. The inferred cou-plings are large only between nearby cells, and the model reconstructs a “nearest-neighbour” interaction network (Fig 6A). We benchmarked the model against a time-dependent Maxi-mum Entropy model inferred over the first half of the recording. Remarkably the model log-likelihood in each time-bin was only slightly smaller than the control (Fig 6B). As expected the model reproduced well the pairwise noise correlation (Fig 6C, Pearson’sρ = 0.95, coefficient of
determination cod = 0.91,n = 496 pairs), which were already finely predicted by the copula
model (Fig 6E). Remarkably,Fig 6Dshows that the model also partially accounts for the triplet noise correlation (Methods) (R2= 0.3,n = 4960 triplets. R2= 0.25 for the control time-depen-dent Maximum Entropy inferred on the first half of the data.). In order to show that our model captures the synchronous behavior of the neuronal population, we compute the proba-bility distribution of the population rate, i.e. the total number of spikes emitted by the entire population in a given time-bin. We compared this distribution with the “shuffled” distribution, which destroys noise correlations, and is equivalent to the prediction made by a conditionally-independent model (i.e. a model that would assume there are no noise correlations). The
Fig 6. Time-dependent maximum entropy model predicts population synchronous firing across experimental preparations. Data from a second dataset (#2), different from the one used for training the model (#1). A) Behavior of the
inferred couplings with the distance between cells. Grey dotted line threshold for identifying strong couplings. Inset: Position of the cells on the retinal surface, and strong couplings linking them. B) Scatterplot of the log-likelihoods of the copula-based model against those of a model inferred for data of the same experiment. C) Noise correlation prediction of the model against empirical value. As expected by construction, the model reproduces the copula estimations, and hence the empirical values (Fig 5B). D) Model prediction of triplet noise correlations against empirical value (R2= 0.3,n = 4960). E) Empirical, shuffled (cond. independent) and model distributions of the population activity averaged over all time-bins. F) Same as E but for the 5% of time-bins with the highest mean population firing rate.
https://doi.org/10.1371/journal.pcbi.1008501.g006
distribution computed after shuffling the data overestimated the probability of number of spikes close to the average population rate, and underestimated the occurrence of transients of very large or very low activity (Fig 6E and 6F). Remarkably, our model captured the empirical behavior of the population rate averaged over the whole recording (Fig 6E) or when focusing only on highly active time-bins (Fig 6F).
Synchrony behavior in a large population of ganglion cells reconstructed
from multiple experiments
Thanks to our model, we could reconstruct the activity of a large population of neurons using only single cell activity. Since the model can generalize across experiments, it means that the activity of the different single cells can be taken from different experiments. Our method only needs a few pairs of neurons recorded simultaneously to fit the three parameters of the model. In the following we illustrate how this model can be used to reconstruct the activity from a very large population of neurons, bigger than what could be recorded experimentally. We illus-trate how this inference of the activity of a large population of cells can be useful by measuring synchronous activity over increasing number of cells.
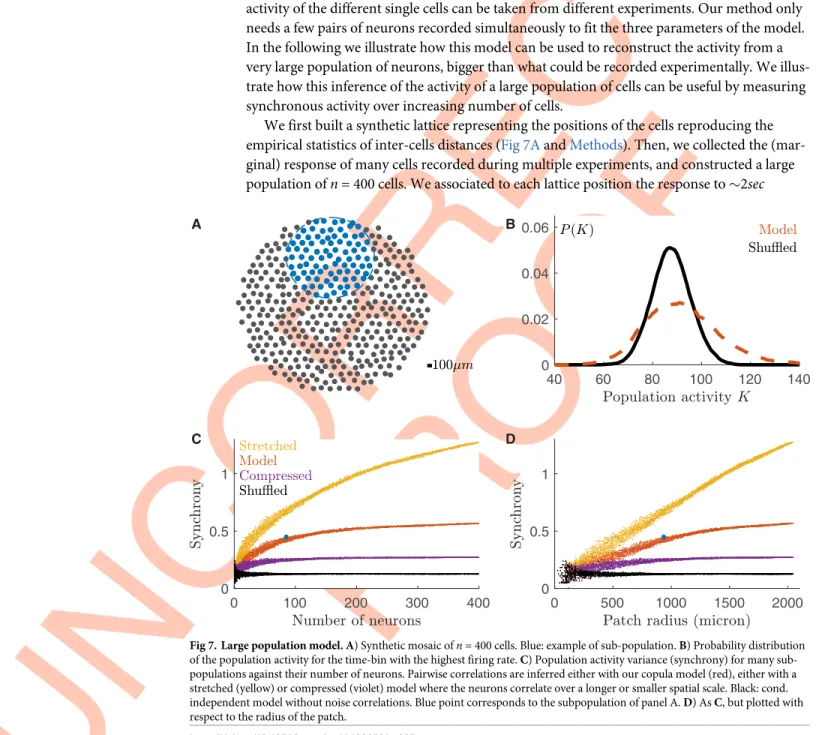
We first built a synthetic lattice representing the positions of the cells reproducing the empirical statistics of inter-cells distances (Fig 7AandMethods). Then, we collected the (mar-ginal) response of many cells recorded during multiple experiments, and constructed a large population ofn = 400 cells. We associated to each lattice position the response to �2sec
Fig 7. Large population model. A) Synthetic mosaic ofn = 400 cells. Blue: example of sub-population. B) Probability distribution of the population activity for the time-bin with the highest firing rate. C) Population activity variance (synchrony) for many sub-populations against their number of neurons. Pairwise correlations are inferred either with our copula model (red), either with a stretched (yellow) or compressed (violet) model where the neurons correlate over a longer or smaller spatial scale. Black: cond. independent model without noise correlations. Blue point corresponds to the subpopulation of panel A. D) As C, but plotted with respect to the radius of the patch.
checkerboard stimulation (repeated 79 times) of a randomly chosen cell among the ones recorded in all experiments (excluding those from the experiment used to learn the model parameters). Finally we applied our two-step approach to predict how this large population of cell would have responded to a checkerboard stimulus.
At first, we looked at the population rate as previously defined. In comparison with shuffled data, our model predicted a more frequent occurrence of transients with either very high or very low population activity (Fig 7B). This is a signature that synchronous activity extends up to large populations.
Then, to study how correlated firing grows with the population size, we sub-sampled the synthetic model and estimated the population synchrony. Note that in order to sub-sample the population, we did not choose neurons at random positions, but instead we randomly select a circle (by choosing a radius and a center location) and picked all the neurons within it (blue points in the example ofFig 7A). When enlarging the sub-population, new neurons are added at the border of the patch, and therefore can be very far from most of the others. Because in the data and in our model neurons are correlated only over finite distance (Figs1Dand5F), the impact of a newly added cell on the population synchrony will strongly depend on the size of the sub-population. In case of a small sub-population, the added neurons will correlate with most of the present cells, thus having a large impact on the population synchrony. In case of a large sub-population instead, the added neurons will correlate with only with the nearest cells in the sub-population, and the population synchrony will not increase by much. We therefore expected a saturation of the population synchrony. We defined the population synchrony as the average over time of the variance of the population rate, divided by the population size (similar to the magnetic susceptibility in physics):
Synchrony � 1 NhVarð X i nðitÞÞ itime¼ 1 N X ij Covnoiseðn ðtÞ i ;n ðtÞ j Þ ð1Þ
wherenðitÞis the spike count of neuroni at time t. AsEq 1shows (seeMethodsfor a derivation),
the population synchrony can be estimated as the sum of all pairwise noise-covariances. For a large population, and for a fixed neuroni, only the terms corresponding to the nearest neurons
will contribute to the summation inEq (1). As a consequence, when increasing the population size, most of the new pairwise terms will not contribute to the sum, and the synchrony satu-rates. This saturation size depends mostly on the correlation length of the system. Red points inFig 7C and 7Dshow that for our system this saturation happens at around 200 neurons, cor-responding to a patch of radius 1.5mm, larger than what is experimentally accessible for
syn-chronous recordings. To show how this saturation depends on the system correlation length, we repeated the same analysis after stretching (yellow points) or compressing (violet points) the copula parameter fit by a factor of two. The curve saturated later or before, respectively. When there is no noise correlation (shuffled data, black points), synchrony does not increase at all.
Discussion
We have shown that our new method allows for reconstructing the population activity of large populations of neurons of the same type in the retina, based on sequential recordings and a few pairwise recordings. We have first developed a model to predict noise correlations across experiments. Thanks to this, once the model parameters are learned with paired recordings, we can take any pair of cells taken from new experiments, and predict the noise correlations from the activity of each single cell. Thanks to this prediction we could then reconstruct the activity of large populations of neurons of a single type at a scale beyond what can be recorded PLOS COMPUTATIONAL BIOLOGY Predicting synchronous firing of large neural populations from sequential recordings
experimentally. Using this method, we have shown that synchrony in the population of rat OFF-alpha ganglion cells grows with the number of cells, becomes large and then saturates for very large populations. Understanding how the collective behaviour of neural ensembles scales with the number of neurons is a crucial issue, and our tool is a key method for this purpose, because it allows accurate inference of population activity, at a scale currently not accessible with experimental recordings.
Previous works have shown how different methods can be used to model and predict noise correlations. The Generalised Linear Model [15] uses spike history filters to couple the spiking activity between different neurons. Stimulus dependent maximum entropy models [34,35] have coupling terms to model synchronous activity between pairs of neurons. These models have been successfully used to model how a population of neurons responds to a stimulus ensemble. However, they were never used to predict the activity of a population across differ-ent experimdiffer-ents. A main obstacle for this is that firing rates can vary from experimdiffer-ents to experiments, which would induce parameter changes in most of these models, and make gen-eralization difficult. Here we have found that the noise correlation could be predicted using our model knowing just the distance between the two cells and their individual activity. Previ-ous attempts did not allow using information on the marginal distribution of the spiking activ-ity in the novel experiment. This flexibilactiv-ity is crucial in our method: our copula based model can include information of the marginal distributions straightforwardly, and this is one of its major advantages. Nevertheless, having a model that generalizes across experiments is crucial to pool together recordings from neurons of the same type and reconstruct activity of large neural ensembles.
On a broader perspective, our method can be included in the literature of attempts to pre-dict missing correlations in a dataset. Woher and collegues [36], for example, propose to pre-dict noise correlations as a function of stimulus correlations. Although this approach works for many stimulus ensembles, it will fail when, as in our elongated bar stimulations, stimulus correlations extend over large spacial scales, whereas noise correlations decrease sharply with distance (Fig 1). [37], instead, proposes to predict missing correlations when a large neural population is recorded through multiple measurements of overlapping patches. Yet, this method can not be applied easily to predict correlations in novel experiments. [38] recon-structs the trial-by-trial dynamics of large populations by extracting the common low-dimen-sional manifold. However this method also requires sequential but partially overlapping measurements, and thus suffers the same drawbacks. In a similar spirit, [39] assumes a com-mon low-dimensional dynamics to predict the missing correlations in a large population recorded through multiple experiments. However, they find that some overlap between the recorded population is necessary for the stitching to work, and this exclude the application across different experiments. [40] combines data from different experimental sessions to infer the properties of the common underlying dynamical system, and then predict latent variables states across different experiments. However, even if it shows that the trial-to-trial variability follows the same principles across different populations, it’s not used to predict the variability in novel experimental settings.
Our approach to model noise correlations is based on copula distributions, and assumes that the copula parameter is constant across experiments. An alternative, simpler approach could have been to assume that noise correlations themselves remain similar across experi-ments. We constructed this simpler model by fitting an exponential function over noise corre-lations in our training dataset. This approach, however, gave significantly worse results than our method based on copulas (supplementary sect.S4 Text), demonstrating that our approach captures non-trivial properties of the correlated firing, i.e. its dependence on the firing rate of each cell. Previous works have shown that this dependence cannot be ignored and plays a
major role in shaping the stimulus dependence of noise correlations [47]. Among the different proposed approaches, Dichotomized Gaussian, and their generalization to integer variables, have been shown to account with high precision for correlation patterns between spike counts [46]. In suppl. sect.S1 Textwe have shown that Dichotomized Gaussians are mathematically equivalent to Gaussian copulas. The only difference is the method usually applied to infer the parameters (moment matching against maximum log-likelihood). For our data, Gumbel cop-ula outperforms the Gaussian one (Fig 3), and therefore Dichotomized Gaussian. This result shows that with respect to previously proposed approaches, our copula based model provides an improvement in modeling noise correlations, and it is essential for the following steps of this work.
Remarkably, our description of noise correlation depends only on the physical distance between the pair. In suppl. sect.S2 Text, we have relaxed these assumptions and found that the copula parameter did not vary much with time, cell identity or stimulus. First, if we assume one copula parameter per time bin for a given pair of neurons, it varied little with time, and approached a constant value when the pairs’ firing rate were large enough. Second, when we inferred one parameter for each pair of cells to account for cell identities, their values still fol-lowed closely our parametric function. Finally, when we inferred copula parameters from the response to different stimulus ensembles, we obtained very similar values. This shows that the same copula distribution accounts well for the correlation between the two cells, indepen-dently of their firing rate, identities and of the stimulus ensemble.
Copulas have rarely been used in neuroscience studies [42–45,48–50], but none of them applied this method to predict noise correlations. In [42] and [44], discrete copula distribu-tions were used to model the total spike-count correlation in, respectively, motor and pre-frontal cortex neurons. However, they did not distinguish stimulus from noise correlations as we have done here.
Our ability to generalize across stimuli and experiments—with similar mean luminance and contrast, but different statistics—demonstrates that the couplings between the recorded ganglion cells are insensitive to the context and depend mostly on the retinal adaptation state. This means that these couplings reflect an intrinsic property of the retinal circuit, and that the mechanism generating these noise correlations in not influenced by changes in the stimulus statistics or in overall firing rate. Since the timescale of the observed noise correlations is very fast (few ms,Fig 1C), the most likely mechanism is gap junctions, which create direct electrical connections between ganglion cells [51,52]. Noise correlations might be more dependent on the context if they are generated by a shared noise source, e.g. the photoreceptor noise [53] or synaptic inputs [24]. Nevertheless, our results suggest that the strength of gap junctions are tuned to a value that seems preserved between different experiments—as long as mean lumi-nance and contrast are kept constant [52].
An interesting outcome of our method is the possibility to construct models of arbitrary large populations, as long as enough sequential recordings are available. This possibility opens for testing a number of hypotheses on how correlated firing affects the overall population activity. Previous studies [31,54] have made conjectures on the behavior of the retinal syn-chronous activity at large scale by extrapolating their results obtained upon sub-sampling the population of cells experimentally available. The validity of these extrapolations has been recently questioned [55], pointing out how the observed correlation pattern of small systems must be different from that of larger ones. In particular, [55] showed how sub-sampling a pop-ulation may introduce spurious correlations that differ from those of a large poppop-ulation. Here we took the opposite strategy: in order to avoid the risk of sub-sampling, we built a large popu-lation model (Fig 7) pooling together real data and using our validated model to infer noise correlations between cells. Importantly, our method kept the spatial structure of correlations PLOS COMPUTATIONAL BIOLOGY Predicting synchronous firing of large neural populations from sequential recordings
(spatial correlation scale), allowing for building realistic ganglion cells populations with the correct mosaic organisation. Our synthetic model thus provided the framework to further test the conjectures on the system’ behavior for large numbers of neurons, beyond what can be done experimentally.
We applied our method to the retina, where it is possible to have recordings of many neu-rons of the same type. In principle, our approach is general and could potentially be applied in other sensory area, provided that sequential recordings of the same type of cells are available, as well as some pairwise recordings to fit the model parameters. Further technological advances will make this method relevant to understand cortical populations, where it should be soon possible to define the cell type of each recorded cell using genetic (e.g. single cell tran-scriptomics [9,10]) and physiological (e.g. clustering of responses [7]) tools. One issue could arise if noise correlations depend strongly on behavioural states, arousal or attention. In this case pooling together multiple recordings from different states may lead to heterogenous data-sets that will not be well reproduced by our method. One step going in this direction has been made by [56], where correlations between cells appear correlated with the difference of their orientation preference, but only after conditioning on a state variable (in their case the global firing rate of the population). Computational approaches have also shown to be capable of accounting for these effects, for example by adding and learning anexternal modulator
net-work that introduces a gain factor depending on running speed and pupil dilation [57]. Another issue could arise if noise correlations strongly depend on the stimulus, as it has, for example, been reported for V1 [58]. In our data, noise correlations depend very little on the stimulus, which allowed us to reduce our model and let copula parameters depend only on the distance between cells. However, if noise correlations depend largely on the stimulus, the model can be extended. The simplest solution would be to make the copula parameters depend on the stimulus. If this stimulus dependence can be explicitly modeled, our method would still manage to predict the activity of large ensembles of neurons. In addition, our method is based on pairwise copulas and pairwise Maximum Entropy models, and for analysing cortical activ-ity, it might be necessary to account for higher order noise-correlations. In this case it will be necessary to extend our method with multivariate copulas [59] and higher order max-ent models [60].
Finally, here we predicted the responses of a population of neurons to a stimulus for which we have access to single cell responses across stimulus repetitions. If a model is available to pre-dict the responses of single cell to other stimuli, it could be used to prepre-dict the marginal proba-bility distribution of each individual neuron, and then combined with our approach to predict the activity of the whole population. This makes our method complementary to recent efforts trying to model and predict accurately the response of single neurons to complex stimuli in sensory areas [17,57,61].
Methods
Ethic statement
Animals were euthanized according to institutional guidelines in adherence with the Directive 2010/63/EU of the European Parliament, and approval was granted by the local ethical com-mittee (CETEA no5). Rats were sacrificed by CO2 inhalation followed by a quick cervical dislocation.
Multi-electrode array recordings
We analyze the response of rat RGCs to visual stimulation recorded in 9 multi-electrode array
withSpyKING CIRCUS [62]. This dataset and the experimental methods have been already previously described [18]. In one experiment we probed the retinal response to three different visual stimuli: (i) a random black and white checkerboard, with spatio-temporal uncorrelated checkers; (ii) a full-field stimulus with fluctuating luminance and (iii) two gray horizontal bars performing an independent Brownian motion along the vertical direction [18]. In the other 8 experimental sessions, only the response to random black and white checkerboard and full-field was retained and analyzed here. Each of these stimulations lasted about 10sec and have
been repeated at leastR = 79 times. Spiking times have been binned with a window of about
17ms, corresponding to a bin rate of 60Hz. With a custom algorithm [18] -similar to that of [7]- we used the cell’s response to the full-field stimulation to identify the type of the recorded RGCs. Across the 9 experiments, we identified populations of 20± 6 (mean ± s.d.) OFF-Alpha cells.
Stimulus and noise correlations
After binning the spiking response of each cell, we estimatenðit;rÞ, the number of emitted spikes
by celli, in the time-bin t, during repetition r, and its mean across repetitions mðtÞ
i . Then we
cal-culate the total covariance between two neurons (i, j) as follows: Covtotalðni;njÞ ¼ 1 T XT t¼1 1 R XR r¼1 ðnðit;rÞ miÞðn ðt;rÞ j mjÞ ð2Þ
Where mi ¼PTt¼1mðitÞ=T is the mean number of spikes across repetitions, and then averaged in
time. It is possible to decompose the total covariance into a sum of the so called “stimulus” and “noise” covariances. We calculated these quantities as follows
Covnoiseðni;njÞ ¼ 1 T XT t¼1 1 R XR r¼1 ðnðit;rÞ m ðtÞ i Þðn ðt;rÞ j m ðtÞ j Þ ð3Þ Covstimulusðni;njÞ ¼ 1 T XT t¼1 1 R XR r¼1 ðmðitÞ miÞðm ðtÞ j mjÞ ð4Þ
Noise correlations are then estimated as:
Corrnoiseðni;njÞ ¼
Covnoiseðni;njÞ
ffiffiffiffiffiffiffiffiffi
ViVj
p ð5Þ
whereVi=Covtotal(ni,ni).
Triplet noise correlations are instead defined as:
Corrnoiseðni;nj;nkÞ ¼ 1 T PT t¼1 1 R PR r¼1ðn ðtÞ i m ðtÞ i Þðn ðtÞ j m ðtÞ j Þðn ðtÞ k m ðtÞ k Þ ffiffiffiffiffiffiffiffiffiffiffiffiffiffi ViVjVk p ð6Þ
Copulas
Pairwise Copula-based modeling allows for disentangling the marginal distributions of two random variables from their mutual dependency, that can therefore be modeled alone, without the additional difficulties due to potentially complicated marginal distributions. Consider two random variablesX and Y, with joint distribution fX,Y, marginal distributionsfXandfYand
marginal cumulative density function (c.d.f.)FXandFYrespectively. By construction, the
random variablesUX�FX(X), X � fXandUY�FY(Y), Y � fYhave uniform distributions over
[0, 1]. Consequently the joint distribution of (UX,UY) has uniform marginals, yet it contains
all the information about the mutual dependence betweenX and Y. This property allows us to
model the dependency ofUXandUYinstead of that of X and Y. Specifically, a copula is the c.d.
f. of the joint variable (UX,UV), i.e. a functionC(�, �): [0, 1]2! [0, 1]. and it can be used to
reconstruct the joint distribution of (X, Y), via its c.d.f.:
FX;Yðx; yÞ ¼ CðFXðxÞ; FYðyÞÞ: ð7Þ
Sklar’s theorem (supplementary sect.S1b Text) ensures the existence and uniqueness ofC, and
this allows for modeling the mutual dependency betweenX and Y, independently from their
marginal distributions. Note that when copulas are used to model discrete variables such as our spike counts, Sklar’s theorem still assures the existence of the copula, but its uniqueness is lost. However this is enough to model discrete joint distribution with copulas (suppl. sect.
S1c Text).
Parametric copula families
In this work we have considered the following parametric bivariate copula families: • Gumbel:
CGumbelðu; vjyÞ ¼ exp ð ðlog uÞyþ ðlog vÞyÞ1=y�; ð8Þ whereθ 2 [1, 1] is the copula parameter.
• Gaussian:
CGaussianðu; vjyÞ ¼ FyðF 1
ðuÞ; F 1ðvÞÞ; ð9Þ whereθ 2 [−1, 1] is the copula parameter, and Fθis the joint cumulative distribution
func-tion of a multivariate normal with unit variance and covariance equal toθ. F is the
cumula-tive of a standard normal distribution. • Frank: CFrankðu; vjyÞ ¼ y 1 log ð1 þðe yu 1Þðe yv 1Þ e y 1 Þ; ð10Þ where y 2R is the copula parameter.
• Clayton:
CClaytonðu; vjyÞ ¼ ½maxfu
yþv y 1; 0g� 1=y
; ð11Þ
whereθ 2 [−1, 1]/{0} is the copula parameter.
• Independent:
CIndependentðu; vÞ ¼ uv; ð12Þ
We have inferred all the parameter values by log-likelihood maximization (suppl. sect.S2 Text). Onceθ has been inferred, the marginal distributions can in turn be approximated either
section, the literature and textbooks (see, for example, [41]) for more explanations and details on copula models and/or other copula families.
Copula-based model
We constructed a copula model able to predictPðnðitÞ;n
ðtÞ
j Þ, the joint distribution of pair of
spike counts in time:
PðfnðitÞ;n ðtÞ j g T t¼1Þ ¼ YT t¼1 cGumbel FðitÞðn ðtÞ i Þ;F ðtÞ j ðn ðtÞ j Þ � � ^yðd ijÞ � ; ð13Þ
wherecGumbelis the copula density function, corresponding to the c.d.f. ofEq (8), andF ðtÞ i ðn
ðtÞ i Þ
is theempirical c.d.f. of nðitÞ, that we estimate across repetitions,dijis the distance between
neuronsi and j, and ^yðdijÞ is a parametric function: ^yðdÞ ¼ expð expða þ bd þ cd
2Þ Þ and ^
yðdÞ ¼ 0 if d > 1mm. To infer this function from data, we first inferred a copula parameter
for each pair of neurons,θij, by log-likelihood maximization, and then we obtaineda = 0.73,
b = −0.014μm−1andc = 810−6μm−2by fitting the behavior ofθijwith respect to the distance
dij. See suppl. sect.S2 Textfor further information.
Time-dependent maximum entropy model
The time-dependent maximum entropy model we used is:
PðffnðitÞgÞ N i¼1g T t¼1Þ ¼ YT t¼1 exp X i hðitÞn ðtÞ i þ X i�j nðitÞJijn ðtÞ j X i lnðnðitÞ!Þ ( ) =ZðtÞ ! ð14Þ
wherenðitÞ2 ½0; 1; . . . ;nMax� is an integer spike-count, withn
Max
matched from data. The index “(t)” expresses the time dependence.Z(t)is a normalization constant (the partition function).
hðitÞis the local field for neuroni at time t imposing the firing probability and Jijis the couplings
network that allows for reproducing the system’s correlations. Note thatJijdoes not depend on
time and it includes also the diagonal termsJiiwhich set each neurons variance equal to its
empirical value [35,63]. The log-factorial term allows for matching the single neurons statistics [63], as by takingJ = 0 the model reduces to a collection of independent Poisson distributions.
Inference of the time-dependent maximum entropy model
The inference of the model (14) is done by log-likelihood maximization using an iterative algo-rithm with adaptive learning rate similar to that of [64]. Because the model belongs to the exponential family, the log-likelihood derivative with respect to any parameterθitakes the
form: hOiidata− hOiimodel, whereOiis the sufficient statistics conjugated to the parameterθi.
As a consequence, the model inference requires only the first two moments ofnðtÞ
i across
repe-titions and the value of the noise covariances (Methodssection c). In our case we estimate the firsts from the marginal response of each neurons and we used the copula model to predict the second, without any other empirical information or statistics.
Synthetic lattice
In order to construct a synthetic lattice that respects the inter-cells distance of empirical recordings, we started by a triangular regular lattice with side 194μm, and then we added a
Gaussian noise with a standard deviation of 22μm to the x and y coordinate of each cells.
These parameters are optimized in order to match the distribution of cells distances measured in real experimental recordings.
Synchrony as the population activity variance
We computed the population activity at timet as the sum over all the neurons of their
spike-counts,KðtÞ�P in
ðtÞ
i . We then defined the population synchrony as the average over time of
the variance ofK(t). It follows:
Synchrony � 1 NhVarðK ðtÞÞ i time¼ 1 NhVarð X i nðitÞÞ itime ¼ 1 N X ij hCovðnðitÞ;n ðtÞ j Þitime¼ 1 N X ij Covnoiseðn ðtÞ i ;n ðtÞ j Þ ð15Þ
Supporting information
S1 Text. Supplementary mathematics.(PDF)
S2 Text. Supplementary information: Model construction.
(PDF)
S3 Text. Supplementary information: Time-bin dependence.
(PDF)
S4 Text. Supplementary information: Simplest model for noise correlations.
(PDF)
Acknowledgments
We like to thank M. Chalk and G. Tkacik for useful discussions.
Author Contributions
Conceptualization: Olivier Marre, Ulisse Ferrari.
Data curation: Oleksandr Sorochynskyi, Ste´phane Deny, Olivier Marre, Ulisse Ferrari. Formal analysis: Oleksandr Sorochynskyi, Ulisse Ferrari.
Funding acquisition: Olivier Marre.
Investigation: Oleksandr Sorochynskyi, Ste´phane Deny, Ulisse Ferrari. Methodology: Oleksandr Sorochynskyi, Ulisse Ferrari.
Project administration: Olivier Marre, Ulisse Ferrari. Software: Oleksandr Sorochynskyi.
Supervision: Ulisse Ferrari.
Validation: Olivier Marre, Ulisse Ferrari. Visualization: Olivier Marre, Ulisse Ferrari.
Writing – review & editing: Ste´phane Deny, Olivier Marre, Ulisse Ferrari.
References
1. Buza´ki G. Large-scale recording of neuronal ensembles. Nat Neurosci. 2004; 7(5):446–51.https://doi. org/10.1038/nn1233
2. Packer AM, Russell LE, Dalgleish HW, Ha¨ usser M. Simultaneous all-optical manipulation and recording of neural circuit activity with cellular resolution in vivo. Nature methods. 2014; 12(2):140.https://doi.org/
10.1038/nmeth.3217PMID:25532138
3. Marre O, Amodei D, Deshmukh N, Sadeghi K, Soo F, Holy T, et al. Recording of a large and complete population in the retina. Journal of Neuroscience. 2012; 32(43):1485973.
4. Turaga D, Holy TE. Organization of vomeronasal sensory coding revealed by fast volumetric calcium imaging. Journal of Neuroscience. 2012; 32(5):1612–1621.
https://doi.org/10.1523/JNEUROSCI.5339-11.2012PMID:22302803
5. Vlasits AL, Euler T, Franke K. Function first: classifying cell types and circuits of the retina. Current opin-ion in neurobiology. 2019; 56:8–15.https://doi.org/10.1016/j.conb.2018.10.011PMID:30447507
6. Farrow K, Masland RH. Physiological clustering of visual channels in the mouse retina. American Jour-nal of Physiology-Heart and Circulatory Physiology. 2011;.https://doi.org/10.1152/jn.00331.2010
PMID:21273316
7. Baden T, Berens P, Franke K, Rosòn MR, Bethge M, Euler T. The functional diversity of retinal ganglion cells in the mouse. Nature. 2016; 529:345–50.https://doi.org/10.1038/nature16468PMID:26735013
8. Spampinato GLB, Ronzitti E, Zampini V, Ferrari U, Trapani F, Khabou H, et al. All-optical interrogation of a direction selective retinal circuit by holographic wave front shaping. bioRxiv. 2019; p. 513192. 9. Economo MN, Viswanathan S, Tasic B, Bas E, Winnubst J, Menon V, et al. Distinct descending motor
cortex pathways and their roles in movement. Nature. 2018; 563(7729):79.https://doi.org/10.1038/
s41586-018-0642-9PMID:30382200
10. Kim MH, Znamenskiy P, Iacaruso MF, Mrsic-Flogel TD. Segregated Subnetworks of Intracortical Pro-jection Neurons in Primary Visual Cortex. Neuron. 2018; 100(6):1313–1321.https://doi.org/10.1016/j.
neuron.2018.10.023PMID:30415996
11. da Silveira RA, Roska B. Cell types, circuits, computation. Current opinion in neurobiology. 2011; 21 (5):664–671.https://doi.org/10.1016/j.conb.2011.05.007
12. Shekhar K, Lapan SW, Whitney IE, Tran NM, Macosko EZ, Kowalczyk M, et al. Comprehensive classifi-cation of retinal bipolar neurons by single-cell transcriptomics. Cell. 2016; 166(5):1308–1323.https://
doi.org/10.1016/j.cell.2016.07.054PMID:27565351
13. Jiang X, Shen S, Cadwell CR, Berens P, Sinz F, Ecker AS, et al. Principles of connectivity among mor-phologically defined cell types in adult neocortex. Science. 2015; 350(6264):aac9462.https://doi.org/
10.1126/science.aac9462PMID:26612957
14. Chichilnisky EJ. A simple white noise analysis of neuronal light responses. Network: Computation in Neural Systems. 2001; 12(2):199–213. PMID:11405422
15. Pillow JW, Shlens J, Paninski L, Sher A, Litke AM, Chichilnisky EJ, et al. Spatio-temporal correlations and visual signalling in a complete neuronal population. Nature. 2008; 454:995–999.https://doi.org/10.
1038/nature07140PMID:18650810
16. McFarland JM, Cui Y, Butts DA. Inferring nonlinear neuronal computation based on physiologically plausible inputs. PLoS Comput Biol. 2013; 9(7):e1003143.https://doi.org/10.1371/journal.pcbi.
1003143PMID:23874185
17. McIntosh L, Maheswaranathan N, Nayebi A, Ganguli S, Baccus S. Deep learning models of the retinal response to natural scenes. In: Advances in Neural Information Processing Systems; 2016. p. 1361– 1369.
18. Deny S, Ferrari U, Mace E, Yger P, Caplette R, Picaud S, et al. Multiplexed computations in retinal gan-glion cells of a single type. Nature communications. 2017; 8(1):1964.
https://doi.org/10.1038/s41467-017-02159-yPMID:29213097
19. Aertsen A, Johannesma PI, Hermes D. Spectro-temporal receptive fields of auditory neurons in the grassfrog. Biological Cybernetics. 1980; 38(4):235–248.https://doi.org/10.1007/BF00337015
20. Sahani M, Linden JF. How linear are auditory cortical responses? In: Advances in neural information processing systems; 2003. p. 125–132.
21. David SV, Vinje WE, Gallant JL. Natural stimulus statistics alter the receptive field structure of v1 neu-rons. Journal of Neuroscience. 2004; 24(31):6991–7006.
https://doi.org/10.1523/JNEUROSCI.1422-04.2004PMID:15295035
22. Mu¨nch TA, Da Silveira RA, Siegert S, Viney TJ, Awatramani GB, Roska B. Approach sensitivity in the retina processed by a multifunctional neural circuit. Nature neuroscience. 2009; 12(10):1308.https://
doi.org/10.1038/nn.2389PMID:19734895
23. Schneidman E, Bialek W, Berry MJ. Synergy, redundancy, and independence in population codes. Journal of Neuroscience. 2003; 23(37):11539–11553.
https://doi.org/10.1523/JNEUROSCI.23-37-11539.2003PMID:14684857
24. Trong PK, Rieke F. Origin of correlated activity between parasol retinal ganglion cells. Nature neurosci-ence. 2008; 11(11):1343–1351.https://doi.org/10.1038/nn.2199PMID:18820692
25. Shlens J, Rieke F, Chichilnisky EJ. Synchronized firing in the retina. Current opinion in neurobiology. 2008; 18(4):396–402.https://doi.org/10.1016/j.conb.2008.09.010PMID:18832034
26. Greschner M, Shlens J, Bakolitsa C, Field GD, Gauthier JL, Jepson LH, et al. Correlated firing among major ganglion cell types in primate retina. The Journal of Physiology. 2011; 589(1):75–86. PMID:
20921200
27. Lyamzin DR, Barnes SJ, Donato R, Garcia-Lazaro JA, Keck T, Lesica NA. Nonlinear transfer of signal and noise correlations in cortical networks. Journal of Neuroscience. 2015; 35(21):8065–8080.https://
doi.org/10.1523/JNEUROSCI.4738-14.2015PMID:26019325
28. Pitkow X, Meister M. Decorrelation and efficient coding by retinal ganglion cells. Nat Neurosci. 2012; 15 (4):628–635.https://doi.org/10.1038/nn.3064PMID:22406548
29. Franke F, Fiscella M, Sevelev M, Roska B, Hierlemann A, da Silveira RA. Structures of neural correla-tion and how they favor coding. Neuron. 2016; 89(2):409–422.https://doi.org/10.1016/j.neuron.2015.
12.037PMID:26796692
30. Shlens J, Field GD, Gauthier JL, Grivich MI, Petrusca D, Sher A, et al. The structure of multi-neuron fir-ing patterns in primate retina. Journal of Neuroscience. 2006; 26(32):8254–8266.https://doi.org/10.
1523/JNEUROSCI.1282-06.2006PMID:16899720
31. Schneidman E, Berry M, Segev R, Bialek W. Weak pairwise correlations imply strongly correlated net-work states in a population. Nature. 2006; 440:1007.https://doi.org/10.1038/nature04701PMID:
16625187
32. Shlens J, Field GD, Gauthier JL, Greschner M, Sher A, Litke AM, et al. The structure of large-scale syn-chronized firing in primate retina. Journal of Neuroscience. 2009; 29(15):5022–5031.https://doi.org/10.
1523/JNEUROSCI.5187-08.2009PMID:19369571
33. Shimazaki H, Amari Si, Brown EN, Gru¨n S. State-space analysis of time-varying higher-order spike cor-relation for multiple neural spike train data. PLoS computational biology. 2012; 8(3):e1002385.https://
doi.org/10.1371/journal.pcbi.1002385PMID:22412358
34. Granot-Atedgi E, Tkacik G, Segev R, Schneidman E. Stimulus-dependent Maximum Entropy Models of Neural Population Codes. PLOS Computational Biology. 2013; 9(3):1–14.https://doi.org/10.1371/
journal.pcbi.1002922PMID:23516339
35. Ferrari U, Deny S, Chalk M, Tkačik G, Marre O, Mora T. Separating intrinsic interactions from extrinsic correlations in a network of sensory neurons. Physical Review E. 2018; 98(4):042410.https://doi.org/ 10.1103/PhysRevE.98.042410
36. Wohrer A, Romo R, Machens CK. Linear readout from a neural population with partial correlation data. In: Advances in Neural Information Processing Systems; 2010. p. 2469–2477.
37. Bishop WE, Byron MY. Deterministic symmetric positive semidefinite matrix completion. In: Advances in Neural Information Processing Systems; 2014. p. 2762–2770.
38. Nonnenmacher M, Turaga SC, Macke JH. Extracting low-dimensional dynamics from multiple large-scale neural population recordings by learning to predict correlations. In: Advances in Neural Informa-tion Processing Systems; 2017. p. 5702–5712.
39. Turaga S, Buesing L, Packer AM, Dalgleish H, Pettit N, Hausser M, et al. Inferring neural population dynamics from multiple partial recordings of the same neural circuit. In: Advances in Neural Information Processing Systems; 2013. p. 539–547.
40. Pandarinath C, O?Shea DJ, Collins J, Jozefowicz R, Stavisky SD, Kao JC, et al. Inferring single-trial neural population dynamics using sequential auto-encoders. Nature methods. 2018; 15(10):805–815.
https://doi.org/10.1038/s41592-018-0109-9PMID:30224673
41. Trivedi PK, Zimmer DM, et al. Copula modeling: an introduction for practitioners. Foundations and Trends in Econometrics. 2007; 1(1):1–111.https://doi.org/10.1561/0800000005
42. Berkes P, Wood F, Pillow JW. Characterizing neural dependencies with copula models. In: Advances in neural information processing systems; 2009. p. 129–136.
43. Onken A, Gru¨ newa¨lder S, Munk M, Obermayer K. Modeling short-term noise dependence of spike counts in macaque prefrontal cortex. In: Advances in neural information processing systems; 2009. p. 1233–1240.
44. Onken A, Gru¨ newa¨lder S, Munk MH, Obermayer K. Analyzing short-term noise dependencies of spike-counts in macaque prefrontal cortex using copulas and the flashlight transformation. PLoS computa-tional biology. 2009; 5(11):e1000577.https://doi.org/10.1371/journal.pcbi.1000577PMID:19956759
45. Safaai H, Onken A, Harvey CD, Panzeri S. Information estimation using nonparametric copulas. Physi-cal Review E. 2018; 98(5):053302.https://doi.org/10.1103/PhysRevE.98.053302PMID:30984901
46. Macke JH, Berens P, Ecker AS, Tolias AS, Bethge M. Generating spike trains with specified correlation coefficients. Neural computation. 2009; 21(2):397–423.https://doi.org/10.1162/neco.2008.02-08-713
PMID:19196233
47. De La Rocha J, Doiron B, Shea-Brown E, JosićK, Reyes A. Correlation between neural spike trains increases with firing rate. Nature. 2007; 448(7155):802.https://doi.org/10.1038/nature06028PMID:
17700699
48. Sacerdote L, Tamborrino M, Zucca C. Detecting dependencies between spike trains of pairs of neurons through copulas. Brain research. 2012; 1434:243–256.https://doi.org/10.1016/j.brainres.2011.08.064
PMID:21981802
49. Onken A, Panzeri S. Mixed vine copulas as joint models of spike counts and local field potentials. In: Advances in Neural Information Processing Systems; 2016. p. 1325–1333.
50. Wang S, Borst A, Zaslavsky N, Tishby N, Segev I. Efficient encoding of motion is mediated by gap junc-tions in the fly visual system. PLoS computational biology. 2017; 13(12):e1005846.https://doi.org/10.
1371/journal.pcbi.1005846PMID:29206224
51. Hidaka S, Akahori Y, Kurosawa Y. Dendrodendritic electrical synapses between mammalian retinal ganglion cells. Journal of Neuroscience. 2004; 24(46):10553–10567.https://doi.org/10.1523/
JNEUROSCI.3319-04.2004PMID:15548670
52. Bloomfield SA, Vo¨lgyi B. The diverse functional roles and regulation of neuronal gap junctions in the ret-ina. Nature Reviews Neuroscience. 2009; 10(7):495.https://doi.org/10.1038/nrn2636PMID:19491906
53. Ala-Laurila P, Greschner M, Chichilnisky EJ, Rieke F. Cone photoreceptor contributions to noise and correlations in the retinal output. Nature neuroscience. 2011; 14(10):1309–1316.https://doi.org/10.
1038/nn.2927PMID:21926983
54. Tkacik G, Marre O, Amodei D, Schneidman E, Bialek W, J BM. Searching for collective behaviour in a network of real neurons. PloS Comput Biol. 2014; 10(1):e1003408.https://doi.org/10.1371/journal.pcbi.
1003408PMID:24391485
55. Nonnenmacher M, Behrens C, Berens P, Bethge M, Macke JH. Signatures of criticality arise from ran-dom subsampling in simple population models. PLoS Computational Biology. 2017; 13(10):e1005718.
https://doi.org/10.1371/journal.pcbi.1005718PMID:28972970
56. Okun M, Steinmetz NA, Cossell, et al. Diverse coupling of neurons to populations in sensory cortex. Nature. 2015; 521(7553):511–515.https://doi.org/10.1038/nature14273PMID:25849776
57. Cadena SA, Denfield GH, Walker EY, Gatys LA, Tolias AS, Bethge M, et al. Deep convolutional models improve predictions of macaque V1 responses to natural images. BioRxiv. 2018; p. 201764.
58. Ba´nyai M, Lazar A, Klein L, Klon-Lipok J, Stippinger M, Singer W, et al. Stimulus complexity shapes response correlations in primary visual cortex. Proceedings of the National Academy of Sciences. 2019; p. 201816766.https://doi.org/10.1073/pnas.1816766116PMID:30692266
59. Nikoloulopoulos AK. Copula-based models for multivariate discrete response data. In: Copulae in Math-ematical and Quantitative Finance. Springer; 2013. p. 231–249.
60. Ganmor E, Segev R, Schneidman E. Sparse low-order interaction network underlies a highly correlated and learnable neural population code. PNAS. 2011; 108:9679–9684.https://doi.org/10.1073/pnas.
1019641108PMID:21602497
61. Yamins DLK, DiCarlo JJ. Using goal-driven deep learning models to understand sensory cortex. Nature neuroscience. 2016; 19(3):356–365.https://doi.org/10.1038/nn.4244PMID:26906502
62. Yger P, Spampinato GL, Esposito E, Lefebvre B, Deny S, Gardella C, et al. A spike sorting toolbox for up to thousands of electrodes validated with ground truth recordings in vitro and in vivo. ELife. 2018; 7: e34518.https://doi.org/10.7554/eLife.34518PMID:29557782
63. Ferrari U, Deny S, Marre O, Mora T. A simple model for low variability in neural spike trains. Neural Computation. 2018; 30(11).https://doi.org/10.1162/neco_a_01125PMID:30148708
64. Ferrari U. Learning maximum entropy models from finite-size data sets: A fast data-driven algorithm allows sampling from the posterior distribution. Phys Rev E. 2016; 94:023301.https://doi.org/10.1103/
PhysRevE.94.023301PMID:27627406