HAL Id: hal-02401446
https://hal.uca.fr/hal-02401446
Submitted on 10 Dec 2019
HAL is a multi-disciplinary open access
archive for the deposit and dissemination of
sci-entific research documents, whether they are
pub-lished or not. The documents may come from
teaching and research institutions in France or
abroad, or from public or private research centers.
L’archive ouverte pluridisciplinaire HAL, est
destinée au dépôt et à la diffusion de documents
scientifiques de niveau recherche, publiés ou non,
émanant des établissements d’enseignement et de
recherche français ou étrangers, des laboratoires
publics ou privés.
Budgets: The Case of Vulcano Fossa 2000–2019
Stefano Mannini, Andrew Harris, David Jessop, Magdalena Oryaëlle Chevrel,
Michael Ramsey
To cite this version:
Stefano Mannini, Andrew Harris, David Jessop, Magdalena Oryaëlle Chevrel, Michael Ramsey.
Com-bining Ground- and ASTER-Based Thermal Measurements to Constrain Fumarole Field Heat Budgets:
The Case of Vulcano Fossa 2000–2019. Geophysical Research Letters, American Geophysical Union,
2019, 46 (21), pp.11868-11877. �10.1029/2019GL084013�. �hal-02401446�
Combining Ground
‐ and ASTER‐Based Thermal
Measurements to Constrain Fumarole Field
Heat Budgets: The Case of Vulcano
Fossa 2000
–2019
Stefano Mannini1,2 , Andrew J. L. Harris1, David E. Jessop1,3 , Magdalena Oryaëlle Chevrel1 , and Michael S. Ramsey4
1Université Clermont Auvergne, CNRS, IRD, OPGC, Laboratoire Magmas et Volcans, Clermont‐Ferrand, France,2Now at
Department of Earth Sciences, University of Geneva, Geneva, Switzerland,3Observatoire Volcanologique et Sismologique
de Guadeloupe (OVSG), IPGP, UMR 7154, CNRS, Le Houëlmont, 97113 Gourbeyre, Guadeloupe, France,4Department of Geology and Environmental Science, University of Pittsburgh, Pittsburgh, PA, USA
Abstract
Vulcano Fossa's fumarolefield (Italy) has been active for more than a century and has become a well‐studied benchmark for fumarolic degassing, often being considered the “model” hydrothermal system. Satellite thermal monitoring is increasingly being used to monitor such systems, so we here use Vulcano to test a new method for assessing heatflux at such systems. Our methodology involves converting ground‐based vent temperature measurements to heat fluxes emitted by the fumaroles, with the diffuse heat flux obtained from satellite‐sensor (in our case Advanced Spaceborne Thermal Emission and Reflection Radiometer) data. While diffuse heat losses were typically 9 MW, vent heat losses were 1 MW. The average totalflux of 10 MW over the 19‐year period of study places Vulcano in the top 20 most active hydrothermal systems globally. This work highlights the value of high spatial resolution infrared satellite data in building thermal inventories for persistently active hydrothermal systems.Plain Language Summary
Hydrothermal systems are the most ubiquitous and strongest emitters of heat by volcanoes worldwide. But these emissions are very poorly constrained; indeed, they are very difficult to measure so that we have data for only a few of the many active systems worldwide. We here present a method to obtain this value for all global hydrothermal systems. By way of case study, we apply the method to the Vulcano Fossa hydrothermal system in Italy so as to obtain an inventory over the last 20 years (with the last data point coming from May 2019) at this frequently visited tourist site. Our approach represents a globally applicable heatflux model that can be used to track the thermal evolution of hazardous volcanic systems on a time scales of tens of years.1. Introduction
The term“hydrothermal” was introduced by Lloyd (1959) to denote eruptions driven by the rapid expansion of heated water to cause an explosion without the involvement of fresh magma. Later, this term was adopted to define a “hydrothermal system” as a groundwater system in a volcanic environment that has an area of recharge, an area of discharge, and a heat source (Sigurdsson et al., 2015). Hydrothermalfluid circulation in such a system involves significant energy exchanges between the magma source and the surface (e.g., Chiodini et al., 2005; Harvey et al., 2015; Italiano et al., 1984). Gas and heat emissions from a hydrothermal system are the direct result of ascent of magmatic heat and volatiles into a mixing zone where marine and/or meteoricfluids enter the system to define the chemical and isotopic composition of emitted gases (e.g., Capasso et al., 1997; Chiodini et al., 1993; Italiano & Nuccio, 1992). We here focus on the thermal aspect, where heat transfer to the surface is controlled by the conductivity and permeability of the overlying rock (e.g., Aubert et al., 2008; Hardee, 1982; Harris et al., 2012), as well as heat of condensation andfluid flow to the surface (Chiodini et al., 2005; Harris, 2013). At a fumarolefield, heat is then released from two sources. Thefirst flux is from a large number of relatively high temperature open vents and fractures (fumaroles) dis-tributed across thefield (Harris et al., 2009; Harris & Maciejewski, 2000; Matsushima et al., 2003). At such open pathways, vent temperatures have been shown to correlate withfluid (gas) flux passing through the pipe and out of the vent (Harris & Stevenson, 1997; Stevenson, 1993), higherfluxes heating the vent walls ©2019. American Geophysical Union.
All Rights Reserved.
RESEARCH LETTER
10.1029/2019GL084013
Key Points:
• We validate a methodology to allow global assessments of heatflux at hydrothermal systems • Vent heat flux is estimated using
typical area for high‐, moderate‐, and low‐temperature fumaroles • Heat loss from diffuse soil heating (9
MW) is far greater than from fumaroles (1 MW) Supporting Information: • Supporting Information S1 Correspondence to: S. Mannini, stefano.mannini@unige.ch Citation:
Mannini, S., Harris, A. J. L., Jessop, D. E., Chevrel, M. O., & Ramsey, M. S. (2019). Combining ground‐ and ASTER‐based thermal measurements to constrain fumarolefield heat budgets: The case of Vulcano Fossa 2000‐2019. Geophysical Research Letters, 46. https://doi.org/10.1029/ 2019GL084013
Received 18 JUN 2019 Accepted 23 SEP 2019
to higher temperatures (Branan et al., 2008; Harris & Ripepe, 2007). At Vulcano, simultaneous thermocouple measurements of the gas exiting the vent and radiometer measurements of the vent wall temperature have shown that the wall is heated to the same temperature as the gas, both of which change with the gas flux (Harris, 2013). The second flux is diffuse in nature and involves a broader zone of pervasive heating across which a low‐temperature thermal anomaly develops (Chiodini et al., 2005), and is also termed diffuse soil degassing (e.g., Allard et al., 1991; Baubron et al., 1990; Chiodini et al., 2004; Finizola et al., 2006). This forms due to vertical convective and conductive heat transfer across, following the terminology of Straatman et al. (1993), a heat chimney that extends between the source and the surface (Aubert et al., 2008; Hardee, 1982) and through which heat is transported (Harris, 2013). Although the data of Chiodini et al. (2005) suggest that heat lost by the diffuse mechanisms dominates heat loss at hydrothermal systems, the partitioning between the vent and diffuse heat losses is currently not known. Our objective is, thus, to simultaneously quantify thesefluxes and address this question. Globally, there are a huge number of passively degassing hydrothermal systems. They do not fuel eruptive activity yet emit 90–99% of the total volatiles discharged from volcanoes (Sigurdsson et al., 2015) and, poten-tially, account for a large part of the energyflux at active volcanic systems (cf. Chiodini et al., 2005; Harvey et al., 2015). Although constraining energyfluxes at such systems are of vital importance in assessing volcanic energy budgets and the environmental impacts of volcanic systems on both local and global scales, heat fluxes at many hydrothermal systems remain very poorly constrained—as is apparent from various global volcanic energy and mass budget inventories that tend not to include such systems (e.g., Crisp, 1984; Hédervári, 1963; Wright, 2016; Wright et al., 2004). This is mainly due to the fact that such systems are often widely dispersed over difficult terrain where, as described above, the heat transfer processes (and vent areas) are multiple and complex. In addition, high temperatures and gasfluxes at more active systems may preclude
Figure 1. (a) Orthophotomosaic of Vulcano Fossa (see Favalli et al., 2018, for details of acquisition and image processing) showing the zone of active fumaroles within which vent temperature measurements were made (delimited by a black dash line). White dashed line is the boundary of the diffuse heated zone; yellow line represents soil transect (A–B) measurements to define ΔT and hc; black dots represent sampled fumaroles. (b) Location of Vulcano Island within the
safe approach for in situ sampling. They are thus ideally suited for measurement by remote sensing techni-ques. Hence, we here aim to define and constrain a hydrothermal energy budget in a manner that allows par-titioning between both the fumarolic and diffuse sources. To do this, we use both ground‐ and satellite‐based thermal remote sensing methods aimed at obtaining the area and temperature of associated thermal anoma-lies, which then allow radiative and convective heat losses to be assessed. Our aim is to provide and validate a simple method to include diffuse heatfluxes from hydrothermal systems in global energy budget inventories. Our test target for this case study is the Fossa di Vulcano fumarolefield (Vulcano Island, Italy), a system for which much ground‐truth data is available (Giustolisi & De Oliveira, 2005). For this target we validate the methodologies designed to estimate each component of the heatflux system and then complete a heat loss inventory for the period 2000–2019 that considers partitioning between the fumarolic and diffuse heat flux.
1.1. Hydrothermal System at Vulcano
The island of Vulcano forms part of the Aeolian Islands volcanic arc. The last eruption, which occurred in 1888–1890, now defines the “vulcanian” type of eruption (Mercalli, 1907). Shortly after the 1888–1890 erup-tion, which caused temporary abandonment of the island (Stevenson, 2007), a new fumarolefield estab-lished (Sicardi, 1940). Temperatures showed variation throughout the twentieth century, with significant increases occurring during 1913–1923 and 1990–1996, when temperatures reached maxima of 560 °C (Sicardi, 1940) and 650–690 °C (Barberi et al., 1994; Capasso et al., 1994; Chiodini et al., 1995), respectively. The temperature increases of 1990–1996 also coincided with an increase in the degassing field surface area as documented by Bukumirovic et al. (1996, 1997), causing fumarolic activity to expand into previously inactive zones (Harris & Maciejewski, 2000). This, coupled with an increasingly magmatic isotopic signature (Capasso et al., 1997), was defined as a magmatic “crisis” (Granieri et al., 2006). Since 2000, however, max-imum temperatures have declined to typical values of around 360–430 °C (Harris et al., 2012).
In terms of heatflux, two zones can be identified (Figure 1), a broad zone of pervasive surface heating (named the diffuseflux zone), with an area of up to 415 000 m2, within whichfive main areas of fumarolic activity are clustered (Chiodini et al., 2005; Harris et al., 2009) and a zone of fumarolic venting (named the ventflux zone) characterized by low‐, medium‐, and high‐temperature fumaroles (Harris & Maciejewski, 2000). The zone of diffuse heat loss is characterized by gray, heated surfaces at Tdiffusesurrounded by red
sur-faces at ambient temperatures, Tambient(Figure 1). The difference between these two surfaces generates a
low‐magnitude thermal anomaly (ΔT = Tdiffuse− Tambient). Within 1 m below the surface, the diffuse zone
is characterized by a higher geothermal gradient, where the thermal vertical gradient (dT/dz) can reach 50–135 K/m (Aubert et al., 2008).
Within the ventflux zone, low‐temperature fumaroles are characterized by scattered millimeter‐wide vents and temperatures less than 150 °C. Moderate‐temperature fumaroles are typically concentrated in 0.1‐ to 0.5‐m‐deep pits typically a 1–3 m across, with temperatures in the 150–250 °C range. Finally, high‐temperature fumaroles involve broad zones (1–2 m across) of gray, sulfur‐free rubble, where vent tem-peratures exceed 250 °C (Harris & Maciejewski, 2000). Although Harris et al. (2012) and Harris and Maciejewski (2000) give vent temperature statistics for the period 1994–2010 for these zones, heat fluxes were not estimated, as no method was available to allow conversion between the sample set of vent tempera-tures and total heatflux from all vents. This is thus one of our objectives here: to develop (and validate) a method to convert the temperature statistics to total vent‐leaving heat flux.
Diliberto (2017) also gave time series of soil temperature in diffuse heated zones for 1991 to 2016 but again did not convert to heatflux. While Chiodini et al. (2005) gives an estimate for the diffuse heat flux on 1998 of 21 MW, dT/dz values in Aubert et al. (2008) can be used to estimate a value of 17–45 MW (Harris, 2013). These, however, are just two values not including the fumarolic contribution. We thus develop a methodol-ogy that (i) provides the diffuse heatflux from the zone of pervasive heating on a regular basis and (ii) allows conversion of single fumarole temperature measurements to fumarolic (vent) heatflux, allowing the contri-butions of the two thermal mechanisms to,finally, be simultaneously assessed and tracked.
2. Methods
The conceptual model for heat transfer to the surface, and loss from the surface, at a fumarolefield applied here is that collated in Harris (2013), and as given here in the supporting information Text S1. Within this
10.1029/2019GL084013
Geophysical Research Letters
model, the total energy budget,φtot, for this type of hydrothermal system
is given by the sum of the heatfluxes from the diffuse flux zone (φdiffuse)
and that from the active fumaroles for the ventflux (φvent).
2.1. Diffuse Heat Flux
The diffuse heat flux can be obtained from the temperature anomaly apparent in satellite thermal imagery withoutfield deployment of a radio-meter or thermal camera and has all advantages of satellite‐based mea-surements, such as guaranteed, regular and synoptic coverage (Francis & Rothery, 1987; Oppenheimer, 1993). In particular, the ASTER (Advanced Spaceborne Thermal Emission and Reflection Radiometer) instrument aboard the Terra satellite provides thermal images with a spa-tial resolution of 90 m and a nominal repeat time of 16 days at the equator, with higher frequencies possible using the Urgent Response Protocol (Ramsey, 2016). We thus here examine the capability of ASTER for detect-ing and extractdetect-ing thermal anomalies at diffuse heated areas.
The ASTER data products used in this study were of the AST_09T class, which are atmospherically corrected and georeferenced to the WGS84 datum. ASTER images dating back to 2000 were collected with each gran-ule covering an area of 60 × 60 km. In this study, we focused specifically on the thermal infrared Band 14, which records at wavelengths between 10.95 and 11.65μm (Yamaguchi et al., 1998), within which the tempera-ture anomalies produced at fumarolefields should be detectable (Harris & Stevenson, 1997; Oppenheimer et al., 1993).
Images were selected as close as possible tofield campaigns, and the dates of the ASTER granule acquisitions are listed in Table 1. We selected night-time scenes to avoid effects of solar heating and reflection and Terra's orbital characteristics meant that these overpasses occurred at approximately 21:00 UTC. Thus, 18 nighttime images were available within 18 days of all campaigns, with the exception of 2007 for which imagery was unavailable due to bad quality of data granules. For each scene, we identified a 5 × 5 pixel region of interest (i.e., a 450‐m × 450‐m area, which is roughly the diameter of the Fossa crater)centred on the Fossa crater and used the 25 pixels in this box to define ΔT (Figure S2). To do this, the temperature of each anomalous pixel was used for Tdiffuseand,
fol-lowing Lee and Tag (1990), the coldest value from the nearest nonanomalous pixels to each hot pixel for Tambient(Figure S2), withΔT extracted given in Table 1.
To validateΔT and check the convective heat transfer coefficient (see supporting information Text S1), we followed the methodology of Sekioka and Yuhara (1974) and Matsushima et al., (2003; see Table S1) and installed two stations just inside (496551°E 4250793°N WGS84 UTM Zone 33°S) and outside (496517°E 4250772°N) the diffuse‐heated zone on 31 May 2011 (Figure 1). In situ surface temperature was measured using two Land‐Minolta Cyclops 300 thermal infrared (8–14 μm) thermometers every 2 min for a period of 3 hr between 03:40 and 06:40 (local time). In addition, the air temperature, humidity, pressure, and wind speed values needed by the methodology of Sekioka and Yuhara (1974) were simultaneously measured using a Kestrel 5000 weather station in order to validate heat transfer coefficient hc(see supporting information).
2.2. Vent Heat Flux
Vent temperatures were collected during each ground‐based survey using the Land‐Minolta Cyclops 300 infrared radiometer following the methodology of Harris and Maciejewski (2000). During each survey the same lines were walked and between 226 and 760 fumaroles, depending on the actual number of active vents, were sampled. For selected case‐type areas, we measured the size of the active fumaroles (Avent)
and counted the total number of active vents using thermal images acquired from a FLIR ThermaCAM SC660. On 20 May 2018, we measured three approximately 5 × 5‐m areas within the fumarole field that cov-ered the full (80 to 350 °C temperature range) and estimated the typical values for Aventfor the low‐ (<150 °
C), moderate‐ (150–250 °C), and high‐temperature(>250 °C) fumaroles. Based on the location of measure-ments made during a “blind” survey the day before imaging, we assessed how many fumaroles in the
Table 1
ASTER‐Derived T, Number of Fumaroles Measured During Each Survey, Average Vent Temperature, and Vent Area
Satellite data Ground‐based campaign
Date T Date Fumaroles Tmean Vent area (yyyy‐mm‐dd) [°C] (yyyy‐mm‐dd) (N°) [°C] [m2] 2000‐07‐08 5 2000‐05‐21 760 145 127 2001‐07‐11 3 2001‐05‐26 643 143 109 2002‐06‐14 4 2002‐05‐23 856 149 147 2002‐10‐27 4 2002‐09‐26 521 139 81 2003‐05‐14 3 2003‐06‐01 583 149 100 2004‐05‐25 4 2004‐06‐20 505 155 85 2005‐11‐04 5 2005‐07‐18 680 161 126 2006‐06‐07 4 2006‐06‐26 592 183 119 2008‐08‐08 3 2007‐09‐09 586 177 120 2010‐05‐26 5 2010‐06‐12 410 187 84 2011‐04‐11 4 2011‐05‐28 469 184 96 2015‐04‐13 4 2015‐05‐22 442 172 87 2015‐08‐28 4 2015‐09‐18 310 170 61 2016‐09‐15 3 2016‐09‐16 308 159 57 2017‐09‐09 4 2017‐09‐22 304 168 56 2018‐05‐16 4 2018‐05‐17 302 196 61 2018‐08‐29 6 2018‐09‐21 320 206 70 2019‐05‐10 2 2019‐04‐28 222 185 43
total population imaged by the thermal camera were sampled by the radiometer survey. We double checked the sample and population by taking the sample set on 17 May and then measuring all fumaroles on 22 May to obtain the total population from which the sample was taken.
3. Results
3.1. Diffuse Flux
Wefind that, typically, Tdiffusedetermined from the ASTER data has an average value of 24 °C and Tambientis
approximately 20 °C, which equates toΔT = 4 °C (Table 1). The ΔT obtained from the ASTER image of April 2011 was 4 ± 2 °C and compared well with the value of 5 ± 1 °C obtained during thefield survey of May 2011. Atmospheric parameters collected on the same night, when used in the method of Sekioka and Yuhara (1974), give a value of 24 W·m−2·K−1for the heat transfer coefficient, which was a little lower than the value of 35 W·m−2·K−1found by Matsushima et al. (2003) for the fumarolefield at Iwodake volcano (Japan). Using these values in equations (S3) and (S4) (supporting information Text S1), we estimate that the diffuseflux ranged from 4 to 13 MW for the period of this study (2000–2019), with a maximum of 13 ± 2 MW in 2011, a minimum of 4 ± 2 MW in 2019, and a mean value of 9 ± 2 MW (1σ, Figure 2a).
3.2. Vent Flux
We give the mean fumarole temperature from eachfield campaign in Table 1, from which we find that radia-tive heatflux densities from the vents varied between 5 and 7.5 kW/m2during 2000–2019. The thermal cam-era survey showed that high‐, moderate‐, and low‐temperature fumaroles had typical areas of 0.07, 0.13, and 0.06 m2, respectively, and that 46 % of the population was sampled by the infrared thermometer survey. This is in agreement with the comparison of the sample and population data, where 302 of the 673 fumaroles (45%) were sampled between 18 and 20 May 2018. We alsofind that the mean temperature of the sample (18 May 2018) was 192 ± 62 °C (1σ) and that of the population (20 May 2018) was 190 ± 54 °C, with the med-ians being 187 and 186 °C, respectively. Scaling all sample setups (by assuming these vent areas and percen-tage sampled), we obtain a total vent area between 43 and 147 m2during 2000–2019 (Table 1).
The resultingφventis in the range 0.35–0.96 MW (Figure 2b), with a maximum of 0.96 MW in 2002, a
mini-mum of 0.35 MW in 2019, and a mean value of 0.65 MW (Figure 2b). Figure 2c shows partitioning and evo-lution of high‐, moderate‐, and low‐temperature vents through time.
4. Discussion
Partitioning of the totalflux between φdiffuseandφventwas approximately constant over the study period,
withφdiffuserepresenting on average 93 ± 2% (1σ) of the total heat flux. Though the diffuse heat flux density
was far lower (0.55 to 1.57 kW/m2) than the vent heatflux density, the area covered by fumarole vents was typically around 100 m2 (Figure 3), whereas the diffuse heated area extended up to 63,900 m2. Thus, although the temperature at fumarole vents is much higher than over heated surfaces, the heatflux from the diffuse area, which is 640 times greater in magnitude, dominates the heat budget.
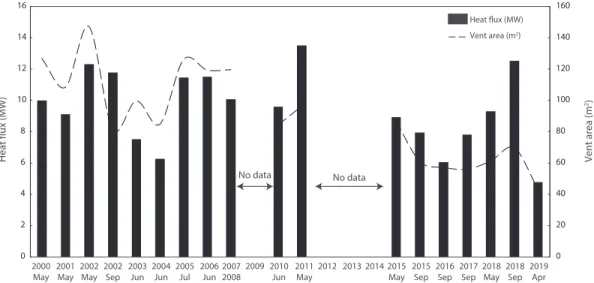
We see from Figure 2 that diffuse and ventfluxes had similar trends through time. Between 2000 and 2002, total heatflux values were characterized by relatively stable levels (around 10 MW), after which total flux declined through 2003 and 2004 before picking up in 2005 to levels of around 10–12 MW (Figure 3). These higher levels persisted until 2011 when we recorded a peak value of 14 MW. After this peak, totalflux decreased through 2015–2016, before increasing again in September 2018. However, by the last survey (April–May 2019) heat flux had dropped to the lowest value (5 MW) recorded during the last 19 years. The rejuvenation in fumarole temperatures following 2014 has already been noted and has been linked to an increase in high‐frequency seismic events at this time that have been related to fracturing events (Alparone et al., 2010) and which served to increase the shallow permeability of the system and hence heat flow at the fumaroles (Diliberto, 2017; Harris et al., 2012). This all implies strong coupling between the low‐ permeability soil degassing/diffuse system and the higher permeability fumarolic system. That is, when dif-fuse heatfluxes increase, so too do vent temperatures, total number of fumaroles and total exhaling area; and vice versa (Figure 2).
10.1029/2019GL084013
Geophysical Research Letters
For the diffuseflux, heat is generated by boiling of water at depth. Fluids are advected through the rock between the hydrothermal system and the surface where they condense at shallow depths (Chiodini et al., 2005). Heat generated by condensation is then transferred to the surface from which it is lost through con-vection and radiation. At Vulcano, based on the location of seismic events associated with fracturing and
Figure 2. (a) Diffuse and (b) ventflux (2000–2019). Black bars represent the radiative component, gray bars represent the convective component, and white bars represent the total ventflux. (c) Number of vents within the fumarole area. Solid, dashed, and dotted lines represent low‐, moderate‐, and high‐temperature fumaroles, respectively, and black bars are the total number of vents.
fluid flow, this zone extends across a depth of 200–1,600 m (Alparone et al., 2010). Gambino and Guglielmino (2008) placed the source of deflation (which results from volume loss due to increased vaporization of water during heating) associated with heating during the 1990–1996 crisis at a depth of 250 m (i.e., approximately sea level). This results in a heat chimney to the surface to cause heating over a surface area of 63,900 m2 and a thermal anomaly (ΔT) of 2–7 °C. On the other hand, the vent flux represents radiative and convective heat losses from individual fumarole vents located over the mostly highly permeable (nonsealed fracture zone) where heat is transferred more efficiently to the surface, and which was thus characterized by typical (mean) temperatures of 150–180 °C during the period 2000–2019. The current area of this zone of efficient heat transfer is 43–147 m2and compares with that of 75–350 m2
estimated on the basis of waterflux from the fumaroles by Italiano et al. (1984) and Italiano and Nuccio (1992) between 1975 and 1987 but is somewhat lower than the area (600–2,400 m2) associated with the 1990–1996 crisis (Bukumirovic et al., 1996, 1997). This is consistent with lower heat fluxes (around 10 MW) and a smaller diffuse area (63,900 m2), estimated here for the period 2000–2019, than that estimated by Chiodini et al. (2005) for 1998, that is, 21 MW and 415,000 m2.
Our results confirm that Vulcano represents one of the lowest‐energy hydrothermal systems, where systems such as Nisyros (Greece) or Campi Flegrei (Italy) release up to 40–100 MW (Chiodini et al., 2005). However, Harvey et al. (2015) argue that the intensity of heatflow (in terms of heat flux density) is a more useful com-parative measure for hydrothermal systems. Accordingly, they collate heatflux densities for 20 major hydro-thermal systems in which the most intense is that of Reykjanes (Iceland) at 1,048 MW/km2(Fridriksson et al., 2006; Sveinbjornsdottir et al., 1986) and the least powerful is the Vesuvio cone (Italy) at 55 MW/km2(Chiodini et al., 2001, 2004). Typical values for our study (140 MW/km2) place Vulcano fourteenth on this table, above both Nisyros (19–166 MW/km2, Brombach et al., 2001; Dotsika et al., 2009) and Campi Flegrei (118 MW/km2, Panichi & Volpi, 1999; Chiodini et al., 2001). The methodology presented here repre-sents a straightforward means to adding further systems to such appraisals and inventories, as well as for making more regular measurements at those systems already constrained, so as to better define temporal variability. Given the typical overpass of ASTER‐type sensors (a few days) and the longevity now of available data sets (where, if we consider Band 6 of Landsat Thematic Mapper, we have data back to 1982), such var-iation can be defined across seasonal‐to‐decadal time scales. However, the method does require cloud and plume free imagery, which is a major drawback especially for humid, tropical targets where cloud cover is frequent, as is condensation of the plume so as to obscure the thermal anomaly. Application of the metho-dology also depends on the presence of a thermal anomaly in the satellite imagery. Given the NEΔT of ASTER of 0.3 °C, a pixel‐filling heated surface will need to be elevated by at least 0.5 °C above its background to be detected. Finally, the convective heat transfer coefficient will have to be set depending on atmospheric conditions, which will vary with climatic zone, altitude, time of day, season, and meteorological conditions.
Figure 3. Evolution of the total heatflux and of the vent surface area (dashed line) between 2000 and 2019.
10.1029/2019GL084013
Geophysical Research Letters
For now, based on our measurements, if in situ atmospheric measurements are not available, uncertainty on the convective heat transfer coefficient, and hence overall heat flux, will be around 30%.
5. Conclusion
This work aimed to build a complete heat loss model for a hydrothermal system feeding fumarolic emission, focusing on the case of thefield active in the Vulcano Fossa crater. By combining ground‐ and satellite‐based thermal infrared remote sensing, we were able to constrain the thermalflux of the Vulcano Fossa hydrother-mal system between 2000 and 2019 and partition between the two contributing components (diffuse and fumarolic vents). To do this, we developed a new methodology that allows us to estimate accurately the area of, and heatflux, active vents for each fumarole type. In parallel, we validated a simple method to obtain the diffuse heatflux from near‐simultaneously acquired high spatial resolution thermal infrared data from a satellite sensor (ASTER). Our keyfinding was that, as suspected, the diffuse flux was dominant accounting for more than 90% of the totalflux.
A large number of volcanoes are characterized by diffuse and fumarolic degassing, and the validated model and methodology given here may be applied to all so as to provide a complete global inventory, and timeline, for global hydrothermal systems. If the diffuseflux can be proved, or assumed to be, dominant over the vent flux then the total flux can be approximated from the measurement of ΔT alone. Further, at such systems coupled trends between diffuse heatflux, vent heat flux and vent area mean that trends in ΔT alone can be inferred to be representative of system behaviour (cooling, heating, contracting, and expanding). We thus provide a ground‐validated methodology to allow regular, and improved, heat flux assessments from tem-perature measurements at hydrothermal systems using high spatial resolution thermal infrared data that are available from ASTER, EO‐1, ETM+, or Sentinel‐2. We now intend to increase the temporal resolution of our time series by considering the full archive (not just images close to annual ground validation cam-paigns). Using such time series, we hope to better quantify and understand the trends and relations indicated by our initial analysis, through cross correlation with other geophysical data sets (primarily seismicity and deformation), as well asfluid flux. This latter value is currently unavailable for Vulcano but may be provided through currently evolving new approaches such as muography.
References
Allard, P., Carbonnelle, J., Dajlevic, D., Le Bronec, J., Morel, P., Robe, M. C., et al. (1991). Eruptive and diffuse emissions of CO2from
Mount Etna. Nature, 351(6325), 387.
Alparone, S., Cannata, A., Gambino, S., Gresta, S., Milluzzo, V., & Montalto, P. (2010). Time‐space variation of volcano‐seismic events at La Fossa (Vulcano, Aeolian Islands, Italy): New insights into seismic sources in a hydrothermal system. Bulletin of Volcanology, 72(7), 803–816. https://doi.org/10.1007/s00445‐010‐0367‐6
Aubert, M., Diliberto, S., Finizola, A., & Chébli, Y. (2008). Double origin of hydrothermal convectiveflux variations in the Fossa of Vulcano (Italy). Bulletin of Volcanology, 70(6), 743–751.
Barberi, F., Gandino, A., Anna, G., La Torre, P., Sbrana, A., & Zenucchini, C. (1994). The deep structure of the Eolian Arc (Filicudi‐ Panarea‐Vulcano Sector) in light of gravity, magnetic and volcanological data. Journal of Volcanology and Geothermal Research, 61(3–4), 189–206.
Baubron, J. C., Allard, P., & Toutain, J. P. (1990). Diffuse volcanic emissions of carbon dioxide from Vulcano Island, Italy. Nature, 344(6261), 51–53. https://doi.org/10.1038/344051a0
Branan, Y. K., Harris, A., Watson, I. M., Phillips, J. C., Horton, K., Williams‐Jones, G., & Garbeil, H. (2008). Investigation of at‐vent dynamics and dilution using thermal infrared radiometers at Masaya Volcano, Nicaragua. Journal of Volcanology and Geothermal Research, 169(1–2), 34–47.
Brombach, T., Hunziker, J. C., Chiodini, G., Cardellini, C., & Marini, L. (2001). Soil diffuse degassing and thermal energyfluxes from the Southern Lakki Plain, Nisyros (Greece). Geophysical Research Letters, 28(1), 69–72. https://doi.org/10.1029/2000GL008543
Bukumirovic, T., Italiano, F., & Nuccio, P. M. (1997). The evolution of a dynamic geological system: The support of a GIS for geochemical measurements at the fumarolefield of Vulcano, Italy. Journal of Volcanology and Geothermal Research, 79(3–4), 253–263.
Bukumirovic, T., Italiano, F., Nuccio, P. M., Pecoraino, G., & Principio, E. (1996). Evolution of the fumarolic activity at La Fossa Crater of Vulcano. Acta Vulcanologica, 8, 210–211.
Capasso, G., Inguaggiato, S., Nuccio, P. M., Pecoraino, G., & Sortino, F. (1994). Chemical variations in the fumarolic gases of La Fossa Di Vulcano Crater. Acta Vulcanologica, 4, 41–43.
Capasso, G., Favara, R., & Inguaggiato, S. (1997). Chemical features and isotopic composition of gaseous manifestations on Vulcano Island, Aeolian Islands, Italy: An interpretative model offluid circulation. Geochimica et Cosmochimica Acta, 61(16), 3425–3440.
Chiodini, G., Cardellini, C., Amato, A., Boschi, E., Caliro, S., Frondini, F., & Ventura, G. (2004). Carbon dioxide Earth degassing and seismogenesis in central and southern Italy. Geophysical Research Letters, 31, L07615. https://doi.org/10.1029/2004GL019480 Chiodini, G., Frondini, F., Cardellini, C., Granieri, D., Marini, L., & Ventura, G. (2001). CO2degassing and energy release at Solfatara
Volcano, Campi Flegrei, Italy. Journal of Geophysical Research, 106(B8), 16,213–16,221. https://doi.org/10.1029/2001JB000246 Chiodini, G., Granieri, D., Avino, R., Caliro, S., Costa, A., & Werner, C. (2005). Carbon dioxide diffuse degassing and estimation of heat
release from volcanic and hydrothermal systems. Journal of Geophysical Research, 110, B08204. https://doi.org/10.1029/2004JB003542 Acknowledgments
The dense time series of ASTER data was made possible by the Urgent Request Protocol (UPR) Program (Ramsey, 2016) and was obtained from the ASTER Volcano Archive (https:// ava.jpl.nasa.gov/). We are grateful to Massimiliano Favalli (INGV) for providing the orthophoto used to create Figure 1. This work was supported by the Laboratory of Excellence ClerVolc, contribution 371 and IPGP
Contribution 4065. This is also a contribution (11) to the project LAVA financed by the Agence National de la Recherche (Program: DS0902; ANR‐16 CE39‐0009). We thank both reviewers Matthew Blackett and Nico Fournier for their constructive reviews, which helped us to clarify our objectives and findings.
Chiodini, G., Cioni, R., & Marini, L. (1993). Reactions governing the chemistry of crater fumaroles from Vulcano Island, Italy, and implications for volcanic surveillance. Applied Geochemistry, 8(4), 357–371.
Chiodini, G., Cioni, R., Marini, L., & Panichi, C. (1995). Origin of the fumarolicfluids of Vulcano Island, Italy and implications for volcanic surveillance. Bulletin of Volcanology, 57(2), 99–110.
Crisp, J. A. (1984). Rates of magma emplacement and volcanic output. Journal of Volcanology and Geothermal Research, 20(3–4), 177–211. Diliberto, I. S. (2017). Long‐term monitoring on a closed‐conduit volcano: A 25 year long time‐series of temperatures recorded at La Fossa
Cone (Vulcano Island, Italy), Ranging from 250 C to 520 C. Journal of Volcanology and Geothermal Research, 346, 151–160. Dotsika, E., Poutoukis, D., Michelot, J. L., & Raco, B. (2009). Natural tracers for identifying the origin of the thermalfluids emerging along
the Aegean Volcanic Arc (Greece): Evidence of Arc‐Type Magmatic Water (ATMW) participation. Journal of Volcanology and Geothermal Research, 179(1), 19–32. https://doi.org/10.1016/j.jvolgeores.2008.09.024
Favalli, M., Fornaciai, A., Nannipieri, L., Harris, A., Calvari, S., & Lormand, C. (2018). UAV‐based remote sensing surveys of lava flow fields: A case study from Etna's 1974 channel‐fed lava flows. Bulletin of Volcanology, 80, 29. https://doi.org/10.1007/s00445‐018‐1192‐6 Finizola, A., Revil, A., Rizzo, E., Piscitelli, S., Ricci, T., Morin, J., et al. (2006). Hydrogeological insights at Stromboli Volcano (Italy) from
geoelectrical, temperature, and CO2soil degassing investigations. Geophysical Research Letters, 33, LI7304. https://doi.org/10.1029/
2006GL026842
Francis, P. W., & Rothery, D. A. (1987).“Using the Landsat Thematic Mapper to detect and monitor active volcanoes: An example from Lascar Volcano, Northern Chile.” Geology 15 (7): 614–17. https://doi.org/10.1130/0091‐7613(1987)15<614:UTLTMT>2.0.CO;2. Fridriksson, T., Kristjánsson, B. R., Ármannsson, H., Margrétardóttir, E., Ólafsdóttir, S., & Chiodini, G. (2006). CO2emissions and heatflow
through soil, fumaroles, and steam heated mud pools at the Reykjanes geothermal area, SW Iceland. Applied Geochemistry, 21(9), 1551–1569. https://doi.org/10.1016/j.apgeochem.2006.04.006
Gambino, S., & Guglielmino, F. (2008). Ground deformation induced by geothermal processes: A model for La Fossa Crater (Vulcano Island, Italy). Journal of Geophysical Research, 113, B07402. https://doi.org/10.1029/2007JB005016
Giustolisi, Vittorio, & De Oliveira, H. A. (2005). Bibliografia Generale Delle Isole Eolie. 1. Vulcano. Vol. 1. Centro di documentazione e ricerca per la Sicilia antica Paolo Orsi‐onlus.
Granieri, D., Carapezza, M. L., Chiodini, G., Avino, R., Caliro, S., Ranaldi, M., et al. (2006). Correlated increase in CO2fumarolic content
and diffuse emission from La Fossa Crater (Vulcano, Italy): Evidence of volcanic unrest or increasing gas release from a stationary deep magma body? Geophysical Research Letters, 33, L13316. https://doi.org/10.1029/2006GL026460
Hardee, H. C. (1982). Permeable convection above magma bodies. Tectonophysics, 84(2–4), 179–195.
Harris, A. J. L., & Maciejewski, A. J. H. (2000). Thermal surveys of the Vulcano Fossa fumarolefield 1994–1999: Evidence for fumarole migration and sealing. Journal of Volcanology and Geothermal Research, 102(1–2), 119–147.
Harris, A. (2013). Thermal remote sensing of active volcanoes: A user's manual. Cambridge: Cambridge University Press.
Harris, A., Alparone, S., Bonforte, A., Dehn, J., Gambino, S., Lodato, L., & Spampinato, L. (2012). Vent temperature trends at the Vulcano Fossa fumarolefield: The role of permeability. Bulletin of Volcanology, 74(6), 1293–1311.
Harris, A. J. L., Lodato, L., Dehn, J., & Spampinato, L. (2009). Thermal characterization of the Vulcano fumarolefield. Bulletin of Volcanology, 71(4), 441.
Harris, A. J. L., & Stevenson, D. S. (1997). Thermal observations of degassing open conduits and fumaroles at Stromboli and Vulcano using remotely sensed data. Journal of Volcanology and Geothermal Research, 76(3–4), 175–198. https://doi.org/10.1016/S0377‐0273(96) 00097‐2
Harris, A., & Ripepe, M. (2007). Temperature and dynamics of degassing at Stromboli. Journal of Geophysical Research, 112, B03205. https://doi.org/10.1029/2006JB004393
Harvey, M. C., Rowland, J. V., Chiodini, G., Rissmann, C. F., Bloomberg, S., Hernández, P. A., et al. (2015). Heatflux from magmatic hydrothermal systems related to availability offluid recharge. Journal of Volcanology and Geothermal Research, 302, 225–236. Hédervári, P. (1963). On the energy and magnitude of volcanic eruptions. Bulletin of Volcanology, 25(1), 373–385.
Italiano, F., & Nuccio, P. M. (1992). Volcanic steam output directly measured in fumaroles: The observed variations at Vulcano Island, Italy, between 1983 and 1987. Bulletin of Volcanology, 54(8), 623–630.
Italiano, F., Nuccio, P. M., & Sommaruga, C. (1984). Gas/steam and thermal energy release measured at the gaseous emissions of the Baia Di Levante of Vulcano Island, Italy. Acta Vulcanologica, 5, 89–94.
Lee, T. F., & Tag, P. M. (1990). Improved detection of hotspots using the AVHRR 3.7‐μm channel. Bulletin of the American Meteorological Society, 71(12), 1722–1730. https://doi.org/10.1175/1520‐0477(1990)071<1722:IDOHUT>2.0.CO;2
Lloyd, E. F. (1959). The hot springs and hydrothermal eruptions of Waiotapu. New Zealand Journal of Geology and Geophysics, 2(1), 141–176.
Matsushima, N., Kazahaya, K., Saito, G., & Shinohara, H. (2003). Mass and heatflux of volcanic gas discharging from the Summit Crater of Iwodake Volcano, Satsuma‐Iwojima, Japan, during 1996–1999. Journal of Volcanology and Geothermal Research, 126(3–4), 285–301. Mercalli, G. (1907). I Vulcani Attivi Della Terra: Morfologia‐Dinamismo‐Prodotti‐Distribuzione Geografica‐Cause. Con 82 Incisioni e 26
Tavle. U. Hoepli.
Oppenheimer, C. (1993). Thermal distributions of hot volcanic surfaces constrained using three infrared bands of remote sensing data. Geophysical Research Letters, 20(6), 431–434. https://doi.org/10.1029/93GL00500
Oppenheimer, C., Rothery, D. A., & Francis, P. W. (1993). Thermal distributions at fumarolefields: Implications for infrared remote sen-sing of active volcanoes. Journal of Volcanology and Geothermal Research, 55(1), 97–115. https://doi.org/10.1016/0377‐0273(93)90092‐6 Panichi, C., & Volpi, G. (1999). Hydrogen, oxygen and carbon isotope ratios of Solfatara fumaroles (Phlegrean Fields, Italy): Further insight into source processes. Journal of Volcanology and Geothermal Research, 91(2), 321–328. https://doi.org/10.1016/S0377‐0273(99)00041‐4 Ramsey, M. S. (2016). Synergistic use of satellite thermal detection and science: A decadal perspective using ASTER. Geological Society,
London, Special Publications, 426(1), 115–136.
Sekioka, M., & Yuhara, K. (1974). Heatflux estimation in geothermal areas based on the heat balance of the ground surface. Journal of Geophysical Research, 79(14), 2053–2058. https://doi.org/10.1029/JB079i014p02053
Sicardi, L. (1940). Il Recente Ciclo Dellattività Fumarolica Dellisola Di Vulcano. Bulletin of Volcanology, 7(1), 85–139. Sigurdsson, H., Houghton, B., McNutt, S., Rymer, H., & Stix, J. (2015). The encyclopedia of volcanoes. Amsterdam: Elsevier.
Stevenson, D. S. (1993). Physical models of fumarolicflow. Journal of Volcanology and Geothermal Research, 57(3), 139–156. https://doi. org/10.1016/0377‐0273(93)90009‐G
Stevenson, H. (2007). Jobs for the boys: The story of a family in Britain's Imperial Heyday. London, UK: Dove Books.
Straatman, A. G., Tarasuk, J. D., & Floryan, J. M. (1993). Heat transfer enhancement from a vertical, isothermal channel generated by the chimney effect. Journal of Heat Transfer, 115(2), 395–402.
10.1029/2019GL084013
Geophysical Research Letters
Sveinbjornsdottir, A. E., Coleman, M. L., & Yardley, B. W. D. (1986). Origin and history of hydrothermalfluids of the Reykjanes and Krafla geothermalfields, Iceland. Contributions to Mineralogy and Petrology, 94(1), 99–109. https://doi.org/10.1007/BF00371231
Wright, R. (2016). MODVOLC: 14 years of autonomous observations of effusive volcanism from space. Geological Society, London, Special Publications, 426(1), 23–53.
Wright, R., Flynn, L. P., Garbeil, H., Harris, A. J. L., & Pilger, E. (2004). MODVOLC: Near‐real‐time thermal monitoring of global vol-canism. Journal of Volcanology and Geothermal Research, 135(1–2), 29–49.
Yamaguchi, Y., Kahle, A. B., Tsu, H., Kawakami, T., & Pniel, M. (1998). Overview of Advanced Spaceborne Thermal Emission and Reflection Radiometer (ASTER). IEEE Transactions on Geoscience and Remote Sensing, 36(4), 1062–1071. https://doi.org/10.1109/ 36.700991