HAL Id: hal-02907349
https://hal.archives-ouvertes.fr/hal-02907349
Submitted on 27 Jul 2020
HAL is a multi-disciplinary open access
archive for the deposit and dissemination of
sci-entific research documents, whether they are
pub-lished or not. The documents may come from
teaching and research institutions in France or
abroad, or from public or private research centers.
L’archive ouverte pluridisciplinaire HAL, est
destinée au dépôt et à la diffusion de documents
scientifiques de niveau recherche, publiés ou non,
émanant des établissements d’enseignement et de
recherche français ou étrangers, des laboratoires
publics ou privés.
Microwave Afterglows through Hollow Tubes: Advanced
Study
André Ricard, J.-P. Sarrette
To cite this version:
André Ricard, J.-P. Sarrette. Transmission of N-atoms Produced by N2 Flowing Microwave Afterglows
through Hollow Tubes: Advanced Study. Mohd Rafatullah. Recent Advances in Science and
Tech-nology Research, 3, Book Publisher International, 2020, 978-93-90149-41-4. �10.9734/bpi/rastr/v3�.
�hal-02907349�
_____________________________________________________________________________________________________ 1LAPLACE, Université de Toulouse, CNRS, INPT, UPS, 118 route de Narbonne, 31062 Toulouse cedex 9, France.
Transmission of N-atoms Produced by N
2
Flowing
Microwave Afterglows through Hollow Tubes:
Advanced Study
A. Ricard
1*and J. P. Sarrette
1 DOI:10.9734/bpi/rastr/v3ABSTRACT
Transmission rates (TN) of N-atoms through small diameters tubes (1.5 and 3 mm int dia and 9, 50
and 80 cm length for silicone tubes, 1.5 mm int dia and 6.5 cm length for stainless steel tubes) are measured in late N2 and Ar-N2 flowing after glows of microwave plasmas in continuous and pulsed
gas injection modes at a flow rate of 1 and 3 slpm, a gas pressure from 2 to 4 Torr for N2 and 20 Torr
for Ar-1%N2 and a plasma power varying from 150 to 300 Watt.
From the experimental TN values, it is deduced the γ-destruction probability inside the tube walls as
being γ = (1.0-1.6)10-3 for the silicon tubes and γ = (1.6-2.0) 10-2 for the stainless steel tubes.
Keywords: Spectroscopy; N-atoms transmission; hollow tubes; γ–destruction probability.
1. INTRODUCTION
Production of N-atoms has been previously studied in flowing N2 microwave post-discharges at
medium gas pressures (1-10 Torr) [1]. Bacteria inactivation by N-atoms in such post-discharge reactors has been largely studied [1-3].
In the cited previous works, the N atoms are produced by microwave plasmas at power of 100-300 Watt. The plasma is located inside a quartz tube of internal diameter (i.d) 5 mm and extends along a few centimeters outside the cavity (surfatron) gap for a gas pressure between 1 and 30 Torr and a flow rate between 0.5 and 2.0 slpm.
In these conditions, the plasma gas temperature reaches up to 1000 K near the surfatron gap [4], needing an air cooling of the quartz tube. After a few centimetres of post-discharge, the flowing gas temperature is returned to the room temperature.
After the plasma zone, early and late afterglows appear and the late afterglow extends in the post-discharge reactor where the sterilization of bacteria is studied.
It is presently reported the results obtained for the transmission of N-atoms produced in the N2 late
afterglow through small diameters hollow tubes.
These studies are of interest to appreciate the possibility of N-atoms sterilization inside hollow silicon and stainless steel tubes.
2. THE EXPERIMENTAL SETUP
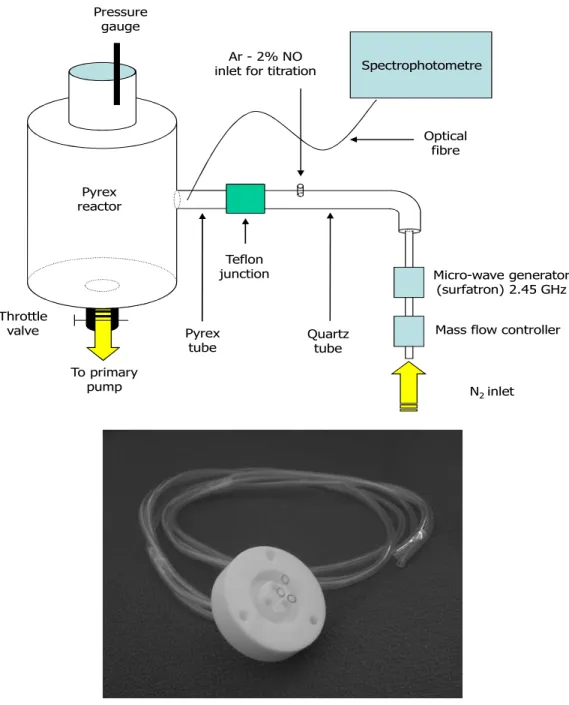
The flowing microwave post-discharge reactor described in previous studies [1-3] is reproduced in Fig. 1. A two-stage oil rotary pump with a pumping speed of 48 sm3/h (800 slm) is setup after a 5 litre
Recent Advances in Science and Technology Research Vol.3 Transmission of N-atoms Produced by N2 Flowing Microwave Afterglows through Hollow Tubes: Advanced Study
post-discharge reactor. The N2 flow rate is controlled from 1 to 3 slm using flow meters. The pressure
inside the reactor is adjusted by means of a throttle valve above the pump (see Fig. 1).
Fig. 1. Post discharge set up with the emplacement of the Teflon junction connecting the quartz and the Pyrex parts of the 18 mm i.d. tubes. The picture shows details of a modified Teflon junction used in the transmission experiments, allowing the gas to flow through three
silicone tubes
A 2.45 Ghz microwave plasma is produced by a surfatron cavity in a quartz tube of 5 mm i.d. and 15 cm in length after the surfatron gap. The quartz discharge tube enlarges to 18 mm i.d. and is connected to a 5 litres Pyrex reactor via a 18 mm Pyrex bend tube. The quartz and Pyrex 18 mm i.d. tubes are joined by a hollow Teflon junction insuring primary vacuum conditions. The total distance between the surfatron and the reactor is 56 cm.
Mass flow controller Pressure
gauge
Micro-wave generator (surfatron) 2.45 GHz Ar - 2% NO
inlet for titration
N2 inlet To primary pump Optical fibre Spectrophotometre Teflon junction Quartz tube Pyrex reactor Throttle valve Pyrex tube
At a pressure of 5 Torr and a flow rate of 1 slm, the flow times are calculated as being 2 10-3 s and 10-2 s at the exit of the tubes of 5 mm i.d. and 18 mm i.d., respectively.
Optical Emission Spectroscopy (OES) along the afterglow tubes was performed using an optical fibre connected to an Acton Spectra Pro 2500i spectrometer (grating 600 gr/mm, slit aperture 0.15 mm, counting time 1 s), equipped with a Pixis 256E CCD detector (front illuminated 1024x 256 pixels). The absolute N-atom density was obtained using the NO titration method [1-4], by injecting an Ar-2%NO gas mixture in the post-discharge tube (see Fig. 1).
The transmission of N-atoms through hollow tubes was studied by using a modified Teflon junction (Fig. 1), machined to receive between 3 and 9 hollow tubes of dia. 1-3 mm.
The hollow tubes insertion in the Teflon junction produces pressure variations between the plasma tube and the 5 litre reactor. Such pressure variations were analysed from the afterglow emission at z = 20 cm (the z = 0 point being taken in the quartz tube, at the 5 to 18 mm enlargement position), by conserving a constant pressure in the 5 litre reactor.
The spectrum recorded at z = 3 cm without the hollow tubes and reproduced in Fig. 2 shows the emission of the N2 1st positive, v = -4 sequence. Domination of the 11-7 band at 580 nm is
characteristic of full late afterglow conditions, where the N-atom three body recombination process N + N + M → N2(B,v=11) + N2 is at the origin of the intense N2(B,v=11) → N2(A,v=7) + h580nm emission.
In consequence, as demonstrated in refs [4-7] for pressures higher than 2 Torr, the I580nm intensity is
directly proportional to the square of the N-atom concentration [N]:
I580 = k [N]2 (1)
where k is a constant including reaction rates and characteristics of the used optical acquisition system, that can be determined by NO titration. To obtain the N-atom absolute density, the constant k in eq.1 was determined by NO titration [3]. Briefly, an Ar-2%NO gas mixture is introduced at z = 20 cm, at low flow rate:
Step 1: For a NO flow rate Q(NO) less than that the N-atom flow rate of the afterglow Q(N), a
violet emission is produced by the following reactions:
N + NO → N2 + O (a)
N + O + N2 → NO(B) + N2 (b)
inducing the decrease of the I580nm emission and the increase of the NOβ violet bands.
Step 2: The injected NO flow rate is gradually increased, consuming stoechiometrically the
N-atoms. When Q(NO) becomes higher than Q(N), the N2 1st positive and NOβ violet bands
emission disappear and the NO2* green continuum emission is observed.
All of the N-atoms are consumed by reaction (b) and the produced O-atoms now react with the NO molecules in excess following the process:
O + NO + N2 → NO2* + N2. (c)
At the extinction point where no emission is observed, the injected NO flow rate Q(NOext) equals
the N-atom flow rate of the afterglow Q(N), relation (2) then allows to obtain the absolute N-atom concentration [N]:
[N]/[N2] = Q(N)/Q(N2) = Q(NOext)/Q(N2) (2)
With the used spectrometer and optical fiber (see set-up above), the k constant in (1) was found to be k = 0.6 (±0.3) 10-26 counts cm6 [8]. According to (1), the k constant can then be used to determine the N-atom absolute concentration by simply recording the (I580)1/2 value.
Recent Advances in Science and Technology Research Vol.3 Transmission of N-atoms Produced by N2 Flowing Microwave Afterglows through Hollow Tubes: Advanced Study
Fig. 2. Spectrum of the N2 1st positive bands recorded between 560 and 620 nm at 3 cm from
the inlet of the i.d. 18 mm afterglow quartz tube
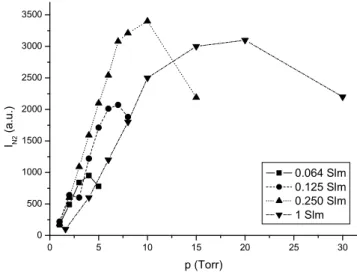
The evolution of the I580 intensity observed at z = 20cm with the gas pressure measured in the 5 litre
reactor (see Fig. 1) is reproduced in Fig. 3 for several N2 flow rates without the silicon tubes in the
Teflon junction.
It is deduced that the N-atom density at z= 20 cm, given by (I580)1/2/k (see (1)) always shows a
maximum value depending on the gas pressure and can be optimized for every used flow rate. With increasing N2 flow rates, the optimized N-atom density is obtained for higher gas pressures and the
maximum [N] density is found at 10 Torr for QN2 = 0.25 slpm.
In consequence, at 1 slpm and 100 Watt, between 2 and 20 Torr, the I580 measurement gives both the
absolute N-atom density but also the gas pressure. At lower flow rates, as the I580 maximum is shifted
to lower pressures, the gas pressure determination is limited to 10 Torr for 0.25 slpm, 7 Torr for 0.125 slpm and 4 Torr for 0.064 slpm.
In presence of the silicon tubes, the I580 intensity at z= 20cm reported in Fig. 3 willallow to determine
both the upstream absolute N–atom density and the gas pressure for a given flow rate.
Fig. 3. Variation of I 580 intensity in z=20 cm with N2 gas pressure without the silicon tubes
inside the Teflon junction, for several flow rates at 100 Watt
0 5 10 15 20 25 30 0 500 1000 1500 2000 2500 3000 3500 IN2 (a .u.) p (Torr) 0.064 Slm 0.125 Slm 0.250 Slm 1 Slm
At high N2 pressure (p > 5 Torr), it was not always possible to switch on the N2 discharge at a power
less than 300 Watt. Nevertheless, as described in [9], it has been found that the plasma can be switched on at higher pressure by pulsing the gas flow. For that purpose, a Parker electromagnetic valve was setup between the mass flow controller and the microwave cavity in Fig. 1.
When the valve is closed, the continuous pumping decreases the pressure in the tubes and the discharge can be switched on as the gas pressure and it was maintained at high pressure when the valve was opened (at a constant time of 2 10-2 sec).
An Ar-N2 gas mixture was also studied since the discharge is easier to sustain in this mixture than in
pure N2 at high pressure [10].
3. PLASMAS AT HIGH GAS PRESSURES 3.1 Plasmas in Pulsed N2 Gas
The microwave cavity was first tuned with a continuous gas inlet of 1 slpm and an injected power between 100 and 300 Watt. Then, by pulsing the gas with a δt pulse varying between 0.1 to 2.0 s and a Δt period of 1 and 2 s, it was successively produced two plasmas at high (2-3 Torr) and low (0.4-0.5 Torr) pressure [9].
By checking the band intensity ratio N2+ 391 nm/ N2 380 nm near the surfatron gap, it was found that
the microwave cavity correct tuning remained with the gas on, as for the continuous case with a negligible reflected power. This N2
+
/N2 band intensity ratio can be effectively considered as a
signature of plasma ionization rate, a constant value indicating that identical plasma conditions were reached.
At low pressure, when the gas was off, the reflected power was found important, varying from 30 to 90 Watt for an incident power from 100 to 150 Watt [9].
In these conditions, a strong late afterglow of N2 1 st
pos. bands (showing the typical emission at 580 nm illustrated in Fig. 2 and resulting of 3-body N-atoms recombination) was observed at high pressure but not at low pressure.
Time fluctuations of the integrated afterglow intensity with the gas pressure were studied using a photodiode (600-900 nm) and are reproduced in Fig. 4.
It was established that for long pulses (0.4-1.0 sec), the N-atom density increased up to the end of gas pulse as do the plasma length.
A maximum of the N-atom density was obtained for time period Δt twice the pulse time δt. The maximum pressure variations were found for long pulses. For the following experimental conditions: incident power 200 Watt, N2 flow rate 1 slpm, pumping speed 800 slpm, Δt ~ 2 δt = 2 s, it was
determined a mean N-atom density of 9 1014 cm-3 (very close to the 1015 cm-3 concentration obtained with continuous flow conditions) and a pressure variation Δp = 2.3-0.5 Torr.
3.2 Plasmas in Ar-N2 Gas Mixture
Homogeneous N2 microwave post-discharges can be obtained in the continuous mode at reduced
gas pressures (2-10 Torr). When the pressure is increased, the plasma became unstable and a 300 W power is not sufficient to sustain the discharge. Adding Ar to N2 allowed obtaining a stable
discharge from low pressure up to atmospheric gas pressure with N2 percentage below 23% with a
microwave power limited to 300 Watt [10].
The gas temperature was estimated from the rotational structure of the N2 775 nm band giving the
Transmission of N-atoms Produced by N
P (Torr)
Fig. 4. Time variations of the gas pressure in
electric field of the EM valve (3), obtained by the Labview program. The photodiode and electric field signals are in arbitr
Before the Teflon junction, it was determined a temperature of 360 K in the Ar Torr, 5 slpm and 150 Watt. This temperature is similar to the one obtained Torr, 1 slm, 100 Watt.
In pure N2 plasma, the electron energy distribution function is depleted above 3 eV because of the low
mean vibrational excitation of N2 molecules [11]. In contrast, in Ar gas, the first excitation threshold
being 11 eV, the extension of the electron energy is highe
plasma, the ionization in Ar-N2 gas mixture is enhanced, particularly at low N
conditions of an Ar discharge dominate.
4. TRANSMISSION OF N-ATOMS IN HOLLOW TUBES 4.1 Silicone Tubes
It was first experimented 9 tubes of silicones of i.d. 1.5 mm and o.d. 2 mm located inside the Teflon junction of Fig. 1 where 9 holes of dia.2 mm were drilled. The tubes were placed and if necessary coiled inside the 5 litres reactor.
For 150 long tubes, it was not possible to produce the N
it was necessary to pulse the gas with Δt ~ 2 δt = 2 s at 200 Watt to switch on the N 3.1.).
In these pulsed conditions, the afterglow main emission (N 50 cm inside the 9 tubes.
0 1 2 3 4 5 6 7 8 9
Recent Advances in Science and Technology Research Vol.3 atoms Produced by N2 Flowing Microwave Afterglows through Hollow Tubes: Advanced Study
Time variations of the gas pressure in Torr (1), of the photodiode signal (2) and of the electric field of the EM valve (3), obtained by the Labview program. The photodiode and
electric field signals are in arbitrary units. Discharge parameters: 150 Watt, 1 slpm, Δt = 2 s, δt = 1s
Teflon junction, it was determined a temperature of 360 K in the Ar-1%N2
Torr, 5 slpm and 150 Watt. This temperature is similar to the one obtained in pure N2 (330
plasma, the electron energy distribution function is depleted above 3 eV because of the low molecules [11]. In contrast, in Ar gas, the first excitation threshold being 11 eV, the extension of the electron energy is higher. Consequently, compared with pure N
gas mixture is enhanced, particularly at low N2 percentage where the
conditions of an Ar discharge dominate.
ATOMS IN HOLLOW TUBES
It was first experimented 9 tubes of silicones of i.d. 1.5 mm and o.d. 2 mm located inside the Teflon 1 where 9 holes of dia.2 mm were drilled. The tubes were placed and if necessary
it was not possible to produce the N2 plasma at 300 Watt in continuous mode and
it was necessary to pulse the gas with Δt ~ 2 δt = 2 s at 200 Watt to switch on the N2
In these pulsed conditions, the afterglow main emission (N2 1st pos. around 580 nm) extended up to
(1) (2) (3)
Recent Advances in Science and Technology Research Vol.3 Flowing Microwave Afterglows through Hollow Tubes: Advanced Study
T (s)
Torr (1), of the photodiode signal (2) and of the electric field of the EM valve (3), obtained by the Labview program. The photodiode and
: 150 Watt, 1 slpm,
mixture for 20 330-350 K) at 5
plasma, the electron energy distribution function is depleted above 3 eV because of the low molecules [11]. In contrast, in Ar gas, the first excitation threshold Consequently, compared with pure N2
percentage where the
It was first experimented 9 tubes of silicones of i.d. 1.5 mm and o.d. 2 mm located inside the Teflon 1 where 9 holes of dia.2 mm were drilled. The tubes were placed and if necessary
plasma at 300 Watt in continuous mode and discharge (see
The length of the tubes was then reduced to 50 cm and the afterglow was detected at the tubes outlet, in the 5 litre reactor.
In conditions of Δt ~ 2 δt = 2 s, 200 Watt, 1 slpm, the gas pressure was found varying from 0.8 to 2.0 Torr in the reactor and the N-atom density was obtained from the I580nm intensity (see eq. (1)) after
calibration by NO titration.
It was found [N] = 3.4 1015 cm-3 at 1 cm before the Teflon junction. In the reactor, the N-atom density was evaluated from the I580nm intensity corrected from the change of emitting length between the
Pyrex tube (dia. 1.8 cm) and the reactor chamber (dia. 15 cm).
It was deduced [N] = 1.2 1014 cm-3 after 50 cm of silicon tubes length. The N-atom transmission TN
was thus evaluated to be 3.5%.
A second experiment was undertaken with a 3 holes (dia. 4 mm) Teflon junction, allowing connecting 3 silicon tubes of i.d. 3 mm (o.d. 4 mm) and length from 80 to 250 cm.
For these larger diameter tubes, the N2 plasma was switched on in the continuous mode.
At a flow rate of 1 slpm, a pressure of 4 Torr in the 5 litre reactor, a power of 150 Watt and silicon tube lengths of 80 cm, it was determined a N-atom density of 2.7 1015 cm-3 before the Teflon connector, corresponding to a transmission rate TN = 8.5%.
At a low flow rate of 0.125 slm, a power of 100 Watt and silicon tube lengths of 60 cm, it was obtained a small increase of TN from 3.9% at 1 Torr to 4.9% at 3 Torr.
To increase the plasma ionization at high flow rates (i.e. high gas pressures), it was experimented as discussed in 3.2., an Ar-1%N2 gas mixture.
With this mixture, a discharge was switched on in continuous mode at 150 W, 3 slpm, 20 Torr and with 80 cm length silicon tubes. The method described in part 2 was extended to the Ar-N2 gas
mixture, allowing obtaining the N-atom density before the Teflon connector. It was found [N] = 8.2 1015 cm-3 and TN = 8.5% at the outlet of the 80 cm silicone tubes, indicating an increase by a factor 3 of the
N-atom density and the same TN value, when compared to the pure N2 experiments at 150 W, 1 slpm
and 4 Torr.
4.2 Stainless Steel Tubes
9 stainless tubes of i.d. 1.5 mm and o.d. 2 mm, of 6.5 cm in length 6.5 cm were inserted in the Teflon junction as the silicon tubes in the previous experiment.
A continuous N2 afterglow was obtained at 300 W, 1 slpm and 1.7 Torr in the 5 litre reactor. In these
conditions, the N-atom density was measured to be 8 1015 cm-3 before the Teflon junction and 1014 cm-3 in the reactor, at the exit of the 9 stainless tubes, corresponding to a N-atom transmission of 1.3%.
In the pulsed mode, with Δt ~ 2 δt = 2 s, 200 Watt, 1 slpm, for a gas pressure varying between 0.9 and 2.3 Torr, the N-atom transmission was increased to 3.5-4.0%.
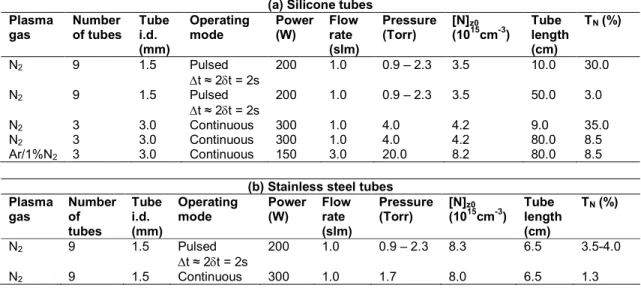
Transmission rates TN through silicone tubes of i.d. 1.5 and 3 mm and lengths of 9, 10 and 80 cm
in pulsed and continuous modes obtained in pure N2 and with the Ar-1%N2 mixture are reported in
Table 1a.
Table 1b reports the TN rates measured through stainless tubes of i.d. 1.5 mm and 6.5 cm in length in
Recent Advances in Science and Technology Research Vol.3 Transmission of N-atoms Produced by N2 Flowing Microwave Afterglows through Hollow Tubes: Advanced Study
Table 1. Transmission rates TN of N-atoms obtained through: (a) silicone tubes of i.d. 1.5 and 3
mm and lengths of 9, 10 and 80 cm in N2 (pulsed and continuous modes) and in Ar-1%N2
continuous modes. (b) stainless steel tubes of i.d. 1.5 mm and 6.5 cm in length, N2 pulsed and
continuous modes
(a) Silicone tubes Plasma gas Number of tubes Tube i.d. (mm) Operating mode Power (W) Flow rate (slm) Pressure (Torr) [N]z0 (1015cm-3) Tube length (cm) TN (%) N2 9 1.5 Pulsed t ≈ 2t = 2s 200 1.0 0.9 – 2.3 3.5 10.0 30.0 N2 9 1.5 Pulsed t ≈ 2t = 2s 200 1.0 0.9 – 2.3 3.5 50.0 3.0 N2 3 3.0 Continuous 300 1.0 4.0 4.2 9.0 35.0 N2 3 3.0 Continuous 300 1.0 4.0 4.2 80.0 8.5 Ar/1%N2 3 3.0 Continuous 150 3.0 20.0 8.2 80.0 8.5
(b) Stainless steel tubes Plasma gas Number of tubes Tube i.d. (mm) Operating mode Power (W) Flow rate (slm) Pressure (Torr) [N]z0 (1015cm-3) Tube length (cm) TN (%) N2 9 1.5 Pulsed t ≈ 2t = 2s 200 1.0 0.9 – 2.3 8.3 6.5 3.5-4.0 N2 9 1.5 Continuous 300 1.0 1.7 8.0 6.5 1.3
4.3 Destruction Probability γ of the N-atoms on the Tube Walls
Estimating that below 15 Torr, the main loss process of the N-atoms along the tubes is due to recombining collisions on the tube walls, it can be written:
[N]z = [N]0 exp – [ γ (c’/2R) (z/v) ] (3)
where z is the axial distance in the silicon tube, [N]0 is the N-atom density at z0=20 cm, c’ is the
thermal gas velocity at 300K (c’ = 5 104 cms-1), R is the radius of 1 tube and v the axial gas velocity . The axial gas velocity is deduced from the N2 flow rate Q by:
Q(p) = S v (4) where Q(p) is the N2 flow rate at pressure p(Torr): Q(p) = 760 Q0 / p (Q0 is the standard flow rate at
760 Torr and 300K) and S is the tube internal surface.
When the flow rate was decreased to 0.125 slpm, a quasi constant pressure was measured in the 5 litre reactor (1-3 Torr) and before the Teflon junction (2-3 Torr, obtained from I580nm intensity
measurements- see Fig. 3).
With eq. (4), it is calculated at 2 Torr an axial gas velocity of 3.7 103 cm sec-1 corresponding to a flow time in the silicon tubes of 1.6 10-2 s up to 60 cm. It is then determined from eq. (3) and (4), a γ value varying from 1.2 to 0.8 10-3 as the pressure in the reactor increased from 1 to 3 Torr. Such values are 3 times lower than published values for Nylon [12]: γ = 3-2 10-3 at 2-3 Torr.
In N2, for 1 slpm and 150 Watt, the pressure before the Teflon junction is found from Fig. 3 to be 10
Torr. For a pressure of 4 Torr in the 5 litre reactor, the mean pressure in the tubes is 7 Torr, the axial velocity is 8 103 cms-1. With TN = 8.5% at 80 cm, it is deduced γ = 1.6 10
-3
, close to the published value for Nylon at 4 Torr : γ = 2 10-3 [12].
With such γ values, the N-atom density at the exit of the 3 silicon tubes of i.d. 3 mm and 250 cm in length can be calculated. It is found concentrations of 1.3 1012 cm-3 for N2 at 1 slm, 150 W, 4Torr in
the 5 litre reactor.
Eqs. (3) and (4) were applied to the results obtained in the stainless steel tubes in part 4.2.
From the I580nm measurement, it is estimated a pressure of 10-16 Torr before the Teflon junction for 4
Torr in the 5 litre reactor .The mean pressure in the tubes is taken between 7-10 Torr. Such a gas pressure is sufficiently low to neglect the N+N+M volume losses when compared to N-atom destruction on the tube walls.
With a N-atom transmission of 1.3% in continuous mode after 6.5 cm of tube length, it is calculated γ = (1.6-2.0) 10-2.
This value is 3-4 times higher than published values in pulsed RF discharge for stainless steel [13]: γ = 5 10-3 at 5 Torr and γ = 6 10-3 at 3 Torr.
5. CONCLUSIONS
Transmission rates of N-atoms through hollow tubes in the flowing late afterglow of a N2 microwave
discharge were measured for silicon tubes of i.d. 3 mm and a length up to 250 cm and for stainless steel tubes of i.d 1.5 mm and 6.5 cm in length. Hollow tubes were inserted through holes drilled a Teflon junction of i.d. 18 mm placed in the N2 afterglow flow before a 5 litre reactor. Depending on the
gas flow, a gas pressure variation is produced before and after the Teflon junction. To switch on the plasma at high gas pressure, it was experimented a pulsed N2 gas mode and Ar-N2 gas mixtures. The
pulsed gas mode was of interest to produce the plasma at lower gas pressure when the gas was off and to maintain it at high pressure when the gas was in.
Compared with the continuous mode, the N-atom transmission through the 1.5 mm i.d stainless steel tubes was found to increase with the pulsed gas mode.
An Ar-1%N2 gas mixture allows to produce plasmas at high flow rates and gas pressures with higher
N-atom densities than in pure N2.
From the measured variations of the N-atom density before and after the tubes, the γ destruction probabilities of the N-atoms on the tube walls has been determined: γ = (1.0-1.6) 10-3 for the silicon tubes and γ = (1.6-2.0) 10-2 for the stainless steel tubes. These probabilities are in good agreement with published values for the silicon tubes but not for the stainless steel tubes which appears to be 3-4 higher.
Such results are of interest for the sterilization of hollow tubes with N2 and Ar-N2 late flowing
afterglows.
COMPETING INTERESTS
Authors have declared that no competing interests exist.
REFERENCES
1. Villeger S, Sarrette JP, Ricard A. Synergy between N and O atom action and substrate temperature in a sterilization process using a flowing N2-O2 microwave post-discharge.,Plasma
Process. Polym. 2005;2:709-711.
2. Villeger S, Cousty S, Ricard A, Sixou M. Serilization of E-coli bacterium in a flowing N2-O2
Recent Advances in Science and Technology Research Vol.3 Transmission of N-atoms Produced by N2 Flowing Microwave Afterglows through Hollow Tubes: Advanced Study
3. Villeger S, Sarrette JP, Rouffet B, Cousty S, Ricard A. Treatment of flat and hollow substrates by a pure nitrogen flowing post discharge. Application to bacterial decontamination in low diameter tubes.,Eur. Phys. J. Appl. Phys. 2008;42:25-32
4. Merel P, Tabbal M, Chaker M, Moisan M, Ricard A. Influence of the field frequency on the nitrogen atom yield in the remote plasma of an high frequency discharge , Plasma Sources Sci. Technol. 1998;7:550.
5. Zerrouki H, Ricard A, Sarrette JP. Determination of N and O – atom and N2(A) metastable
molecule densities in the afterglows of N2 and N2-O2 microwave discharges Contrib. Plasma
Phys. 2013;53:599.
6. Zerrouki H, Ricard A, Sarrette JP. Determination of N and O-atoms and N2(A) metastable
molecule densities in the afterglows of N2-H2, Ar-N2-H2 and Ar-N2-O2 microwave discharges,
Contrib. Plasma Phys. 2014;54:827.
7. Zerrouki H, Ricard A, Sarrette JP. Determination of N and O-atoms, of N2(A) and N2 (X, v>13)
metastable molecules and N2+ ion densities in the afterglows of N2 -H2 , Ar-N2 -H2 and Ar-N2 -O2
microwave discharges, J. Phys.: Conf. Ser. 2014;550:012045.
8. Ricard A, Sarrette JP. Active species densities in R/X%N2 and R/X%(N2-5%H2)(
R=Ar,He)microwave early afterglows, J. Phys.: Conf. Ser. 2019;1243:012001.
9. Ricard A, Moser F, Cousty S, Villeger S, Sarrette JP. Time varying afterglow emission and gas pressure in a pulsed N2 gas microwave flowing discharge at reduced pressure, Eur. Phys. J.
Appl. Phys. 2010;49:13104.
10. Ricard A, Gaboriau F, Canal C. Optical spectroscopy to control a plasma reactor for surface treatments, Surface & Coatings Technology. 2008;202:5220-5224.
11. Capitelli M (Ed.). Non-equilibrium vibrational kinetics, Topics in Current Phys. 1986;56:39. 12. Sarrette JP, Rouffet B, Ricard A. Determination of nitrogen atoms loss probabilities on copper,
aluminium, alumina, brass and nylon surfaces, Plasma Process. Polym. 2006;3:120.
13. Adams SF, Miller TA. Surface and volume loss of atomic nitrogen in a parallel plate of discharge reactor, Plasma Sources Sci. Technol. 2000;9:248.
Biography of author(s)
A. Ricard
LAPLACE, Université de Toulouse, CNRS, INPT, UPS, 118 route de Narbonne, 31062 Toulouse cedex 9, France.
He was born in Clamecy, France. He received the Ph.D. degree, with a thesis on the He and Ne metastable atoms in dc discharge, from Université Paul Sabatier (UPS), Toulouse, France, in 1971. He is currently the Director of research with the LAPLACE laboratory, CNRS–UPS–INP, Toulouse. His expertise is on plasma spectroscopy, kinetics of plasma-excited species, applications to surface treatments, and sterilization. He has been (1960-1962) Ecole Polytechnique Physicist, (1962-1964) Institut Optique Engineer, (1964-1967) Sud-Aviation Engineer, (1967- 2007) CNRS Researcher and from 2007 to till date CNRS Emerite Research Director. His most recent publications are as follows: Ricard A, Sarrette JP (2019) J Phys: Conf Series 1243: 012001; Ryu S, Wang Y, Ricard A, Sarrette JP, Kim A , Kim YK (2019) Surf Coat Technol 364: 341; Y Wang , A.Ricard , J P Sarrette , A.Kim and Y K Kim Surface and Coatings Tech324(2017)243; A.Ricard , J P Sarrette, S G Oh and Y K Kim Plasma Chem and Plasma Process 36(2016)1559; A.Ricard , Soo-Ghee Oh Plasma Source Sciences and Tech 23 (2014)045009
J. P. Sarrette
LAPLACE, Université de Toulouse, CNRS, INPT, UPS, 118 route de Narbonne, 31062 Toulouse cedex 9, France.
He was born in 1965 in Périgueux, France, in 1965. He received a Ph.D. degree in Plasma Physics and Applications from the Paris Sud (XI) Orsay University in 1993 and joined the CNRS (National Centre for Scientific Research) in 1997. He is currently Research Fellow in the LAPLACE laboratory, Toulouse, France and member of the Out of Equilibrium Reactive Plasmas (PRHE) team. His research interests include plasma flow interactions, plasma and afterglow diagnostics and modeling and plasma chemical processes with applications to surface treatment, depollution, decontamination / sterilization and to the treatment of biological cells and tissues.
_________________________________________________________________________________
© Copyright (2020): Author(s). The licensee is the publisher (Book Publisher International).
DISCLAIMER
This chapter is an extended version of the article published by the same author(s) in the following journal. Journal of Analytical Sciences, Methods and Instrumentation, 3: 1-7, 2013.