HAL Id: hal-00301647
https://hal.archives-ouvertes.fr/hal-00301647
Submitted on 19 Apr 2006
HAL is a multi-disciplinary open access
archive for the deposit and dissemination of
sci-entific research documents, whether they are
pub-lished or not. The documents may come from
teaching and research institutions in France or
abroad, or from public or private research centers.
L’archive ouverte pluridisciplinaire HAL, est
destinée au dépôt et à la diffusion de documents
scientifiques de niveau recherche, publiés ou non,
émanant des établissements d’enseignement et de
recherche français ou étrangers, des laboratoires
publics ou privés.
The use of radar in hydrological modeling in the Czech
Republic ? case studies of flash floods
M. Sálek, L. Brezková, P. Novák
To cite this version:
M. Sálek, L. Brezková, P. Novák. The use of radar in hydrological modeling in the Czech Republic ?
case studies of flash floods. Natural Hazards and Earth System Science, Copernicus Publications on
behalf of the European Geosciences Union, 2006, 6 (2), pp.229-236. �hal-00301647�
www.nat-hazards-earth-syst-sci.net/6/229/2006/ © Author(s) 2006. This work is licensed under a Creative Commons License.
and Earth
System Sciences
The use of radar in hydrological modeling in the Czech Republic –
case studies of flash floods
M. ˇS´alek1, L. Bˇrezkov´a1, and P. Nov´ak2
1Czech Hydrometeorological Institute, Brno, Czech Republic 2Czech Hydrometeorological Institute, Praha, Czech Republic
Received: 17 August 2005 – Revised: 24 January 2006 – Accepted: 24 January 2006 – Published: 19 April 2006
COMMAND
Abstract. Flash flood induced by severe convection is the
hydrometeorological phenomenon that is very difficult to forecast. However, the implementation of radar measure-ments, especially radar-based Quantitative Precipitation Es-timate (QPE) and/or radar-based quantitative Precipitation Nowcast (QPN) can improve this situation. If the radar is able to capture the development of severe convection and can produce reasonably accurate QPE in short time inter-vals (e.g. 10 min), then it can be used also with hydrological model.
A hydrological model named Hydrog was used for inves-tigation of simulation and possible forecasts of two flash floods that took place in the Czech Republic in 2002 and 2003. The precipitation input consisted of mean-field-bias-adjusted or original radar 10-min estimates along with quan-titative precipitation nowcasts up to 2 h based on COTREC method (extrapolation). Taking into account all the limited predictability of the severe convection development and the errors of the radar-based precipitation estimates, the aim of the simulations was to find out to what extend the hydrom-eteorological prediction system, specifically tuned for these events, was able to forecast a the flash floods. As assumed, the hydrometeorological simulations of the streamflow fore-casts lagged behind the actual development but there is still some potential for successful warning, especially for areas where the flood hits lately.
1 Introduction
The modernization of the Czech weather radar network (CZRAD) in late nineties resulted in considerable enhance-ment of the utilization of the radar precipitation estimates
Correspondence to: M. ˇS´alek
(salek@chmi.cz)
in the Czech Hydrometeorological Institute. Since 2003 the hydrologists and meteorologists have available four types of areal precipitation estimates: The original radar esti-mate made from reflectivity in (pseudo)CAPPI 2 km, radar estimate adjusted by mean field bias (adjustment factor), raingauge-only estimate and combined estimate computed by double optimum estimation method (Fulton et al., 1998; ˇS´alek et al., 2004). Hourly radar-raingauge combined esti-mates are routinely used as an alternative precipitation input for hydrological models applied on several catchments in the Czech Republic. Nevertheless, the same data format allows for utilization of any of the estimates (radar, adjusted radar, gauge-only, combination). These possibilities lead also to investigations of the potential to simulate and/or forecast the course of flash floods.
Flash floods are among the most dangerous phenomena which threatens most countries in the world. They can be defined as “a flood that rises and falls quite rapidly with little or no advance warning, usually the result of intense rainfall over a relatively small area” (AMS, 2001). Some authors include also flash flooding caused by dam or levee failure or by ice jam or intensive snowmelt (Davis, 2001) but in this contribution the authors concentrate only to the flash flood induced by heavy rainfall from local convective storms.
The flash flood appears as a consequence of many factors and their combinations. As indicated above, the first prereq-uisite of the (rain-induced) flash flood occurrence is exces-sive rainfall, but the key is in the specification of “excesexces-sive”. The same rainfall depth can in a given place result in almost no hydrological response, or, under “adverse” conditions in other place the rainfall can cause severe flooding. Any at-tempt to simulate or forecast flash flooding must therefore take into account both the rainfall intensity along with its spatial distribution and the hydrological (geographical) con-ditions of the given area, especially the physical characteris-tics of the catchment like slope, soil moisture, hydrological permeability etc. (Davis, 2001). One of the key issue is the
230 M. ˇS´alek et al.: Use of radar in hydrological modeling geographical distribution of the precipitation with the respect
to the watersheds. The size of the “elementary” catchments used in any hydrometeorological flash flood warning system or modeling must be therefore at similar or less size than the scale of typical flash flood producing storm, i.e. about several square kilometers (e.g. about 5 km2, see also Davis, 2001).
The convective rainfall and possibly resulting flash floods are very difficult to forecast (e.g., Doswell et al., 1996). Al-though the conditions leading to convective storms are rel-atively known and can be forecast with the moder analy-sis tools and Numerical Weather Prediction (NWP) mod-els, the sufficiently accurate location, timing and severity of the particular storm before its onset are very weakly predictable. Concerning the initiations of new convective cells, some progress has been reported when using uncon-ventional(denser) data (Roberts and Wilson, 2004) but for the time being the NWP outputs are of little direct quantita-tive use for timely and localized flash flood forecasts.
The only possibility to have a warning system against flash flood lies in the monitoring of the actual development and a suitable nowcasting (forecasting up to several hours) tech-nique. Leaving aside river stage monitoring, the convective storm evolution can be captured by remote sensing meth-ods, especially by weather radar. Weather radar is able to present the 3-dimensional storm development in short time interval (5–15 min) which can be considered as reasonably sufficient. The spatial resolution is generally dependent on the range of the storm from the radar site but reaches accept-able values from several hundreds to several thousands me-ters. Not only has the radar the ability to present the current situation but, although with rapidly decreasing performance, it can provide the user with prediction of the storm move-ment by several extrapolation algorithms (see, e.g., Wilson et al., 1998; Nov´ak, 2004). The decrease of this extrapo-lation performance of convective storm is due to its highly non-linear evolution. According to Nov´ak (2004) or Wil-son et al. (1998), the reaWil-sonable time for the convective cell extrapolation reaches 30, respectively 20 min. Although sev-eral sophisticated techniques have been developed (see, e.g., Wilson et al., 1998; Keenan et al., 2003), their proper imple-mentation requires high cost including additional dense mea-surements and they do not exhibit big improvement regard-ing Quantitative Precipitation Nowcastregard-ing (QPN, see Pierce et al., 2004).
The motivation for this work is as follows: If radar mon-itoring and extrapolation is used in real-time with the con-junction with a hydrological model “tuned” for flash flood simulation/forecasting, what is the possibility of a successful warning against flash floods? Here are further assumptions:
– The radar-based Quantitative Precipitation Estimates
(QPE) are reasonably accurate
– Running system of radar-based Quantitative
Precipita-tion Nowcasting is available for every radar measure-ment
– Running hydrological model for every radar
measure-ment
– The “elementary” catchment size is approximately
equal to or less than the (horizontal) storm scale
– The delay of data and warning delivery are negligible
We simulated the forecasting process on two cases of flash floods from the years 2002 and 2003 which took place in the eastern part of the Czech Republic. For the flash floods “reconstruction” only proxy data were available, i.e. the ac-tual flood course in the particular places is known only from the terrain in-situ measurement taken after the event, flood record made by local authorities, videotapes and witnesses. Hence, although being the best estimate, the discharge dis-tribution is obviously an approximation of the actual flood development. The most important criterion which was taken when simulating the flash flood by the hydrological model was the time and magnitude of peak discharge.
2 The method
2.1 Radar data
The Czech Hydrometeorological Institute runs modern weather radar network (CZRAD) consisting of two state-of-the-art Doppler C-band weather radars, which cover the en-tire area of the Czech Republic by volume scans in 10-min update rate up to 256 km range (Nov´ak and Kr´aˇcmar, 2002). Full volume scan is divided into two partial subscans mea-sured every 5 min.
The most frequently used radar product of CZRAD is the maximum radar reflectivity composite field, but pseudo-CAPPI 2 km radar reflectivity was found to be better for radar precipitation estimates. That’s why pseudoCAPPI 2 km was chosen also for this case study. The composite covers the entire territory of the Czech Republic together with its close surroundings in 1 km horizontal resolution that enables a bet-ter inbet-terpretation of radar echoes (mainly in convective situa-tions). It is updated every 10 min from full volume scan data. During composition, the highest reflectivity value is taken for pixels for which measurements from more radars are avail-able. Due to fast data lines between radar sites and the center and optimized volume radar processing software radar com-posites are available in the second minute after the end of the 10-min measurements.
The Marshall-Palmer formula in the form ze=200R1.6 is
used for radar reflectivity – rain rate recalculation. There are two modifications applied to the formula; R(Z<7dBZ)=0 condition is used to eliminate weak non-precipitation echoes and R(Z>55dBZ)=R(55dBZ) condition is applied to re-duce overestimation caused by hails.
Several prediction methods of radar echo nowcasting were tested during the last years (Nov´ak et al., 2002) and two
of them were implemented into operational processing of CZRAD in the beginning of 2003 (Nov´ak, 2004). Both meth-ods are used for prediction of entire radar image domain (they do not distinguish between convective and stratiform part of radar echo).
The COTREC (Continuity Tracking Radar Echoes by Cor-relation) method was used for this work. The COTREC is based on the well known method described e.g. by Zgonc and Rakovec (1999) or Mecklenburg et al. (1999). Wind field is determined by comparison of two consecutive radar images using the mean absolute difference as similarity cri-terion. The motion wind vector is determined in 3 steps over different radar domains starting over the whole radar image and finishing with 25 small (44×44 km) boxes. The conti-nuity of the motion wind vector from bigger to smaller do-mains is checked to reduce unwanted high variability of mo-tion vector. At the end, the successive over-relaxamo-tion (SOR) algorithm is applied to smooth the final wind field.
In the second step last available the radar images are ex-trapolated up to 90 (120) min in 10-min time steps. Extrap-olation is based on the method of backward trajectories; for each pixel of a forecast image, the corresponding pixel in the starting radar image is searched for. Two basic assumptions are made during the extrapolation; motion wind field is con-sidered to be constant in time and the growth/decay factor of radar echo is not applied.
2.2 Hydrological modeling 2.2.1 HYDROG model
There exists a number of various methods which enable the simulation of rainfall-runoff process on a catchment. For op-erative forecasts of runoff from a catchment, it is necessary to use models which will facilitate the modelling of the rainfall-runoff process continuously within the whole catchment, and on a simple-enough basis. The used model must duplicate well the temporal and spatial pattern of the causative pre-cipitation, the hydrological balance (the gradual subtraction of hydrological losses, i.e. evapotranspiration, efect of inter-ception, moisture absorption, surface retention and infiltra-tion), the hydrological routing of runoff, and the course of groundwater runoff. Such requirements are met especially by distributed rainfall-runoff models. When operatively fore-casting runoff from a catchment, the speed of computation is a necessary condition. In our case, we have used the HY-DROG rainfall-runoff model (Star´y, 1991–2005), which has been used routinely in Czech Hydrometeorological Institute since 2000 for operative discharge prediction in several rural catchments of typical area about thousands of square kilome-ters.
If we perform a schematization (Fig. 6) of a catchment by subdividing it into subcatchments with constant proper-ties (slope, roughness, hydraulic conductivity in a saturated environment), the rainfall-runoff process can be solved in a
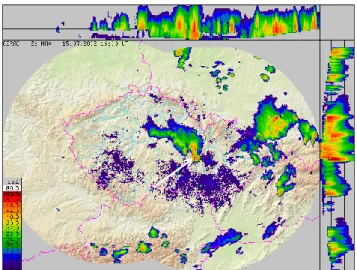
Fig. 1. Radar picture of the flash flood producing storm at the small river Hodon´inka at 16.00 UTC. The arrow points to affected area around Oleˇsnice town.
simplified way, i.e. as a one-dimensional problem. When simulating the flow of water through a subdivided catchment (spatial-surface runoff and concentrated runoff), the Saint-Venant Equations (continuity equation and an equation based on the law of motion preservation) simplified by a kine-matic wave approximation (Stephenson and Meadows, 1986) are used for the description of the dynamic performance of the system. For the computation of the dynamic change of groundwater runoff a conceptual regression model (McCuen and Snyder, 1986), which uses only groundwater storage, is used.
Of the hydrological losses, an important one is the infiltra-tion loss – for its calculainfiltra-tion the model use the modified Hor-ton method (Jacobsen, 1980), which estimates the amount of initial infiltration from the rainfall sum that occurred in the preceeding period (week). Other losses are included in the initial threshold value, when the aerial surface runoff is trig-gered off only after this value is exceeded.
For more detail describtion of HYDROG model see (Star´y, 2005).
2.2.2 Flash flood modeling
For purpose of modeling of flash floods a very detail decom-position (schematization) of a given catchment was made, the average size of areal elements was about 1 square kilometer (Figs. 2 and 7).
The model was calibrated on the basis of a simulation of tested flash floods. The amount of input rainfall was esti-mated by the comparison of radar measurement and terrain reconnaissance done immediately after the flood. For input rainfall the catchment was divided into several areal elements of average size about 7 square kilometers (Figs. 3 and 8).
232 M. ˇS´alek et al.: Use of radar in hydrological modeling
Fig. 2. Schematization of Hodon´inka catchment. The catchment was divided into 54 areal elements (27 sections of water courses).
For each areal element the mean rainfall intensity, e.g. radar-based QPE was computed by step of 10 min. The size of the discharge was either measured directly (if there was a gaug-ing station within the catchment), or was computed, again on the basis of reconnaissance. The model was calibrated to minimize the diffrence between calculated and measured (or estimated) values of discharge.
When calculating the discharge predictions, for each areal element the mean rainfall intensity, e.g. radar-based QPE to-gether with QPN (2-h COTREC extrapolation and 1-h PER-SISTENCE) was computed by step of 10 min. Then the sim-ulation of water runoff was made. We were interested in dis-charge value at the closing profile of the catchment. This way we recieved the serie of discharge predictions (by step of 10 min).
We have to mention that the average size of areal elements for which the mean rainfall intensity was computed is about 7 square kilometers. The elements of smaller size were also tested but without any significant influence to the result hy-drograms.
2.3 Flash flood on 15 July 2002 at Hodon´inka creek The flash flood occurred 15 July 2002 in evening hours at Hodon´inka creek whose catchment is located approximately 30–40 km northwest from Brno (see Fig. 1). It was a
con-Fig. 3. Rainfall accumulation in Hodon´inka river basin on 15 July 2002 from 15:00 to 21:00 CET. Areal adjuseted radar-based QPE, rainfall measured by raingages and rainfall obtained by terrain in-vestigation. The rainfall accumulation measured by radar was un-derestimated roughly by factor of 0.6.
sequence of pronounced convective development which, un-like the other convective cells in the area, exhibited quasi-stationarity in the given area. This “stalling” of the con-vective storm can be explained as an interaction of convec-tive density current (outflow) and environmental flow which also “supplied” the storm by conditionally unstable air from the southeast. According to the radar measurements, first storm cells appeared nearby the area at 15:00 UTC, the most pronounced convective activity was observed from 15:30 to 18:00 UTC while the heaviest rainfall lasted 90 min, roughly from 16:00 to 17:30 UTC according to the witnesses.
The flood is likely to the biggest flash flood since July 1998 in the territory of the Czech Republic. It caused two fatalities and damage of 5.5 mil EUR. The streamflow return period was estimated as more than 200 years. The highest daily precipitation depth measured in the area by raingauges was 171 mm at a regular raingauge station in Oleˇsnice town. The highest radar estimate in the affected area (not exactly collocating with Oleˇsnice raingauge station) was 98 mm, i.e. the rainfall accumulation was underestimated roughly by factor of 0.6 (see also Fig. 3). It can be explained by attenua-tion and also by storm dynamics leading in strong downdraft the result of which is much more net flux of the precipitation
Table 1. Characteristics of the Hodon´inka river catchment. Characteristic Value Catchment area 67.9 km2 Minimal altitude 340 m Maximal altitude 760 m Mean altitude 591 m
Number of areal elements (HYDROG) 54 Average area of areal elements (HYDROG) 1.3 km2 Number of radar areal elements 9 Average area of radar QPE areal elements 7.5 km2
ˇStˇep´anov profile – 100-year peak discharge 64 m3s−1
towards the earth surface then “assumed” by constant Z–R relationship (Dotzek and Fehr, 2003). This downdraft effect shifts also the radar-based precipitation intensity towards the region of updraft where the radar is more likely to overesti-mate the rainfall at the ground. It has to be mentioned that Davis (2001) points out the possibility that the radar under-estimation in convective storm is due to warm (tropical) pre-cipitation process where the rain droplets grow mainly by coalescence.
The characteristics of Hodon´inka river catchment are sum-marized in Table 1. It is located in a hilly terrain with the av-erage altitude of 591 m. The schematization of the catchment is shown on Fig. 2.
Since our effort aimed to simulation of “real” forecast-ing process, no additional adjustment was performed and only routinely adjusted radar-based QPE were used for ev-ery 10 min (adjustment factor of the “most influencing” radar was in the time of the event very close to one, between 0.98 and 1.1, i.e. the routine adjustment was not too important). The min QPEs and 2-h COTREC-based QPNs for 10-min interval were calculated for predefined subdomains of the Hodon´inka catchment and served as a precipitation input for hydrological model HYDROG. Both the QPEs and QPNs were made from the composite images.
The results of hydrological modeling – the discharge pre-dictions at the ˇStˇep´anov profile (located at the tributary to bigger river called Svratka) – are shown on Fig. 4. The first hint that “something dangerous” could happen was gained at 17:30 CET – approximately 50 min before huge flooding in the ˇStˇep´anov town (even if the rainfall measured by radar was underestimated approximately by factor of 0.6). This first warning was confirmed by followed predictions at 17:40 and 17:50 CET. In fact at 17:30 CET the villages at the higher al-titudes were already flooded and they warned the inhabitants of ˇStˇep´anov town. Nevertheless, the result is still interesting because it indicates that in some cases (e.g. uninhabited area at the upper part of the catchment) such warning given by hydrologists can help.
Fig. 4. Discharge forecasts at ˇStˇep´anov profile, 17:30 and 17:50 CET. The first warning of danger of flood could have been given 50 min, the second warning 30 min before large flooding in ˇStˇep´anov town. The villages situated at higher altitudes were al-ready flooded.
Fig. 5. Radar picture of the flash flood producing storm at Sloup vil-lage at 12.40 UTC. The arrow points to affected area around Sloup village.
2.4 Flash flood on 26 May 2003 at Sloup
This flood took place in the early afternoon in several small catchments located about 25 km north-northeast of Brno. The causative convective storm developed at 11:20 UTC sev-eral kilometers northwest from this village (see Fig. 5) and stayed at this place about until 13:20 almost without appar-ent movemappar-ent except southern propagation of the reflectivity maximum. The cause of such lingering of this storm is prob-ably similar to the Hodon´inka case – “suitable” interaction between the storm outflow and environmental flow resulting in updrafts (and then downdrafts) forming repeatedly at al-most the same location.
234 M. ˇS´alek et al.: Use of radar in hydrological modeling
Fig. 6. Schematization of a river basin for hydrological model HY-DROG. The catchment is divided into sections of water courses, adjacent areal elemets and into reservoirs.
Table 2. Characteristics of the Sloup creek catchment.
Characteristic Value
Catchment area 49.9 km2
Minimal altitude 470 m
Maximal altitude 734 m
Mean altitude 617 m
Number of areal elements (HYDROG) 70 Average area of areal elements (HYDROG) 0.7 km2 Number of radar areal elements 7 Average area of radar QPE areal elements 7.1 km2 Sloup profile – 100-year peak discharge 35 m3s−1
The resulting flood affected several villages, total damage was almost 1 mil EUR. In most affected Sloup village 80 houses and many other buildings were flooded, the stream-flow return period was more than 50 years.
The terrain investigation found the highest rainfall depth of 90 mm while the radar-based highest QPE in the area was 69, respectively 70 mm after mean-field-bias adjustment. It has to be noted that in the distance of the 1.5 km from the 90 mm recording gauge another amateur raingauge measured only 5 mm of rainfall (see Fig. 8). Unlike the Hodon´inka case, pronounced hailfall, yet without damaging hailstones, was observed.
As in previously mentioned case, for every 10-min radar measurement the rainfall intensities and COTREC-based forecast up to 2 h were computed using data from both Czech radars. Since both convective events exhibit mean-field bias adjustment not significant, this time we decide to use original radar estimates without any adjustment.
Fig. 7. Schematization of Sloup creek catchment. The catchment was divided into 70 areal elements (35 water courses sections).
Fig. 8. Rainfall accumulation in Sloup creek catchment on 26 May 2003 from 12:00 to 16:00 CET. Areal radar-based QPE, rainfall measured by raingages and rainfall obtained by terrain investiga-tion. The rainfall accumulation measured by radar was underesti-mated roughly by factor of 0.9.
Again the sequention of potencial hydrologic predictions by step of 10 min was made. The schematization of Sloup creek catchment is shown on Fig. 7, the catchment of total area about 50 square kilometers was divided into 70 areal elements (35 water course sections). We calculated the dis-charge at Sloup profile – the closing profile of the catchment. The basic characteristics of the catchment are summarized in Table 2.
The discharge prediction at Sloup profile at 13:20 CET is depicted on the Fig. 9 – the first warning could have been given about one hour before peak discharge at 14:20 CET. Following prediction at 13:40 CET confirmed that a danger-ous flooding could have occured.
3 Summary and conclusions
The forecast simulations of the case studies were provided under rather idealized conditions when the hydrological model is tuned to cope reasonably well with the simulation of the radar-estimated heavy precipitation and runoff process in the given catchment. Therefore it must be considered as the “upper limit” of what an up-to-date hydrometeorological forecasting system can provide in these events. It is obvious that the main limitation lies in unpredictability of the particu-lar convective storm development. Although new algorithms are being developed, the improvement of the QPN in convec-tive situations is not likely to be too significant in the near fu-ture. Therefore, any operational flash-flood warning system based on above outlined system will be very often lagging behind the actual development. However, as the flood wave takes also some time to reach lower-lying downstream areas, there is some possibility for successful warnings using this system for these locations. As mentioned above, we do not consider local warning system based on rivergauging stations which poses another option.
It has to be mentioned that the use of the extrapolation sys-tem COTREC not only fails to predict development of new convective cells but it also unable to forecast decay of the already existing storms. The relatively successful stream-flow predictions in Sloup case were caused by “stalling” of the storm that was well captured by the COTREC algorithm. But, if the storm had decayed (which no one can forecast nor exclude at the very moment), then the resulting prediction would have been false alarm. The false alarm rate will be probably the biggest potential weakness of the system if it is operationally used.
One of the problem which had to be dealt with was the size of areal elements for which the radar based QPE is computed. As mentioned, the maximum reflectivity often does not col-locate with the ground precipitation measurement for many reasons, among them the down- and updraft effects should be noted. Although it is recommended to calculate the mean areal precipitation for rather small areas, there is also a lower limit of the size of the elementary domain which can be set
Fig. 9. Discharge forecast at Sloup profile, 13:20 CET. The warning of danger of large flooding could have been given one hour before peak discharge at 14:20.
as a similar size as the convective storm cell, i.e. roughly of several square kilometers where the downdraft/updraft ef-fects are more likely to compensate. However, this recom-mendation is not going to be universal; e.g. some dedicated radar measurement “tuned” for small areas (city, small catch-ments etc.) can provide more detailed information closer to the ground where the dowdraft/updraft effects are not so pro-nounced.
Even though the system is affected by a great measure of uncertainties, we will continue in testing of possibility of flash flood forecasting with other cases.
Acknowledgements. This work was supported by grants No. 205/04/0114 and No. 103/04/0352 of the Czech Science Foundation.
Edited by: H. Miyamoto Reviewed by: one referee
References
AMS: Glossary of Meteorology, Second Edition, AMS, 2001. Davis, R. S.: Severe Convective Storms, edited by: Doswell, C.,
chap. Flash Flood Forecast and Detection Methods, AMS, 2001. Doswell, C. A., Brooks, H. E., and Maddox, R. A.: Flash Flood Forecasting: An Ingredients-Based Methodology, Weather and Forecasting, 11, 1996.
Dotzek, N. and Fehr, T.: Relation between precipitation rates at the ground and aloft–a modeling study, J. Appl. Meteor., 42, 1285– 1301, 2003.
Fulton, R., Breidenbach, J., Seo, D.-J., Miller, D., and O’Bannon, T.: The WSR-88D rainfall algorithm, Weather and Forecasting, 13, 377–395, 1998.
Jacobsen, P.: Urban Surface Runoff Simulation, Technical Univer-sity Denmark, Lyngby, Denmark, 1980.
Keenan, T., Joe, P., Wilson, J., Collier, C., Golding, B., Burgess, D., May, P., Pierce, C., Bally, J., Crook, A., Seed, A., Sills, D., Berry, L., Potts, R., Bell, I., Fox, N., Ebert, E., Eilts, M.,
236 M. ˇS´alek et al.: Use of radar in hydrological modeling
OLoughlin, K., Webb, R., Carbone, R., Browning, K., Roberts, R., and Mueller, C.: The Sydney 2000 world weather research programme forecast demonstration project, Bull. Amer. Meteor. Soc., 84, 1041–1054, 2003.
McCuen, R. and Snyder, W.: Hydrologic Modeling. Statistical Methods and Applications, Prentice Hall, New Jersey, 1986. Mecklenburg, S., Schmid, W., and Joss, J.: COTREC – a simple
and reliable method for nowcasting complex radar pattern over complex orography, in: Final Seminar of COST-75, 441–450, 1999.
Nov´ak, P.: Czech weather radar data utilization for precipitation nowcasting, in: European Conference on Radar in Meteorology (ERAD), vol. 2 of ERAD Publication Series, 459–463, 2004. Nov´ak, P. and Kr´aˇcmar, J.: New data processing in the Czech
weather radar network, in: European Conference on Radar in Meteorology (ERAD), vol. 1 of ERAD Publication Series 328– 330, 2002.
Nov´ak, P., Walder, J., and Kr´aˇcmar, J.: The first attempts at the radar echo prediction in the Czech weather radar network, in: European Conference on Radar in Meteorology (ERAD), vol. 1 of ERAD Publication Series, 55–58, 2002.
Pierce, C. E., Ebert, E., Seed, A. W., Sleigh, M., Collier, C. G., Fox, N. I., Donaldson, N., Wilson, J. W., Roberts, R., and Mueller, C. K.: The Nowcasting of Precipitation during Sydney 2000: An Appraisal of the QPF Algorithms, Weather and Forecasting, 19, 7–21, 2004.
Roberts, R. D. and Wilson, J. W.: Assessment of the RUC10 fore-casts of storm initaition during IHOP, in: European Conference on Radar in Meteorology (ERAD), vol. 2 of ERAD Publication Series, 183–187, 2004.
Star´y, M.: HYDROG – Program system for simulation, operative prediction and operative control of water runoff, T´aborsk´a 110, Brno 61 500, Czech Republic, 1991–2005.
Star´y, M.: Operative control outflow from river basins during flood-ings and use of artificial inteligence methods, VUTIUM Brno, Czech Republic, 2005.
Stephenson, D. and Meadows, M.: Kinematic Hydrology and Mod-eling, Elsevier NewYork, 1986.
ˇS´alek, M., Nov´ak, P., and Seo, D.: Operational application of com-bined radar and raingauges precipitation estimation at the CHMI, in: European Conference on Radar in Meteorology (ERAD), vol. 2 of ERAD Publication Series, 16–20, 2004.
Wilson, J. W., Crook, N. A., Mueller, C. K., Sun, J., and Dixon, M.: Nowcasting Thunderstorms: A Status Report, Bull. Amer. Meteorol. Soc., 79, 2079–2099, 1998.
Zgonc, A. and Rakovec, J.: Time Extrapolation of Radar Echo Pat-terns, in: Final Seminar of COST-75, 229–238, 1999.